Abstract
Gallium arsenide (GaAs) is a semiconductor utilized in electronics and computer industries. GaAs exposure of animals causes local inflammation and systemic immune suppression. Mice were administered 2 to 200 mg/kg GaAs. On day 5, intratracheal instillation increased lung weights in a dose-dependent manner and induced pulmonary inflammation exemplified by mononuclear cell infiltration and mild epithelial hyperplasia. No fibrosis, pneumocyte hyperplasia, proteinosis, or bronchial epithelial damage was observed in the lungs. Splenic cellularity and composition were unaffected. GaAs' effect on antigen presentation by macrophages was similar after intratracheal and intraperitoneal exposure, although the lowest observable adverse effect levels differed. Macrophages from the exposure site displayed an enhanced ability to activate an antigen-specific CD4+ helper T-cell hybridoma compared with vehicle controls, whereas splenic macrophages were defective in this function. The chemical's impact on peritoneal macrophages depended on the exposure route. GaAs exposure augmented thiol cathepsins B and L activities in macrophages from the exposure site, but decreased proteolytic activities in splenic macrophages. Alveolar macrophages had increased expression of major histocompatibility complex (MHC) Class II molecules, whereas MHC Class II expression on splenic and peritoneal macrophages was unaffected. Modified thiol cathepsin activities statistically correlated with altered efficiency of antigen presentation, whereas MHC Class II expression did not. Our study is the first one to examine the functional capability of alveolar macrophages after intratracheal GaAs instillation. Therefore, thiol cathepsins may be potential target molecules by which GaAs exposure modulates antigen presentation.
INTRODUCTION
Gallium arsenide (GaAs) is an intermetallic compound utilized by the military, and electronics and communications industries as a semiconductor (Gochfield, 1990; Nordwall, Citation1994). GaAs wafers are an important component of microwave integrated circuits, field effect transistors, light-emitting diodes, solar cells, and room temperature lasers (Jenkins et al., Citation1994; Nordwall, Citation1994; Staedter, Citation2002). Industrial workers may be exposed to the chemical during several production stages of GaAs wafers (Edelman, Citation1990; Sheehy and Jones, Citation1993). Although the health risk of occupational GaAs exposure remains unclear, industrial workers have significantly elevated arsenic levels in their hair and urine (Yamauchi et al., Citation1989; de Peyster and Silvers, Citation1995). Based on animal and in vitro studies, GaAs is classified as an immunotoxicant and a carcinogen (WHO, Citation1992; ATSDR, Citation2000). Intratracheal and inhalation GaAs exposure of rodents produce pulmonary inflammation, fibrosis, proteinosis, and pneumocyte and epithelial hyperplasia (Webb et al., Citation1986; NTP, Citation2000; Tanaka, Citation2004). Studies concerning immune competency have concentrated on systemic effects. After a single intratracheal (Sikorski et al., Citation1991a, Citation1991b), intraperitoneal (Lewis et al., Citation1996) or oral exposure (Flora et al., Citation1998), the chemical causes dose-dependent systemic suppression of humoral and cell-mediated immunity. Because arsenic chelators prevent or at least partially reverse impaired immune functions, arsenic is viewed as the main component responsible for the chemical's immunotoxicity (Burns et al., Citation1991; Flora and Kumar, Citation1996), although the mechanism mediating GaAs-induced immune suppression remains unknown.
Helper CD4+ T-cells are important regulatory cells of the immune system. Antigen-specific responses by helper CD4+ T-cells require their interaction with antigen-presenting cells, because presenting cells produce T-cell receptor ligands via antigen processing (Watts, Citation2001; Honey and Rudensky, Citation2003). Antigen processing involves multiple steps ultimately resulting in a protein antigen fragment bound to major histocompatibility complex (MHC) Class II molecule (Watts, Citation2001; Honey and Rudensky, Citation2003). This molecular complex is expressed on the surface of antigen-presenting cells and is recognized by helper T-cells (Watts, Citation2001; Honey and Rudensky, Citation2003). Antigenic peptides must have the ability to bind MHC Class II molecules. Internalized protein antigens are cleaved within acidic endosomes and/or lysosomes, and these organelles contain multiple proteases (Riese and Chapman, Citation2000; Turk et al., Citation2001). Treatment of antigen-presenting cells with protease inhibitors implicates thiol cathepsins as cleaving antigens (van der Drift et al., Citation1990; Katunuma et al., Citation2004). Newly synthesized MHC class II heterodimers bind invariant chain, which has a sorting signal directing MHC Class II molecules to a specialized compartment where peptide loading occurs (Newcomb and Cresswell, Citation1993; Elliot et al., Citation1994). Degradation of invariant chain is crucial for antigenic peptides to bind MHC Class II molecules (Newcomb and Cresswell, Citation1993; Elliot et al., Citation1994). Thiol cathepsins also mediate invariant chain cleavage. Mice genetically lacking either thiol cathepsins L and/or S are defective in degrading invariant chain, and helper T-cell responses are compromised (Nakagawa et al., Citation1998; Hsieh et al., Citation2002). Hence, defective antigen processing by presenting cells impairs helper T-cell responses to antigens.
Previously, we reported that intraperitoneal GaAs exposure has two opposing effects on antigen processing depending on the anatomical location of antigen-presenting cells relative to the exposure site. Splenic macrophages and B-cells exhibit defective antigen processing (Lewis et al., Citation1996; Gondre-Lewis et al., Citation2003), whereas peritoneal macrophages have an enhanced ability to process antigens (Hartmann and McCoy, Citation1996). Changes in antigen processing efficiency are accompanied by altered enzymatic activities of thiol cathepsins (Lewis et al., Citation1998). In the current study, we examined the impact of intratracheal GaAs exposure, which is more relevant to human exposure, on antigen presentation in comparison to intraperitoneal exposure. GaAs administered by both routes modulated the ability of macrophages to present antigen in similar manner, although the lowest observed adverse effect levels differed. Altered efficiency in antigen presentation correlated with changes in thiol cathepsin activities, but not with MHC Class II expression. We propose that thiol cathepsins may be target molecules involved in GaAs-induced immune modulation.
MATERIALS AND METHODS
Chemical Exposure
Female C3D2F1/J mice (The Jackson Laboratory, Bar Harbor, ME) were used from 9 to 12 weeks of age. Mice were housed four to a cage under specific pathogen-free conditions. Studies were conducted under an IACUC approved protocol (0309-3250). Mice were exposed to a single GaAs administration from 2 to 200 mg/kg body weight (Research Triangle Institute, Research Triangle Park, NC) as a suspension of particles with a mean 1.5 μm-diameter in saline containing 0.05% Tween 80. Control mice received the vehicle consisting of 0.05% Tween 80 in saline. All suspensions were prepared immediately before use. Intratracheal instillation was performed as described (Sikorski et al., Citation1991a). Briefly, mice were anesthetized with metofane and placed at a 30° angle with their head pointing upward. Agents were instilled using a 23-gauge blunted needle attached to a syringe, and air was injected to ensure delivery into the lungs. Another set of mice was exposed by intraperitoneal injection. Organs and cells were obtained 5 days after exposure, which is the same time point utilized in our previous GaAs studies to allow a comparison. Alveolar cells were collected from exsanguinated, euthanized animals by bronchoalveolar lavage with 5 ml of Hanks' buffered salt solution lacking Ca+ 2 and Mg+ 2 ions. Spleens were aseptically removed, and cell suspensions were prepared as described (McCoy et al., Citation1983). Peritoneal cells were harvested by peritoneal lavage as described (McCoy et al., Citation1993). For immunofluorescence staining and T-cell responses, cells were pooled from 4 mice per group. For cathepsin assays, lysates of pooled cells were prepared from 5 mice per group.
Histology and Cell Morphology
Lung lobes were infused with 10% neutral buffered formalin, separated, and immersed in formalin. Tissues were embedded in paraffin, serially sectioned, stained with hematoxylin and eosin, and mounted in permount by Department of Histology (Virginia Commonwealth University, Richmond, VA). Alveolar cells were deposited onto microscope slides by Shandon Elliot cytocentrifuge (Pittsburgh, PA). Slides were air dried, fixed in methanol, stained with Hema-Quik II Wright-Giemsa stain (Fisher, Norcross, GA), and mounted in Permount. Morphologic criteria were used to classify 500 cells by cell lineage (McCoy et al., Citation1983).
Preparation of Splenic and Peritoneal Macrophages
Splenic and peritoneal cells at 1 × 10⁷/ml were incubated with saturating amounts of monoclonal anti-B220 (RA3-3A1) and anti-Thy-1.2 (J1j.10) antibodies (American Type Culture Collection, Manassas, VA), and rabbit complement (Cedarlane, Ontario, CA) as described (Lewis et al., Citation1996). Remaining splenic cells were > 80% Mac-1+ cells, < 5% B220+ B-cells, and < 2% Thy-1+ T-cells for all exposure groups as assessed by immunofluorescence staining and flow cytometry. For peritoneal cells, < 5% of cells were B220+ B or Thy-1+ T-cells, and > 85% were Mac-1+ based on flow cytometry.
Immunofluorescence Staining and Flow Cytometric Analysis
Cells were stained with coincubation with 25 μg normal mouse IgG to block Fc receptors as described (Lewis et al., Citation1996). For 1-color analysis, cells were incubated with monoclonal anti-B220, anti-Thy-1.2, anti-Mac-1 (M1/70), anti-Mac-3 (M3/84), or irrelevant anti-Thy-1.1 (OX-7) antibodies, followed by fluoresceinated monoclonal anti-rat κ light chain (MARK) antibody. For 2-color analysis, cells were incubated with fluoresceinated monoclonal anti-MHC I-Ek Class II molecule (17.3.3S) or irrelevant anti-MHC I-Ab Class II molecule (MRC OX-3; Serotec USA, Washington, DC) antibodies, followed by biotinylated anti-Mac-3, anti-Mac-1 or irrelevant anti-Thy-1.1 antibodies and then phycoerythrin-conjugated streptavidin (Life Technologies, Rockville, MD). M1/70, M3/84, 17.3.3S and OX-7 were purchased from BD BioSciences PharMingen (San Diego, CA). Fluorescence intensity of cells was measured with logarithmic amplification using a Becton-Dickinson FACScan (San Diego, CA). Data on 20,000 or 50,000 cells were collected, and forward-angle and side scatter gates were set to exclude cell clumps and dead cells.
T-cell Stimulation Assay
Pigeon cytochrome c-specific, I-Ek-restricted murine T-cell hybridoma 2B4.11, which recognizes 81-104 peptide, was provided by Dr. Ronald H. Schwartz (National Institutes of Health, Bethesda, MD), and pigeon cytochrome c was purchased from Sigma-Aldrich Chemical Co. (St. Louis, MO). Stimulation cultures were previously described (Harrison et al., Citation2003). Briefly, 3 × 10⁴ 2B4.11 cells were cultured with 2.5 × 10⁴ alveolar cells or peritoneal macrophages, or 5 × 10⁴ splenic macrophages in medium or various cytochrome concentrations. After 24 hours, cell-free culture supernatants were collected, and interleukin-2 (IL-2) was measured using an antibody-sandwich enzyme-linked immunosorbent assay (ELISA) (Pierce Endogen, Rockland, IL). Absorbance at 450 nm was measured with a Spectramax 250 microplate reader (Molecular Devices, Sunnyvale, CA), and IL-2 quantities in samples were calculated from standard curves of recombinant IL-2 (R & D Systems, Minneapolis, MN).
Thiol Cathepsin Activity Assays
Proteolytic activities were measured as described (Harrison et al., Citation2003). Briefly, cells were lysed in phosphate-buffered saline containing 0.75% Triton X-100 at 1 × 10⁸ cells/ml. Protein content of cell lysates was determined by bicinchoninic assay (Pierce Endogen). Each reaction condition was performed in duplicate. Samples were activated in 90 mM sodium acetate buffer at pH 5.5 containing 1.1 mM ethylenediaminetetraacetic acid and 340 μM dithiothreitol for 10 minutes at 37°C. Samples were then incubated with Z-Phe-Arg-aminomethylcoumarin as the substrate (Bachem, King of Prussia, PA) in the absence or presence of cathepsin L-selective inhibitor, Z-Phe-Phe diazomethyl-ketone (Bachem) for 1 hour. Reactions were stopped by addition of 1 mM iodoacetamide. Fluorescence of the product was measured by spectrofluorophotometer (Shimadzu, Columbia, MD) at an excitation wavelength of 370 nm and emission wavelength of 460 nm, using a background control that lack a cell sample. Assays were linear for both protein concentration and reaction time. The spectrofluorophotometer was calibrated with 7-aminomethylcoumarin, the purified product (Bachem). Cathepsin B activity was determined by product formation in the presence of substrate and cathepsin L inhibitor. Cathepsin L activity was determined by subtracting product formation after incubation with substrate and inhibitor from substrate alone. Activity is expressed as percent cathepsin activity in GaAs-exposed cells compared with specific activity in vehicle control cells as 100% ± SD of multiple experiments. Specific activity is nmol reaction product formed per mg protein/h.
Statistical Analyses
To compare parameter measurements among various exposure groups, values were analyzed by one-way ANOVA, using Dunnett's test to compare vehicle control values to GaAs-exposed values. Antigen dose-response curves were analyzed by 2-way factorial ANOVA, and Tukey's post-hoc test compared various exposures within an experiment at each antigen concentration. Thiol cathepsin activity, MHC Class II expression, and antigen presentation efficiency for GaAs-exposed macrophages were ranked relative to vehicle controls. Statistical relationship between 2 traits exhibited by GaAs-exposed macrophages with antigen presentation efficiency as the dependent variable was determined by Spearman rank correlation coefficient (rs). Significance was designated at p < 0.05.
RESULTS
Pulmonary and Splenic Impact of Intratracheal GaAs Exposure
We investigated the impact of intratracheal GaAs instillation on several parameters. Mice were intratracheally instilled with various GaAs doses or vehicle and assessed 5 days later, which is the same time point examined in our previous studies. Mice in all exposure groups lost an average of 1.2% body weight.
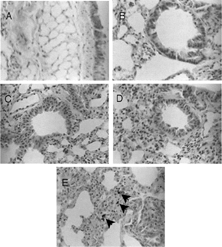
Vehicle instillation increased mean lung weight () compared with 146.3 mg for unexposed lungs. After exposure to 12.5 mg/kg GaAs, average lung weight was comparable to that for vehicle control, while higher GaAs doses caused significant increases above vehicle control (). Presence of GaAs crystals at all doses in the lungs was evident upon gross examination because of the chemical's black color. At 12.5 mg/kg GaAs, histological sections of lungs revealed moderate mononuclear cell infiltration in alveoli located near the terminal and respiratory bronchioles, while areas closer to the bronchus lacked cell infiltration ( and ). Vehicle control lungs also had moderate mononuclear cell infiltration located in the same areas (data not shown). No neutrophils or eosinophils were observed. In GaAs-exposed lungs, alveolar walls were thickened by interstitial cell infiltration indicative of alveolitis, but damage to bronchial epithelium was absent (). At 50 and 200 mg/kg GaAs, mononuclear cell infiltration was progressively more extensive, and several alveoli and alveolar sacs were completely obstructed at 200 mg/kg ( and ). Mild bronchial epithelial hyperplasia was observed. Few neutrophils and no eosinophils were present. At all GaAs doses, cell infiltration occurred in areas where GaAs crystals were located () and also in areas devoid of crystals. Infiltrating leukocytes did not have pyknotic nuclei. No desquamation or erosion of epithelial lining was observed. None of the sections showed signs of necrosis, fibrosis or hemorrhage. Edema was absent as indicated by the lack of granular precipitate in alveolar spaces. No GaAs crystals were detected in the spleens or peritoneal cavities of intratracheally chemical-exposed mice (data not shown).
TABLE 1 Analysis of alveolar cells after intratracheal instillation of GaAsFootnotea
FIG. 1 Histological changes in GaAs-exposed lungs. Lung sections were stained with hematoxylin and eosin 5 days after intratracheal instillation of GaAs at (A and B) 12.5 mg/kg, (C) 50 mg/kg, and (D and E) 200 mg/kg. GaAs crystals were present in the lungs (arrowheads). (×400).
Vehicle instillation nearly doubled the number of alveolar cells obtained by bronchoalveolar lavage () compared to unexposed lungs (0.58 × 10⁶ cells per lung), and GaAs slightly increased the cell number. For all exposure groups, alveolar cells were < 9% Thy-1+ T-cells and < 9% B220+ B-cells. Cells were predominantly macrophages by morphology (). Subsequent analyses focused on 12.5 and 50 mg/kg GaAs, because these doses caused less pulmonary changes than 200 mg/kg GaAs. Alveolar macrophages expressed little to no detectable Mac-1 molecule by immunofluorescence staining (data not shown). About one-third of the macrophages stained positively for Mac-3 molecule (). MHC I-Ek Class II expression was limited to Mac-3+ cells, and 12 and 50 mg/kg GaAs doubled the MHC I-Ek Class II staining intensity, indicating up-regulation.
Cellular composition of the spleen was also examined. The number of nucleated splenic cells was not affected by chemical exposure (). Splenocytes from vehicle control mice were 50.0 ± 6.1% B220+ B-cells and 24.4 ± 7.5% Thy-1+ T-cells, and GaAs exposure did not significantly alter the proportions of these lymphocytes. Furthermore, chemical exposure did not influence the percent Mac-1+ cells, nor affect MHC I-Ek Class II expression on splenic Mac-1+ cells (). These results regarding spleen cells are analogous to our findings after intraperitoneal exposure with 200 mg/kg GaAs (Lewis et al., Citation1996).
TABLE 2 Analysis of splenic macrophages after intratracheal instillation of GaAsFootnotea
GaAs Exposure Alters Efficiency of Antigen Presentation by Macrophages
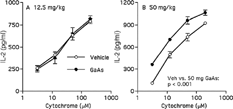
The ability of macrophages to function as antigen-presenting cells was compared after intratracheal and intraperitoneal exposure. Antigen presentation was assessed by in vitro stimulation of a cytochrome-specific, I-Ek-restricted CD4+ helper T-cell hybridoma to secrete IL-2 in response to intact antigen. Macrophages from spleen were enriched by antibody- and complement-mediated cytolysis. Splenic macrophages from mice exposed to 50 mg/kg GaAs intratracheally were defective in inducing a T-cell response (). Splenic cells were also impaired to a lesser extent in this function after exposure to 12.5 mg/kg GaAs (). These GaAs doses administered intraperitoneally did not affect the number of nucleated splenocytes (data not shown). After intraperitoneal exposure, 50, but not 12.5, mg/kg GaAs interfered with antigen-presenting cell function of splenic macrophages (). In contrast to splenic macrophages, alveolar cells were more potent in activating the T-cell hybridoma after intratracheal exposure to 50, but not to 12.5, mg/kg GaAs ().
FIG. 2 GaAs exposure impairs antigen presentation by splenic macrophages. Mice were exposed to vehicle (Veh) or indicated GaAs doses by (A) intratracheal (IT) instillation, or (B) intraperitoneal (IP) administration, and splenic macrophages were purified on day 5. T-cell hybridoma 2B4.11 was incubated with or without various antigen, cytochrome, concentrations and with macrophages as antigen-presenting cells. After 24 hours, IL-2 was measured in culture supernatants by ELISA. Medium controls were < 95 IL-2 pg/ml. Values are mean ± SD from triplicates. Each experiment is representative of three. For IT exposure, vehicle vs. 50 mg/kg GaAs and vehicle vs. 12.5 mg/kg GaAs p < 0.001 by factorial ANOVA. For IP exposure, vehicle vs. 50 mg/kg GaAs p < 0.001 by factorial ANOVA.
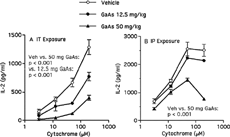
FIG. 3 Enhanced antigen presentation by alveolar cells depends on GaAs dose. Mice were exposed to vehicle (Veh) or indicated GaAs doses by intratracheal instillation. On day 5, alveolar cells were harvested and used as antigen–presenting cells for a cytochrome-specific T-cell response (see legend). IL-2 in medium controls were < 115 pg/ml. Values are mean ± SD from triplicates. Each experiment is representative of 3. Vehicle vs. 50 mg/kg GaAs p < 0.001 by factorial ANOVA.
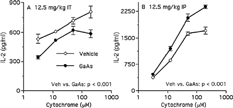
The impact of chemical exposure on resident peritoneal macrophages was also examined. Regardless of the exposure route or GaAs dose, the number of peritoneal cells did not significantly change compared with vehicle control (data not shown). Again, macrophages were enriched by antibody– and complement-mediated cytolysis. After 12.5 mg/kg GaAs intratracheal exposure, peritoneal macrophages showed a modest, yet significant, impairment in their capacity to stimulate cytochrome-specific T-cells (), whereas the same GaAs dose administered intraperitoneally enhanced this function of peritoneal macrophages (). Because intraperitoneal exposure of 200 mg/kg GaAs up-regulates MHC Class II expression on peritoneal macrophages (Lewis et al., Citation1998), peritoneal Mac-1+ cells were stained for MHC Class II molecules after intraperitoneal exposure to 12.5 mg/kg GaAs. This chemical dose did not affect MHC Class II expression. Mean fluorescence intensities were 88.08 ± 17.19 and 84.66 ± 16.97 for vehicle- and GaAs-exposed Mac-1+ cells, respectively. The consequence of GaAs on peritoneal macrophages to function as antigen-presenting cells depended on the exposure route.
FIG. 4 GaAs' impact on peritoneal macrophages depends on exposure route. Mice were exposed to vehicle (Veh) or 12.5 mg/kg GaAs by (A) intratracheal (IT) instillation or (B) intraperitoneal (IP) administration. On day 5, resident peritoneal macrophages were purified by antibody- and complement-mediated cytolysis, and T-cell response to cytochrome was measured (see legend). IL-2 in medium controls were < 110 pg/ml. Values are mean ± SD from triplicates. Each experiment is representative of three. For both routes, vehicle vs. GaAs p < 0.001 by factorial ANOVA.
GaAs Exposure Alters Protease Activities in Macrophages
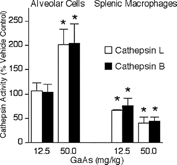
We investigated whether modulation of macrophage function was associated with altered proteolytic activities of thiol cathepsins, because these proteases participate in antigen processing. Intratracheal GaAs exposure did not alter total protein content in cell lysates prepared from alveolar cells () or splenic macrophages (). GaAs at 12.5 and 50 mg/kg significantly diminished both cathepsins L and B activities in splenic macrophages with a greater decrease after 50 mg/kg GaAs intratracheal exposure (). On the other hand, alveolar cells exposed to 50, but not to 12.5, mg/kg GaAs had significantly increased thiol cathepsin activities ().
FIG. 5 Intratracheal GaAs exposure modulates thiol cathepsin activities. Mice were exposed to vehicle or the indicated GaAs doses by intratracheal instillation. On day 5, cell lysates from alveolar cells and splenic macrophages were prepared, and thiol cathepsins L (open bars) and B (closed bars) activities were measured. Values are percent activity in lysates of GaAs-exposed groups with vehicle lysates at 100% activity and are mean ± SD of 4 separate samples. Specific activities of alveolar vehicle control cells were 192 and 47 nmol/mg/h for cathepsins L and B, respectively. Specific activities of splenic vehicle control cells were 48 and 16 nmol/mg/h for cathepsins L and B, respectively. *p < 0.05 compared to vehicle.
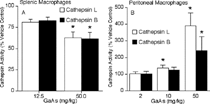
Similar to intratracheal exposure, GaAs administered intraperitoneally had no significant effect on total protein content within splenic and peritoneal macrophages (). After intraperitoneal exposure, cathepsins L and B activities in 12.5 mg/kg GaAs-exposed splenic macrophages were approximately 80% vehicle control levels (). At the higher chemical dose, proteolytic activities dropped to approximately 60% control levels. However, GaAs dose dependently augmented thiol cathepsin activities in resident peritoneal macrophages (). Enzymatic activities in macrophages exposed to 2 mg/kg GaAs were comparable to those in vehicle control cells. At 10 mg/kg GaAs, cathepsins L and B activities increased to 140% and 126%, respectively, and 50 mg/kg GaAs exposure further increased proteolytic activities in peritoneal macrophages.
TABLE 3 Protein content of macrophages after intraperitoneal GaAs exposureFootnotea
FIG. 6 Intraperitoneal GaAs modulates cathepsin activities. Mice were intraperitoneally administered vehicle or indicated GaAs doses. On day 5, thiol cathepsins L (open bars) and B (closed bars) activities were measured in cell lysates prepared from (A) splenic and (B) peritoneal macrophages. Values are percent activity in lysates of GaAs-exposed groups with vehicle lysates at 100% activity and are mean ± SD of 4 separate samples. Specific activities of splenic vehicle control cells were 46 and 21 nmol/mg/h for cathepsins L and B, respectively. Specific activities of peritoneal vehicle control cells were 173 and 43 nmol/mg/h for cathepsins L and B, respectively. *p < 0.05 compared to vehicle.
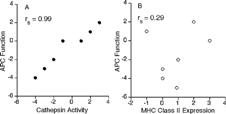
A possible relationship between cathepsin activity and antigen presenting function of GaAs-exposed macrophages relative to vehicle control cells was tested by Spearman rank correlation and included both exposure routes. The rankings of cathepsin B and L activities in GaAs-exposed cells relative to vehicle controls were the same. Altered efficiency of antigen presentation by various macrophage populations exposed to GaAs correlated with changes in thiol cathepsin activity (). Based on a similar analysis, there was no significant relationship between MHC Class II expression and antigen presenting function of GaAs-exposed macrophages ().
FIG. 7 Correlation between cathepsin activity and antigen-presenting cell (APC) function of GaAs-exposed macrophages. Data in to , and , and text for GaAs-exposed cells were ranked relative to vehicle controls and analyzed by Spearman rank correlation. (A) Thiol cathepsin activity vs. efficiency of antigen presentation. rs = 0.99 and 2-tailed p = 0.0004. (B) MHC Class II expression vs. efficiency of antigen presentation. rs = 0.29.
DISCUSSION and CONCLUSIONS
The impact of in vivo gallium arsenide exposure on antigen presentation by macrophages was compared for intratracheal and intraperitoneal routes. Our study is the first one to examine the functional capability of alveolar macrophages after intratracheal GaAs instillation. In general, the chemical's influence on macrophages after intratracheal instillation paralleled that after intraperitoneal exposure and was dose-dependent, although the lowest observable adverse effect levels differed. Macrophages from the exposure sites exhibited an enhanced ability to activate an antigen-specific CD4+ helper T-cell hybridoma compared with vehicle control macrophages. In contrast, macrophages from locations distal to the exposure sites, in particular the spleen, were impaired in this function relative to vehicle control cells. These contrasting findings cannot be easily explained by only macrophage heterogeneity. For example, peritoneal macrophages after GaAs intraperitoneal administration were more efficient antigen-presenting cells, while peritoneal cells after intratracheal instillation were defective presenting cells and were now distant from the exposure site. Both intratracheal and intraperitoneal GaAs exposure enhanced thiol cathepsin activities in macrophages at the exposure site, but suppressed proteolytic activities in macrophages at a distant location. Regardless of the GaAs dose and exposure route, the total protein content of macrophages was not affected compared to vehicle controls. Hence, changes in protein content cannot account for alterations in enzymatic activities. Although alveolar macrophages expressed an increased level of cell surface MHC Class II molecules based on immunofluorescence staining, MHC Class II expression on splenic macrophages was unaffected compared with vehicle control macrophages. Modulation of thiol cathepsin activities statistically correlated with altered efficiency of antigen presentation for both exposure routes, whereas surface MHC Class II expression did not. We postulate that thiol cathepsins are potential target molecules by which antigen presentation is modulated by GaAs exposure.
The lowest GaAs dose that enhanced antigen presentation differed for the exposure routes. Intratracheal instillation of 50 mg/kg GaAs resulted in alveolar macrophages as more potent presenting cells with higher thiol cathepsin activities and MHC Class II expression compared with vehicle control cells. At 12.5 mg/kg GaAs, antigen presentation and thiol cathepsin activities of alveolar macrophages were not significantly different from vehicle controls, although MHC Class II expression was increased. Increased MHC Class II expression alone appears to be insufficient to augment antigen-presenting cell function. By contrast, 12.5 mg/kg GaAs after intraperitoneal exposure augmented this function, while MHC Class II expression remained at vehicle control level, and 10 mg/kg GaAs increased thiol cathepsin activities of peritoneal macrophages. Enhanced antigen presentation apparently relies more on increased proteolytic activity than MHC Class II expression. Alveolar cells were less sensitive to the chemical's augmenting effect than peritoneal cells. Alveolar and peritoneal macrophages display distinctive characteristics, and their cell surface phenotype and functional capacity are dependent, in part, on the microenvironment (Laskin et al., Citation2001; Hume et al., Citation2002). The differential sensitivity to GaAs may be related differences in microenvironments at the exposure sites and macrophage heterogeneity. Despite differential sensitivity to GaAs, enhanced presenting cell function by alveolar and peritoneal macrophages appeared to depend on the chemical's ability to increase thiol cathepsin activities.
The chemical's opposing effects may be due to the molecular form to which cells are exposed. GaAs crystals persist at the exposure site for 3 months after a single administration (Carter et al., Citation2003). Within 18 hours after intraperitoneal GaAs exposure, transcripts of 17 proinflammatory cytokines are up-regulated, mRNA expression of 3 inhibitory cytokines decrease to below detection, and monocytes are the predominant cell type within the peritoneum (Becker and McCoy, Citation2003). By 5 days after 200 mg/kg GaAs exposure, peritoneal macrophages display an activated phenotype in terms of increased expression of several cell surface molecules, enhanced antigen-presenting cell function and increased thiol cathepsin activities (Hartmann and McCoy, Citation1996; Caffrey-Nolan and McCoy, Citation1998; Lewis et al., Citation1998). These effects cannot be merely attributed to the particulate nature of GaAs crystals, because polystyrene beads with a similar diameter do not mimic GaAs (Caffrey-Nolan and McCoy, Citation1998; Lewis et al., Citation1998; Becker and McCoy, Citation2003). Similarly, intratracheal GaAs instillation caused pulmonary inflammation. The main histological changes were mononuclear cell infiltration with few neutrophils near the bronchioles, thickening of alveolar walls, and very mild epithelial hyperplasia. Mononuclear cells infiltrated the alveolar lumen and interstitium; the latter contributed to thickening of alveolar walls. These histopathological events are similar to those occurring in mice after subchronic inhalation (NTP, Citation2000) and in rats and hamsters after acute GaAs intratracheal instillation (Webb et al., Citation1986; Tanaka, Citation2004). GaAs-induced inflammation at the exposure site may lead to cytokine production that, in turn, may activate monocytes and macrophages, which may contribute to pulmonary pathology.
At present, there are no reports in the literature that immune responses eventually return to normal in GaAs-exposed animals, suggesting that systemic immune suppression is not readily reversed. GaAs slowly dissolves causing sustained release of its aqueous soluble components that are absorbed, and enter the circulatory system and various organs (Yamauchi et al., Citation1986; Webb et al., Citation1987; Burns et al., Citation1991; Flora et al., Citation1998). We did not detect intact GaAs crystals within the spleen, and, thus, the possibility that macrophages at the exposure site ingest GaAs crystals and subsequently migrate to the spleen seems remote. The current viewpoint is that the absorbed components, in particular arsenic, mediate systemic toxicity. In support of this notion, in vivo administration of arsenic chelators prevent or partially reverse GaAs-induced suppression of humoral response to sheep red blood cells and delayed type hypersensitivity to bovine serum albumin (Burns et al., Citation1991; Flora and Kumar, Citation1996). A depressed antibody response to sheep erythrocytes cannot be attributed to suppressor macrophages, prostaglandins release, or increased serum corticosterone (Sikorski et al., Citation1991b; Burns et al., Citation1994). During a 2-day time course study, steady state mRNA levels for 25 cytokines remain at vehicle control levels with the spleen (Becker and McCoy, Citation2003), arguing against changes in constitutive cytokine expression as the primary cause of impaired immune competency. Arsenic, especially arsenite, inhibits numerous sulfhydryl enzymes (Hughes, Citation2002; Cohen, Citation2004), which includes thiol cathepsins (Turk et al., Citation2001). Arsenic behaving as a thiol cathepsin inhibitor is an unlikely mechanism, because the Ki of arsenite for cathepsin L is 120 μM (Harrison and McCoy, Citation2001). Arsenic at this level in vivo would be lethal (ATSDR, Citation2000). Although arsenic causes oxidative stress that can induce apoptosis (Hughes, Citation2002; Carter et al., Citation2003), GaAs exposure did not alter the cellularity or composition of the spleen, and we have found no evidence of apoptotic splenocytes. Additional experiments are needed to elucidate the mechanism causing systemic immune suppression.
Productive antigen processing by antigen-presenting cells is essential for eliciting CD4+ helper T-cell activation. GaAs exposure appears to influence an early event required for initiation of an antigen response. Altered antigen presentation caused by GaAs exposure changed T-cell stimulation, which, in turn, could affect humoral and cell-mediated immunity. Defective antigen processing in other systems leads to systemic immune suppression (Nakagawa et al., Citation1998; Katunuma et al., Citation2004). Mice genetically deficient in cathepsin L have abnormal epidermal homeostasis and altered hair cycle (Reinheckel et al., Citation2001) in addition to defective antigen presentation, especially during T-cell maturation in the thymus (Nakagawa et al., Citation1998). Studies with mice devoid of cathepsin B reveal its important role in the initiation of pancreatitis and tumor necrosis factor-α -induced apoptosis of hepatocytes (Reinheckel et al., Citation2001). GaAs induced inflammation at the exposure site, and macrophages exhibited characteristics indicative of activation, which may contribute to pulmonary pathology. Augmented expression of thiol cathepsins is associated with multiple human diseases, including rheumatoid arthritis, pancreatitis, emphysema, asthma, and metastatic efficacy of several tumor types (Wolters and Chapman, Citation2000; Berdowska, Citation2004). Although the impact of GaAs exposure on industrial worker's health remains unclear, our animal studies along with those of other investigators indicate that the chemical has the potential of having similar consequences on industrial workers.
ACKNOWLEDGMENTS
This work was supported by a grant from the National Institutes of Health (ES07199). M.T.H. was supported by training grant T32 ES07087. The authors would like to thank Dr. Kimber L. White Jr. of Virginia Commonwealth University (Richmond, VA) for helpful discussions, technical advice, and use of the flow cytometry facility.
REFERENCES
- ATSDR. Toxicological Profile for Arsenic. U.S. Department of Public Health and Human Services, Atlanta, GA 2000
- Becker S. M., McCoy K. L. Gallium arsenide selectively up-regulates inflammatory cytokine expression at exposure site. J. Pharmacol. Exp. Ther. 2003; 307: 1045–1053, [PUBMED], [INFOTRIEVE], [CSA]
- Berdowska I. Cysteine proteases as disease markers. Clin. Chim. Acta 2004; 342: 41–69, [PUBMED], [INFOTRIEVE], [CSA], [CROSSREF]
- Burns L. A., Sikorski E. E., Saady J. J., Munson A. E. Evidence for arsenic as the immunosuppressive component of gallium arsenide. Toxicol. Appl. Pharmacol. 1991; 110: 157–169, [PUBMED], [INFOTRIEVE], [CSA], [CROSSREF]
- Burns L. A., Spriggs T. L., Fuchs B. A., Munson A. E. Gallium arsenide-induced increase in serum corticosterone is not responsible for suppression of the IgM antibody response. J. Pharmacol. Exp. Ther. 1994; 268: 740–746, [PUBMED], [INFOTRIEVE], [CSA]
- Caffrey-Nolan R. E., McCoy K. L. Direct exposure to gallium arsenide upregulates costimulatory activity of murine macrophages. Toxicol. Appl. Pharmacol. 1998; 151: 330–339, [PUBMED], [INFOTRIEVE], [CSA], [CROSSREF]
- Carter D. E., Aposhian H. V., Gandolfi A. J. The metabolism of inorganic arsenic oxides, gallium arsenide, and arsine: A toxicological review. Toxicol. Appl. Pharmacol. 2003; 193: 309–334, [PUBMED], [INFOTRIEVE], [CSA], [CROSSREF]
- Cohen M. D. Pulmonary immunotoxicology of select metals: Aluminium, arsenic, cadium, chromium, copper, manganese, nickel, vanadium, and zinc. J. Immunotoxicol. 2004; 1: 39–69, [CROSSREF]
- de Peyster A., Silvers J. A. Arsenic levels in hair of workers in a semiconductor fabrication facility. Am. Ind. Hyg. Assoc. J. 1995; 56: 377–383, [PUBMED], [INFOTRIEVE], [CSA]
- Edelman P. Environmental and workplace contamination in the semiconductor industry: Implications for future health of the workplace and community. Environ. Health Perspect. 1990; 86: 291–295, [PUBMED], [INFOTRIEVE]
- Elliot E. A., Drake J. R., Amigorena S., Elsemore J., Webster P., Mellman I., Flavell R. A. The invariant chain is required for intracellular transport and function of major histocompatibility complex class II molecules. J. Exp. Med. 1994; 179: 681–694, [CROSSREF]
- Flora S. J. S., Kumar P. Biochemical and immunotoxicological alterations following repeated gallium arsenide exposure and their recoveries by meso-2,3-dimercaptosuccinic acid and 2,3-dimercaptopropane 1-sulfonate administration in rats. Environ. Toxicol. Pharmacol. 1996; 2: 315–320, [CSA], [CROSSREF]
- Flora S. J. S., Kumar P., Kannan G. M., Rai G. P. Acute oral gallium arsenide exposure and changes in certain hematological, hepatic, renal and immunological indices at different time intervals in male Wistar rats. Toxicol. Lett. 1998; 94: 103–113, [PUBMED], [INFOTRIEVE], [CSA], [CROSSREF]
- Gochfeld M. Microelectronics, radiation and superconductivity. Environ. Health Perspect. 1990; 86: 285–289, [PUBMED], [INFOTRIEVE]
- Gondre-Lewis T. A., Hartmann C. B., Caffrey R. E., McCoy K. L. Gallium arsenide exposure impairs splenic B cell accessory function. Int. Immunopharmacol. 2003; 3: 403–415, [PUBMED], [INFOTRIEVE], [CROSSREF]
- Harrison M. T., McCoy K. L. Immunosuppression by arsenic: A comparison of cathepsin L inhibition and apoptosis. Int. Immunopharmacol. 2001; 1: 647–656, [PUBMED], [INFOTRIEVE], [CROSSREF]
- Harrison M. T., Hartmann C. B., McCoy K. L. Impact of in vitro gallium arsenide exposure on macrophages. Toxicol. Appl. Pharmacol. 2003; 186: 18–27, [PUBMED], [INFOTRIEVE], [CSA], [CROSSREF]
- Hartmann C. B., McCoy K. L. Gallium arsenide augments antigen processing by peritoneal macrophages for CD4+ helper T cell stimulation. Toxicol. Appl. Pharmacol. 1996; 141: 365–372, [PUBMED], [INFOTRIEVE], [CSA], [CROSSREF]
- Honey K., Rudensky A. Y. Lysosomal cysteine proteases regulate antigen presentation. Nat. Rev. Immunol. 2003; 3: 472–482, [PUBMED], [INFOTRIEVE], [CSA], [CROSSREF]
- Hsieh C., deRoos S. P., Honey K., Beers C., Rudensky A. Y. A role for cathepsin L and cathepsin S in peptide generation for MHC class II presentation. J. Immunol. 2002; 168: 2618–2625, [PUBMED], [INFOTRIEVE]
- Hughes M. F. Arsenic toxicity and potential mechanisms of action. Toxicol. Lett. 2002; 133: 1–6, [PUBMED], [INFOTRIEVE], [CSA], [CROSSREF]
- Hume D. A., Ross I. L., Himes S. R., Samono R. T., Well C. A., Ravasi T. The mononuclear phagocyte system revisited. J. Leukocyte Biol. 2002; 72: 621–627, [PUBMED], [INFOTRIEVE], [CSA]
- Jenkins P. P., MacInnes A. N., Tabib-Azar M., Barron A. R. Gallium arsenide transistors: Realization through a molecularly designed insulator. Science 1994; 263: 1751–1753
- Katunuma N., Matsunaga Y., Himeno K., Hayashi Y. Insights into the roles of cathepsins in antigen processing and presentation revealed by specific inhibitors. Biol. Chem. 2004; 384: 883–890, [CSA], [CROSSREF]
- Laskin D. L., Weinberger B., Laskin J. D. Functional heterogeneity in liver and lung macrophages. J. Leukocyte Biol. 2001; 70: 163–170, [PUBMED], [INFOTRIEVE], [CSA]
- Lewis T. A., Hartmann C. B., McCoy K. L. Gallium arsenide modulates proteolytic cathepsin activities and antigen processing by macrophages. J. Immunol. 1998; 161: 2151–2157, [PUBMED], [INFOTRIEVE]
- Lewis T. A., Munson A. E., McCoy K. L. Gallium arsenide selectively suppresses antigen processing by splenic macrophages for CD4+ T cell activation. J. Pharmacol. Exp. Ther. 1996; 278: 1244–1251, [PUBMED], [INFOTRIEVE], [CSA]
- McCoy K. L., Chi E., Engel D., Clagett J. Accelerated rate of mononuclear phagocyte production in vitro by splenocytes from autoimmune motheaten mice. Am. J. Pathol. 1983; 112: 18–26, [PUBMED], [INFOTRIEVE]
- McCoy K. L., Page M. S., Merkel B. J., Inman J. K., Stutzman R. Differences among various lineages of antigen-presenting cells in processing exogenous antigen internalized through transferrin receptors. J. Immunol. 1993; 151: 6757–6768, [PUBMED], [INFOTRIEVE]
- Nakagawa T., Roth W., Wong P., Nelson A., Farr A., Deussing J., Villadangos J. A., Ploegh H., Peters C., Rudensky A. Y. Cathepsin L: Critical role in Ii degradation and CD4 T cell selection in the thymus. Science 1998; 280: 450–453, [PUBMED], [INFOTRIEVE], [CROSSREF]
- Newcomb J. R., Cresswell P. Structural analysis of proteolytic products of MHC class II-invariant chain complexes generated in vivo. J. Immunol. 1993; 151: 4153–4163, [PUBMED], [INFOTRIEVE]
- Nordwall B. D. Gallium arsenide chips find commercial use. Aviation Week Space Tech. 1994; 140: 54–55
- NTP. Toxicology and Carcinogenesis Studies of Gallium Arsenide (CAS No 1303-00-0) in F344/N Rats and B6C3F1 Mice (Inhalation Studies). Department of Health and Human Services, Public Health Service, Bethesda, MD 2000, Technical Report Series 492
- Reinheckel T., Deussing J., Roth W., Peters C. Towards specific functions of lysosomal cysteine peptidases: Phenotype of mice deficient for cathepsin B or cathepsin L. Biol. Chem. 2001; 382: 735–741, [PUBMED], [INFOTRIEVE], [CSA], [CROSSREF]
- Riese R. J., Chapman H. A. Cathepsins and compartmentalization in antigen presentation. Curr. Opin. Immunol. 2000; 12: 107–113, [PUBMED], [INFOTRIEVE], [CSA], [CROSSREF]
- Sheehy J. W., Jones J. H. Assessment of arsenic exposures and controls in gallium arsenide production. Am. Ind. Hyg. Assoc. J. 1993; 54: 61–69, [PUBMED], [INFOTRIEVE], [CSA]
- Sikorski E. E., Burns L. A., McCoy K. L., Stern M., Munson A. E. Suppression of splenic accessory cell function in mice exposed to gallium arsenide. Toxicol. Appl. Pharmacol. 1991a; 110: 143–156, [PUBMED], [INFOTRIEVE], [CSA], [CROSSREF]
- Sikorski E. E., Burns L. A., Stern M. L., Luster M. I., Munson A. E. Splenic cell targets in gallium arsenide-induced suppression of the primary antibody response. Toxicol. Appl. Pharmacol. 1991b; 110: 129–142, [PUBMED], [INFOTRIEVE], [CSA], [CROSSREF]
- Staedter T. Triple-junction solar cells: Three semiconductor layers optimize solar power efficiency. Tech. Rev. 2002; 105: 88–89
- Tanaka A. Toxicity of indium arsenide, gallium arsenide, and aluminium gallium arsenide. Toxicol. Appl. Pharmacol. 2004; 198: 405–411, [PUBMED], [INFOTRIEVE], [CSA], [CROSSREF]
- Turk V., Turk B., Turk D. Lysosomal cysteine proteases: Facts and opportunities. EMBO J. 2001; 20: 4629–4633, [PUBMED], [INFOTRIEVE], [CSA], [CROSSREF]
- van der Drift A. C. M., van Noort J. M., Kruse J. Catheptic processing of protein antigens: Enzymic and molecular aspects. Seminars Immunol. 1990; 2: 255–272
- Watts C. Antigen processing in the endocytic compartment. Curr. Opin. Immunol. 2001; 13: 26–31, [PUBMED], [INFOTRIEVE], [CSA], [CROSSREF]
- Webb D. R., Wilson S. E., Carter D. E. Comparative pulmonary toxicity of gallium arsenide, gallium (III) oxide, or arsenic (III) oxide intratracheally instilled into rats. Toxicol. Appl. Pharmacol. 1986; 82: 405–416, [PUBMED], [INFOTRIEVE], [CSA], [CROSSREF]
- Webb D. R., Wilson S. E., Carter D. E. Pulmonary clearance and toxicity of respirable gallium arsenide particulates intratracheally instilled into rats. Am. Ind. Hyg. Assoc. J. 1987; 48: 660–667, [PUBMED], [INFOTRIEVE], [CSA]
- WHO. Inorganic Arsenic Compounds Other Than Arsine. World Health Organization Health Safety Guide No. 70, Geneva 1992
- Wolters P. J., Chapman H. A. Importance of lysosomal cysteine proteases in lung disease. Respir. Res. 2000; 1: 170–177, [PUBMED], [INFOTRIEVE], [CSA], [CROSSREF]
- Yamauchi H., Takahashi K., Yamamura Y. Metabolism and excretion of orally and intraperitoneally administered gallium arsenide in the hamster. Toxicology 1986; 40: 237–246, [PUBMED], [INFOTRIEVE], [CSA], [CROSSREF]
- Yamauchi H., Takahashi K., Mashiko M., Yamamura Y. Biological monitoring of arsenic exposure of gallium arsenide- and inorganic arsenic-exposed workers by determination of inorganic arsenic and its metabolites in urine and hair. Am. Ind. Hyg. Assoc. J. 1989; 50: 606–612, [PUBMED], [INFOTRIEVE], [CSA]