Abstract
Tienilic acid (TA) was withdrawn due to idiosyncratic hepatotoxicity. Two hypotheses for the mechanisms of idiosyncratic reactions are the hapten and danger hypotheses, which are not mutually exclusive. Both human CYP 2C9 and rat CYP 2C11 metabolize TA to a reactive metabolite that was reported to bind exclusively to these enzymes. TA-Induced liver toxicity is associated with antibodies against CYP 2C9, thus TA appears to act as a hapten. However, if the binding were limited to CYP 2C, it is unlikely that this would lead to significant cell stress. If TA does not cause cell stress it would suggest that acting as a hapten is sufficient to induce an idiosyncratic reaction. To test whether TA can cause cell stress rats were dosed with TA and hepatic gene expression was profiled at 6 and 24 hr after drug administration. TA induced changes in genes involved in oxidative stress (aldo-keto reductase, glutathione-S-transferase, thioredoxin reductase, epoxide hydrolase), inflammation (IL-1β, interferon regulatory factor 1, macrophage stimulating protein 1), cytotoxicity (caspase-12), and liver regeneration (p27Kip1, DUSP6, serine dehyratase, spectrin β II, inhibin βA). These data support the hypothesis that danger signals in the form of cell-stress may be involved in initiating the immune response observed in TA-induced toxicity. In separate experiments, we examined the changes in gene expression induced in mice by sulfamethoxazole, which also causes idiosyncratic reactions. Sulfamethoxazole is an aromatic amine, and aromatic amines in general are associated with idiosyncratic drug reactions. They form reactive metabolites that both act as electrophiles and can redox cycle; therefore, it was assumed that sulfamethoxazole would cause some type of cell stress, the only question was what changes in mRNA expression would occur. In contrast to expectations, no changes induced by sulfamethoxazole could easily be interpreted as a danger signal. These data are presented together because they are the opposite of the expected results and convey a complex story.
| Abbreviations | ||
| 5-OH-TA, | = | 5-hydroxy-tienilic acid |
| anti-LKM2, | = | anti-liver kidney microsome autoantibodies |
| ARE, | = | antioxidant response element |
| CYP 2C9, | = | cytochrome P450 2C9 |
| CYP 2C11, | = | cytochrome P450 2C11 |
| ER, | = | endoplasmic reticulum |
| HSP, | = | heat shock proteins |
| IDRs, | = | idiosyncratic drug reactions |
| qRT-PCR, | = | quantitative reverse transcriptase polymerase chain reaction |
| SMX, | = | sulfamethoxazole |
| TA, | = | tienilic acid |
INTRODUCTION
Idiosyncratic drug reactions (IDRs) are a significant cause of patient morbidity and mortality, accounting for approximately 6 to 10% of all adverse drug reactions (Ju and Uetrecht, Citation2002). IDRs are rare, not predictable from the basic pharmacology of the drug, and do not have a simple dose-response relationship (Uetrecht, Citation2003). Furthermore, several clinical features of IDRs suggest that they are immune-mediated (Ju and Uetrecht, Citation2002), often manifesting as an autoimmune syndrome and frequently referred to as hypersensitivity reactions (Zimmerman et al., Citation1999; Park et al., Citation2000). These reactions are especially problematic to the pharmaceutical industry due to their unpredictable nature (Roujeau and Stern, Citation1994); IDRs are rarely detected during the extensive animal and clinical drug safety testing prior to market release (Uetrecht, Citation2000).
Two major working hypotheses for the mechanism by which drugs might initiate IDRs are the hapten and danger hypotheses. There is a large quantity of circumstantial evidence that suggests that reactive metabolites of drugs are responsible for initiating IDRs. The hapten hypothesis, first proposed in 1935 (Landsteiner and Jacobs, Citation1935), suggests that drugs are too small (< 1000 Daltons) to be immunogenic; therefore, drugs, or more likely their reactive metabolites, covalently bind to cellular macromolecules such as proteins to form a drug-macromolecule or a “hapten-carrier” complex and are rendered immunogenic. Although penicillin-induced anaphylaxis is the prototypical example to support the hapten hypothesis (Uetrecht, Citation2005), it has been difficult to prove for the myriad of drugs causing IDRs that covalent binding to protein to form a hapten-carrier complex is responsible for the initiation of the adverse drug reaction.
The danger hypothesis, a concept borrowed from immunology, has been applied in the context of drug metabolism in an attempt to explain the initiation of IDRs. Proposed by Polly Matzinger in 1994 (Matzinger, Citation1994), the danger hypothesis states that the immune system does not recognize that which is “foreign”; rather, the immune system is alerted when some endogenous warning sign, such as the generation of oxidative stress, induction of heat shock proteins (HSPs), or perhaps existence of extracellular DNA or mitochondria signals to the immune system the presence of “danger.”
These two hypotheses are not mutually exclusive and in the initiation of drug hypersensitivity reactions, signal 1 (the generation and recognition of immunogen) and signal 2 (costimulation signals) may occur via a drug or its metabolite acting both as a hapten and a danger signal. It is postulated that “signal 1” in the absence of “signal 2” leads to tolerance (Seguin and Uetrecht, Citation2003). What differentiates a drug that forms a reactive metabolite and causes IDRs from one that forms a reactive metabolite but does not cause a significant incidence of IDRs might be whether the reactive metabolite can cause a danger signal. This is an attractive hypothesis but there is no good evidence to support it. Even if the danger hypothesis is correct, the danger signal could arise from an unrelated stimulus such as a concomitant infection.
One possible test of the hypothesis that generation of a danger signal by a reactive metabolite is required in order for a drug to cause a significant incidence of IDRs is tienilic acid-induced liver toxicity. Tienilic acid (TA, ), a uricosuric diuretic, was used in France for several years, but 8 months after it was released in 1979 in the United States, it was withdrawn because of a relatively high incidence of hepatocellular jaundice. Twenty-five fatalities (Robin et al., Citation1996), and more than 300 non-fatal cases of hepatocellular necrosis were associated with the use of this drug (Zimmerman, Citation1999). TA acts as a mechanism-based inhibitor of CYP 2C9, which is the enzyme that metabolizes TA.
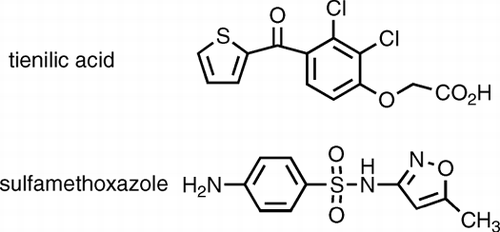
FIG. 1 Tienilic acid and sulfamethoxazole structures.
Both human cytochrome (CYP) P450 2C9 and the rat ortholog CYP 2C11 metabolize TA, and it was reported that the reactive metabolite of TA binds almost exclusively to these enzymes, thus acting as a mechanism-based inhibitor (Lopez-Garcia et al., Citation1994). The major stable metabolite formed from TA oxidation by CYP 2C9 is 5-hydroxy (5-OH)-TA. Although an S-oxide was initially proposed, there is stronger evidence that the reactive thiophene epoxide is the major route of 5-OH-TA formation or TA binding in the P450 active site (Koenigs et al., Citation1999). Detected in the sera of patients with TA hepatitis are anti-liver kidney microsome autoantibodies (anti-LKM2), which bind to liver and kidney sections of untreated rats (Robin et al., Citation1996). Anti-LKM2 also recognizes human P450 2C9, TA-alkylated CYP 2C9, as well as rat P450 2C11, which has 85% sequence identity with human CYP 2C9. These antibodies correlate with hepatitis in humans, strongly suggesting that it is an immune-mediated reaction; however, there is no evidence that they are pathogenic and the toxicity may be mediated by T-cells.
Based upon the non-essential nature of CYP 2C9 to the life of a cell, mechanism-based inhibition of this protein by TA would not be expected to generate a danger signal. If it were found that TA does not induce cell stress suggestive of a danger signal it would provide evidence that either the danger hypothesis is wrong, or that some source of a danger signal other than a reactive metabolite is sufficient to initiate an IDR. In order to test this hypothesis, liver microarray analysis of male Sprague–Dawley rats was undertaken to identify acute TA-induced changes in gene expression, if any, that might represent a danger signal. Rats were dosed with TA and total liver RNA was extracted at 6 and 24 hr post-drug administration. Genes that were differentially regulated by microarray were identified at both time points, and quantitative reverse transcriptase polymerase chain reaction (qRT-PCR) was used to verify these changes. A subsequent study was performed, using only qRT-PCR to substantiate gene changes from the previous microarray study.
In separate experiments we tested the effects of sulfamethoxazole (SMX, ) on gene expression. SMX is associated with a relatively high incidence of a variety of idiosyncratic drug reactions. It is an aromatic amine that is known to form reactive hydroxylamine and nitroso metabolites (Cribb et al., Citation1996). Aromatic amines, in general, are associated with a relatively high incidence of idiosyncratic drug reactions presumably because of the reactive hydroxylamine and nitroso metabolites that can bind to a variety of proteins and can also redox cycle. Therefore, it was assumed that sulfamethoxazole would cause cell stress; the only question was how this would be reflected in changes in gene expression.
Although most IDRs appear to be caused by reactive metabolites and many pharmaceutical companies screen drug candidates for reactive metabolites, not all drugs that form reactive metabolites are associated with a significant incidence of IDRs. If the danger hypothesis is correct and a reactive metabolite has to generate a danger signal in order to cause an IDR, even if different drugs generate different danger signals, it could lead to discovery of biomarkers that, along with reactive metabolite screens, could lead to more accurate prediction of the IDR potential of a drug candidate.
MATERIALS AND METHODS
Animals
Male Sprague–Dawley rats weighing 210–230 g and female Balb/C mice weighing 15–20 g were purchased from Charles River (Montreal, Quebec, Canada) and housed in plastic cages with wooden chip bedding in a 12:12 hr light:dark cycle at 22°C. Animals were given unrestricted access to standard rat chow (Agribrands, Purina Canada, Strathroy, Ontario, Canada) and tap water, and allowed to acclimatize for 1 week prior to the start of experimentation.
Chemicals, Kits, and Solutions
Sodium bicarbonate and SMX were purchased from Sigma Aldrich (Oakville, Canada). RNeasy Mini kits were purchased from Qiagen (Mississauga, Ontario, Canada) for purification of total RNA. RAE 230 2.0 gene chips were purchased from Affymetrix (Santa Clara, CA). TA was a generous gift from Sid Nelson (University of Washington) and Merck Frosst (Kirkland, Quebec, Canada).
Experimental Design
Rats were orally dosed with TA (100 mg/kg) by gavage in a total volume of 1 ml dissolved in an equal molar amount of sodium bicarbonate. Control animals were orally dosed with 1 ml of sodium bicarbonate. Eight rats were divided into two groups: Group 1 consisted of two animals (T1 and T2) that received a single dose of TA, and the two control animals received only sodium bicarbonate. Group 1 was sacrificed 6 hr after drug/vehicle administration. Group 2 also consisted of two animals, and they were given two doses of TA (given at t = 0 and t = 16 hr) and sacrificed at 24 hr. Control rats in Group 2 received two oral doses of sodium bicarbonate.
Mice were orally dosed with SMX (250 mg/kg) by gavage in a total volume of 0.2 ml dissolved in an equal molar amount of sodium bicarbonate. Control animals were orally dosed with 0.2 ml of sodium bicarbonate. Fifteen mice were divided into two groups: Group 1 consisted of three mice that received a single dose of SMX, and the four control mice that received only sodium bicarbonate. Group 1 was sacrificed 6 hr after drug/vehicle administration. Group 2 comprised of four control mice that received 2 oral doses of sodium bicarbonate and four mice that were given two doses of SMX (at t = 0 and t = 16 hr) and sacrificed at 24 hr.
Both rats and mice were sacrificed by CO2 asphyxiation, and liver RNA was stabilized by immediate tissue submersion in RNAlater RNA Stabilization Reagent (Qiagen).
RNA Preparation and Microarray Analysis
Immediately following RNA stabilization in RNAlater, livers were kept at –20°C or at -80°C for long-term storage. Small samples (10–30 mg) of liver were homogenized using a rotor-stator homogenizer (IKA Ultra-Turrax T25 S1, Janke & Kunkel, Staufen, Germany), and total RNA was extracted as per the manufacturer's instructions. RNA concentrations and purity were determined via UV spectrophotometry, and the quality of RNA was further assessed by capillary electrophoresis using the Agilent Bioanalyzer. For microarray analysis of the TA experiment, 6 Affymetrix chips were used: Group 1 samples (3 chips) were comprised of pooled RNA from control rats C1 and C2, and an individual chip for each treated animal T1 and T2; Group 2 (3 chips) pooled RNA from control rats C3 and C4, and an individual chip for each treated animal T3 and T4. RNA from treated rats was not pooled. The microarray facility at the University of Toronto at The Centre for Applied Genomics, Hospital for Sick Children (Toronto, ON) processed the gene chips as per the manufacturer's instructions using the rat RAE 230 2.0 chips (Affymetrix).
For microarray analysis of mRNA from the SMX experiment, samples were run at the EDGE laboratory of Dr. Bradfield at the University of Wisconsin. Group 1 samples (4 chips) were comprised of pooled RNA from control mice C1-C4, and an individual chip for each treated animal T1-T3; Group 2 (5 chips) pooled RNA from control mice C5-C8, and an individual chip for each treated animal T4-T7. RNA from treated mice was not pooled. Only 2 of the 4 samples from animals T4-T7 were analyzed because the person who was analyzing the chips left before the analysis was completed.
Microarray Data Analysis
For TA analysis, array data were loaded into R (v2.0.1) using the Affy package (v1.5.8) (Gautier et al., Citation2004) of the BioConductor open-source project (Gentleman et al., Citation2004). Data were investigated for spatial and distributional homogeneity, then pre-processed with a sequence-specific version of the RMA algorithm (Irizarry et al., Citation2003) termed GCRMA, as implemented in BioConductor (v1.1.3). The data were then written to disk and parsed with Perl scripts into a custom-built Oracle database that employs the MAGE-OM-compliant RAD schema (Stoeckert et al., Citation2001). The normalized data were then associated with updated sequence annotation using a novel polling algorithm. The target sequence for each ProbeSet was BLASTed against the organism-specific dbEST and NT nucleotide databases using stringent parameterization (word-size 7, expectation 1e-5, MegaBLAST off, filtering on, default gap penalty and substitution matrix).
The set of EST hits was then mapped to UniGene clusters, and unmapped ESTs were discarded at this stage. Next, the set of EST hits was polled at five stringencies (2/2, 3/4, 4/6, 5/8, 6/10) to identify the best matching UniGene cluster for each ProbeSet. Differential expression was identified by calculating the average fold-change between treated samples and their time-matched control. ProbeSets were deemed differentially expressed if they exhibited a 2-fold change in expression. All calculations were done in log2-space: for example, a change of +2.0 log2-units corresponds to 4-fold up-regulation induced by treatment.
GCOS analysis (GeneChip Operating Software, Affymetrix) was performed between control and treated animals at the 6 hr time point to determine significance of early-induced gene transcription in both treated animals compared to control. The raw and normalized array data are publicly available in the GEO database at NCBI with accession number GSE8252.
For the SMX experiment the detailed outline of the data analysis procedure has previously been published (Thomas et al., Citation2001).
qRT-PCR
Selected mRNA transcripts identified by microarray analysis in the TA experiment were substantiated by quantitative PCR using the Roche LightCycler. RNA (0.5 μ g) was reverse transcribed to cDNA from each rat sample using the OmniScript RT kit (Qiagen), using oligo (dT15) primers (Roche, Laval, Quebec, Canada) and RNAse inhibitor (Roche). Specific HPLC-purified primers for qRT-PCR were designed () and obtained from Integrated DNA Technologies (Coralville, IA). qRT-PCR was performed using the Roche LightCycler, (v 5.3.2), using the LightCycler FastStart DNA Master SYBR Green I reagent kit (Roche). All samples were run in triplicate and repeated 2–3 times. Instrument conditions varied for each gene due to differences in melting temperatures of the primers; however, the basic setup was as follows: 95°C for 10 min; 45 cycles in three steps: 95°C for 5 sec, annealing temperature (primer-specific, range 55–62°C) for 5 sec, elongation at 72°C for various times (due to difference in PCR product length, range 5–16 sec). Melting curve analysis was performed after amplification and carried out at a temperature transition rate of 0.2°C/sec up to 95°C. Data were normalized by calculating the absolute concentration of the cDNA of interest relative to absolute GAPDH concentration in each cDNA sample.
TABLE 1 Primer sequences for qRT-PCR
RESULTS
TA Part I: Genes Differentially Regulated at Both 6 hr and 24 hr
Forty-two genes were differentially regulated at both 6 hr and 24 hr. These genes include genes involved in liver regeneration, cell-cycle promotion, cellular adherence, and a cell stress response. These genes include SerDH, inhibin β A, spectrin β II, cadherin-17, DUSP6, IGFBP-1, p27Kip1, caspase-12 and AKR1B7. and display the means for each gene from all repeated experiments at 6 hr and 24 hr, respectively. and provide a brief description of each gene product.
FIG. 2 (A) Changes at 6 hr of genes differentially regulated at both 6 and 24 hr. The top bar for each gene is the data from the microarray, the middle bar is the data from the same mRNA analyzed by quantitative PCR, and the bottom bar represents the data from an independent experiment involving four treated and four control animals analyzed by quantitative PCR. By microarray, it was found that 42 genes were significantly differentially regulated at both 6 hr and 24 hr. In this figure, the focus is on 9 of these genes that are involved in cell stress and the promotion of liver regeneration or cell growth. (B) Changes at 24 hr of genes differentially regulated at both 6 and 24 hr. Graphed are the same 9 genes graphed in the same manner but at the 24 hr timepoint. Data for both graphs are expressed as log2 values, and all gene expression relative to GAPDH. All qRT-PCR were repeated 2 to 3 times, and run in triplicate. Standard error bars indicate variability between PCR runs.
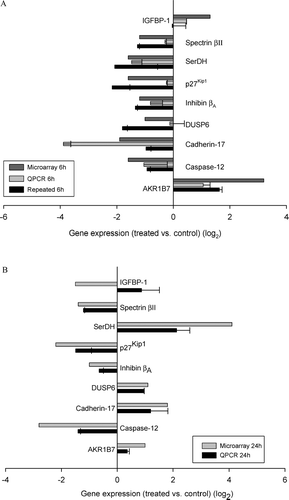
TABLE 2 Brief description of genes involved in liver regeneration, Cell-cycle promotion, intercellular adherence, and cell polarization
TABLE 3 Brief description of genes involved in oxidative stress, inflammation and Cytotoxicity, and Liver regeneration
TA Part II: Genes Significantly Different at 6 hr Only
Over 300 genes were identified by GCOS analysis to be differentially regulated at 6 hr. We believe that this time point best reflects the initial response to cell stress. We focused on those genes that are involved in oxidative stress, inflammation and cytotoxicity, as well as liver regeneration. There was marked up-regulation of genes involved in oxidative stress, including GCLC, GST α Yc2 subunit/GSTA5, TrxR, epoxide hydrolase, SGK1, and AKR7A3. There was also increased expression of genes involved in inflammation and cytotoxicity, including MSP1, IgGFcRIIβ, IRF-1, and IL-1β. Finally, SOCS2, MSP1, and p57Kip2 have roles in liver regeneration and also they showed increased gene expression in our system. shows the means from all repeated experiments for each gene; for individually graphed data displaying each treated animal versus each control animal for every gene, see supplemental figures. shows a brief description of each gene. lists transcripts that were differentially regulated by microarray at 6 hr that were of interest to our study objective, but on which qRT-PCR was not performed.
FIG. 3 Genes differentially regulated at 6 hr only. Shown here are the data on 12 genes of > 300 genes that were significantly different by microarray from control at 6 hr. These genes were chosen because they are associated with oxidative stress, inflammation, cytotoxicity or are promoters of liver regeneration. Similar to , the top bar for each gene is the data from the microarray, the middle bar is the data from the same mRNA analyzed by quantitative PCR, and the bottom bar represents the data from an independent experiment involving 4 treated and 4 control animals analyzed by quantitative PCR. Data are expressed as log2 values, and all gene expression relative to GAPDH. All qRT-PCR were repeated 2 to 3 times, in triplicate or duplicate. Standard error bars indicate variability between PCR runs.
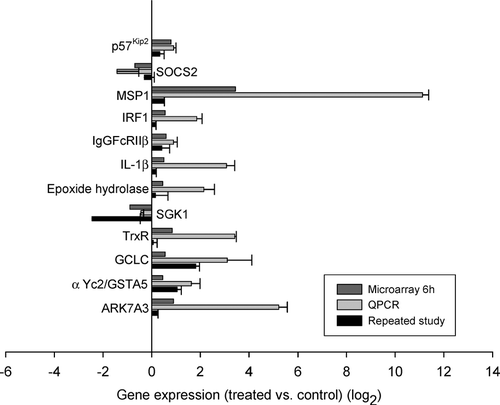
TABLE 4 Genes differentially regulated at 6 hr that were of interest to our study objective, but on which qRT-PCR was not performed
SMX: Genes Significantly Different at Both 6 hr and 24 hr
A significant number of genes were down regulated at both time points post-exposure to SMX. shows genes whose expression in at least one animal appeared to change by a factor of 2 or more. Among these genes were the ones involved in transport activity, acute phase response, regulation of cell growth, mitochondrial inner transport, transaminase activity, amino acid metabolism, alcohol dehydrogenase activity, oxido-reductive activity, RNA binding, and protein biosynthesis. These genes include serum amyloid A, orosomucoid 1, hemopexin, haptoglobin, Agp, insulin-like growth factor binding protein 1, glutamate oxaloacetate transaminase 1, spermine synthase, and ribosomal protein S9. A few genes were also upregulated at both timepoints, but these were mainly involved in metabolism 2C29, 2C37, 2C50, 2B10, 2C40, 2C44, 1A2, glutathione S-transferase mu 1, and catechol-O-methyltransferase. The up-regulation of glutathione S-transferase and catechol-O-methyltransferase might represent a danger signal but the changes were so minimal as to be uninterpretable.
TABLE 5 Fold-changes in Hepatic gene expression induced by treatment with SMX, either 6 or 24 hr after SMX treatment
DISCUSSION
Tienilic acid (TA) induced robust changes in genes known to be transcribed during oxidative stress, inflammation, and cytotoxicity, as well as in genes promoting liver regeneration, specifically via the promotion of cell-cycle progression, cell growth and polarization, and intercellular adherence. It appears that TA does indeed initiate cell stress signals in the male Sprague–Dawley rat liver, supporting the hypothesis that danger signals may be involved in initiating the immune response observed in TA-induced toxicity.
The early up-regulation of AKR7A3 (also called rat aflatoxin B1 aldehyde reductase or AFAR1) (Knight et al., Citation1999), GST α Yc2 (GSTA5) subunit (Hayes et al., Citation1994), and epoxide hydrolase (Arand et al., Citation2005) suggests that the major reactive metabolite of TA is the reactive thiophene epoxide. This observation supports the conclusion of Koenigs et al. (Citation1999) that the major metabolite of TA, 5-OH-TA, is formed via the thiophene epoxide. Furthermore, the marked up-regulation of genes known to be induced by oxidative stress, such as AKR1B7 (Chang et al., Citation2003), AKR7A3 (Knight et al., Citation1999), GCLC (Gong and Cederbaum, Citation2006), GSTA5 (Cavin et al., Citation2001) and thioredoxin reductase 1 (TrxR) (Sakurai et al., Citation2004), suggests that the reactive metabolite of TA escapes the active site of the rat CYP 2C11 enzyme. These genes are known to be controlled by the antioxidant response element (ARE), thus supporting a role for danger in this system.
Interestingly, SGK1, a known oxidative stress-induced transcriptionally-mediated gene was down-regulated at 6 hr; however, the half-life of this mRNA is short (approximately 20 min) (Firestone et al., Citation2003), and thus it is possible that 6 hr is too late to look for increased expression of this gene. Caspase-12 plays a role in endoplasmic reticulum (ER) stress-mediated apoptosis, and this protein is activated by ER stress stimuli in mice and rats (Momoi, Citation2004); although functional caspase-12 is not found in humans, the closely related human caspase-4 is located in the ER and activated by ER stress. Our data show down-regulation of caspase-12, but interferon regulatory factor 1 (IRF-1) expression is increased, and this transcription factor is known to be pro-apoptotic via the IFN-γ /STAT1 pathway in liver injury (Jaruga et al., Citation2004). Alternatively, ER stress-mediated apoptosis can occur via the caspase-8/caspase-9 pathway or the ASK/JNK pathway (Momoi, Citation2004). Rats do not develop overt liver toxicity although it is possible that there is some hepatocyte death in TA-treated rats.
The danger hypothesis suggests that the tissue involved determines the immune response; thus, if danger is at work in this system, the hepatocyte would be responsible for alerting the immune system that something is wrong and to stimulate an immune response. The ER is a well-known generator of stress signals, and prolonged ER stress plays a role in cell death (Vance, Citation2000). A distinct stress signal, the ER overload response, can be initiated by pharmacological agents that inhibit glycosylation or normal protein transport, resulting in aberrant protein accumulation; this activates NFκ B, which begins transcription of various inflammatory genes such as cytokines, chemokines, and cell-adhesion molecules (Pahl and Baeuerle, Citation1997). This scenario could theoretically occur with TA. Alternatively, covalent binding of the TA reactive metabolite to other cellular proteins essential to the life of the hepatocyte might also be enough to generate a danger signal. Hepatocyte necrosis would require clean-up by antigen-presenting cells, which might explain presentation of drug-modified protein and autoantibody production directed towards CYP 2C9 in humans.
The increased expression of IgGFcRIIβ (ortholog: mouse FCγ RIII or CD16), IL-1β, IRF-1 and macrophage-stimulating protein 1 (MSP1) at 6 hr provides striking evidence that an immune response is induced as early as 6 hr post-treatment with TA. IgGFcRIIβ mediates phagocytosis and antibody-dependent cell-mediated cytotoxicity by natural killer (NK) cells (Janeway et al., Citation2001) and is only expressed in the liver on Kupffer cells, resident NK cells and infiltrating neutrophils (accounting for a maximum of about 11% of resident liver cells, excluding neutrophils). The fact that this was detectable by microarray and qRT-PCR and repeatable in the second study indicates a robust induction of this gene in resident cells and/or rapid migration of neutrophils into the liver.
Another protein, MSP1 (also called hepatocyte growth factor-like), in addition to its involvement early in the liver regeneration process (Bezerra et al., Citation1994), can also inhibit inducible nitric oxide synthase (iNOS) and cyclooxygenase-2 (COX-2) (Wang et al., Citation2002), perhaps in an effort in some animals to decrease inflammation that has likely been initiated by Kupffer cells, neutrophils, NK cells and dendritic cells. Besides its pro-inflammatory role, IL-1β is produced by both Kupffer cells and sinusoidal endothelial cells during liver regeneration, but it has also been shown to play a role in curbing hepatocyte DNA synthesis after partial hepatectomy (Boulton et al., Citation1997).
Moreover, IL-1β is known to initiate the adaptive immune response by stimulating thymocyte proliferation, B-cell maturation and proliferation, and stimulate prostaglandin release (Janeway et al., Citation2001). IRF-1 has been shown to be crucial to the development of NK cells in lymphoid tissue (Ogasawara et al., Citation1998), and these cells may contribute to liver damage. In addition to IRF-1's pro-apoptotic role, it has been shown that the IRF-1/IFN-γ/STAT1 pathway mediates lymphocyte infiltration of leukocytes in vivo(Jaruga et al., Citation2004).
IGFBP-1 (Mohn et al., Citation1991) and MSP1 (Bezerra et al., Citation1994) are known to be expressed early in liver regeneration, while SerDH (Lopez-Flores et al., Citation2005), DUSP6 (Furukawa et al., Citation2003), inhibin βA (Luisi et al. Citation2001), spectrin β II (Mishra et al., Citation1999), p27Kip1 (Yang et al., Citation2003), p57Kip2 (Awad et al., Citation2000), cadherin-17 (Berndorff et al., Citation1994), and SOCS2 (Turnley, Citation2005) are involved in liver regeneration, cell-cycle promotion, and intercellular adherence. The trend with this gene set strongly indicates an early signal to start the regeneration process. The data show a robust expression profile of genes involved in the promotion of liver regeneration by 6 hr, indicating rapid hepatocyte damage by TA and an early signal to begin repair to replace damaged cells.
The transcription factor Nrf2 has been identified as the central protein that binds to the ARE present in the promoter of genes involved in the control of cellular redox homeostasis. Nrf2 is regulated at various levels, most often at the post-transcriptional level; Nrf2 mRNA levels have been shown not to change even in the presence of inducers of ARE-dependent genes, although one model using murine keratinocytes showed an Nrf2 increase (Nguyen et al., Citation2004). In our system, Nrf2 mRNA expression decreased (data not shown; microarray log2 values −0.5, −0.6 at 6 hr), but despite this, Nrf2-dependent genes were still activated. A number of genes differentially regulated in the present study were identified by Thimmulappa et al. (Citation2002) on their list of Nrf2-regulated genes in a murine knock-out model, namely epoxide hydrolase, aflatoxin aldehyde reductase (AKR7A3), aldo-keto reductase, GST α 2 (Yc2/GSTA5), GCS catalytic (GCLC), and dual-specificity protein tyrosine phosphatase (DUSP6).
These data support a role for “danger” in TA-induced hepatotoxicity. However, it is important to note that rats and most humans who are treated with TA do not develop overt liver toxicity and, therefore, even if a danger signal is necessary to initiate an immune response, it is insufficient by itself to result in significant liver injury. Although TA appears to act as a hapten and was said to act as a mechanism-based inhibitor of CYP 2C11, we now know from a recent study using a cellular system that, indeed, the reactive metabolite escapes the binding site of the enzyme and binding to other cellular proteins that have yet to be identified (Lopez-Garcia et al., Citation2005). This study was performed prior to publication of these data and our goal was to test whether TA could induce changes consistent with a danger signal assuming that it only covalently bound to CYP2C.
Our data show several potential danger signals, including transcription of the AKR1B7 and AKR7A3 genes, GCLC, GSTA5, TrxR and epoxide hydrolase, which could indicate danger to the immune system, potentially via activation of Kupffer cells or resident liver dendritic cells. These signals, according to the danger hypothesis, would act as “signal 2” to APCs that have already taken up self-antigen such as CYP 2C11 or TA-modified CYP 2C11. In view of the presence of autoantibodies directed towards P450 2C9 in the sera of patients with TA-induced hepatitis, the hapten hypothesis also appears to play a role. Indeed, these data strongly suggest oxidative stress has been induced by TA and thus has the potential to alert the immune system to yield TA-induced hepatitis.
Furthermore, the very early induction of genes promoting liver regeneration via cell-cycle progression, cell growth and polarization, and intercellular adherence indicates a rapid response to possible hepatocyte damage or a danger signal. These are novel data that, together with recent in vitro findings (Lopez-Garcia et al., Citation2005), support escape of a reactive metabolite of TA, binding of the metabolite(s) to other cellular and/or microsomal proteins that could potentially generate a danger signal which in some patients could initiate TA-induced liver necrosis.
In contrast, treatment of mice with SMX led to down-regulation of the expression of several hepatic genes except for a few genes involved in the drug metabolism. This was completely unexpected. Sulfamethoxazole is an aromatic amine known to form a reactive metabolite (Cribb et al., Citation1996). In addition, aromatic amines have the potential to redox cycle, which could cause oxidative stress. Therefore, as stated initially, we assumed that sulfamethoxazole would cause changes in gene expression and we were interested in seeing exactly which genes would be involved. They need not be the same genes that are involved in the response to other drugs that can act as danger signals.
We did not originally plan on publishing these two experiments together and the experiments were performed in different animals with different microarrays; therefore, the results cannot be directly compared. The sulfamethoxazole results should be considered preliminary because there were no prominent changes in gene expression that were good candidates to confirm with quantitative PCR. On the other hand, there is no reason to doubt the results. We know that mouse hepatic microsomes generate the reactive hydroxylamine and nitroso metabolites (Cribb and Spielberg, Citation1990).
The general response to electrophiles and oxidative stress, such as that mediated through ARE, is similar in rats, mice, and humans. In other experiments, we found strong evidence of a danger signal in mice treated with phenytoin and carbamazepine with the same microarray chip as was used for the SMX experiments (see the EDGE website, http://edge.oncology.wisc.edu/). The TA experiments were performed in Sprague-Dawley rats because we know that they metabolize TA to its reactive metabolite. The choice of species should be based on the metabolic pathways for the drug involved, but there is no basis for performing all such experiments in rats rather than mice.
We have chosen to publish these data together because they tell a conflicting story. On the one hand, we found that tienilic acid, which we studied because we thought it was most likely not to cause cell stress and might provide a test of the danger hypothesis, did in fact lead to changes in gene expression consistent with a danger signal whereas sulfamethoxazole, which we assumed would cause a danger signal, did not appear to. Further experiments are required to determine the degree to which drugs that cause IDRs induce danger signals. In particular, we plan to do a study to compare the effects of SMX with those of other drugs that are aromatic amines in both rats and mice using the microarray that is appropriate for the species to determine if the results with SMX are typical for aromatic amines. The results of such experiments have significant implications for whether it will be possible to develop biomarkers of IDR risk based on the danger hypothesis. Such biomarkers could have a major impact on the process of drug development.
This work was supported by the grants from the Canadian Institute for Health Research #13478 and Pfizer. Jack Uetrecht holds a Canada Research Chair in Adverse Drug Reactions. Stephanie Pacitto is a recipient of the Rx&D Health Research Foundation/CIHR Graduate Research Scholarship in Pharmacy.
REFERENCES
- Arand M., Cronin A., Adamska M., Oesch F. Epoxide hydrolases: Structure, function, mechanism, and assay. Meth. Enzymol. 2005; 400: 569–588
- Awad M. M., Sanders J. A., Gruppuso P. A. A potential role for p15(Ink4b) and p57(Kip2) in liver development. FEBS Lett. 2000; 483: 160–164
- Berndorff D., Gessner R., Kreft B., Schnoy N., Lajous-Petter A. M., Loch N., Reutter W., Hortsch M., Tauber R. Liver-intestine cadherin: Molecular cloning and characterization of a novel Ca2 +-dependent cell adhesion molecule expressed in liver and intestine. J. Cell Biol. 1994; 125: 1353–1369
- Bezerra J. A., Laney D. W., Jr., Degen S. J. Increased expression of mRNA for hepatocyte growth factor-like protein during liver regeneration and inflammation. Biochem. Biophys. Res. Commun. 1994; 203: 666–673
- Boulton R., Woodman A., Calnan D., Selden C., Tam F., Hodgson H. Non-parenchymal cells from regenerating rat liver generate interleukin-1α and -1β : A mechanism of negative regulation of hepatocyte proliferation. Hepatology 1997; 26: 49–58
- Cavin C., Mace K., Offord E. A., Schilter B. Protective effects of coffee diterpenes against aflatoxin B1-induced genotoxicity: Mechanisms in rat and human cells. Food Chem. Toxicol. 2001; 39: 549–556
- Chang Q., Harter T. M., Rikimaru L. T., Petrash J. M. Aldo-keto reductases as modulators of stress response. Chem. Biol. Interact. 2003; 143-144: 325–332
- Cribb A. E., Spielberg S. P. Hepatic microsomal metabolism of sulfamethoxazole to the hydroxylamine. Drug Metab. Dispos. 1990; 18: 784–787
- Cribb A. E., Nuss C. E., Alberts D. W., Lamphere D. B., Grant D. M., Grossman S. J., Spielberg S. P. Covalent binding of sulfamethoxazole reactive metabolites to human and rat liver subcellular fractions assessed by immunochemical detection. Chem. Res. Toxicol. 1996; 9: 500–507
- Firestone G. L., Giampaolo J. R., O'Keeffe B. A. Stimulus-dependent regulation of serum and glucocorticoid-inducible protein kinase (SGK) transcription, subcellular localization and enzymatic activity. Cell Physiol. Biochem. 2003; 13: 1–12
- Furukawa T., Sunamura M., Motoi F., Matsuno S., Horii A. Potential tumor suppressive pathway involving DUSP6/MKP-3 in pancreatic cancer. Am. J. Pathol. 2003; 162: 1807–1815
- Gautier L., Cope L., Bolstad B. M., Irizarry R. A. Affy–analysis of Affymetrix GeneChip data at the probe level. Bioinformatics 2004; 20: 307–315
- Gentleman R. C., Carey V. J., Bates D. M., Bolstad B., Dettling M., Dudoit S., Ellis B., Gautier L., Ge Y., Gentry J., Hornik K., Hothorn T., Huber W., Iacus S., Irizarry R., Leisch F., Li C., Maechler M., Rossini A. J., Sawitzki G., Smith C., Smyth G., Tierney L., Yang J. Y., Zhang J. Bioconductor: Open software development for computational biology and bioinformatics. Genome Biol. 2004; 5: R80
- Gong P., Cederbaum A. J. Nrf2 is increased by CYP2E1 in rodent liver and HepG2 cells and protects against oxidative stress caused by CYP2E1. Hepatology 2006; 43: 144–153
- Hayes J. D., Nguyen T., Judah D. J., Petersson D. G., Neal G. E. Cloning of cDNAs from fetal rat liver encoding glutathione S-transferase Yc polypeptides. The Yc2 subunit is expressed in adult rat liver resistant to the hepatocarcinogen aflatoxin B1. J. Biol. Chem. 1994; 269: 20707–20717
- Irizarry R. A., Bolstad B. M., Collin F., Cope L. M., Hobbs B., Speed T. P. Summaries of Affymetrix GeneChip probe level data. Nucleic Acids Res. 2003; 31: e15
- Immunobiology 5, C. Janeway, P. Travers, M. Walport, M. Shlomchik. Garland Publishing–Taylor & Francis Group, New York 2001
- Jaruga B., Hong F., Kim W. H., Gao B. IFN-γ /STAT1 acts as a pro-inflammatory signal in T-cell-mediated hepatitis via induction of multiple chemokines and adhesion molecules: A critical role of IRF-1. Am. J. Physiol. 2004; 287: G1044–G1052
- Ju C., Uetrecht J. P. Mechanism of idiosyncratic drug reactions: Reactive metabolite formation, protein binding and the regulation of the immune system. Curr. Drug Metab. 2002; 3: 367–377
- Knight L. P., Primiano T., Groopman J. D., Kensler T. W., Sutter T. R. cDNA cloning, expression and activity of a second human aflatoxin B1-metabolizing member of the aldo-keto reductase superfamily, AKR7A3. Carcinogenesis 1999; 20: 1215–1223
- Koenigs L. L., Peter R. M., Hunter A. P., Haining R. L., Rettie A. E., Friedberg T., Pritchard M. P., Shou M., Rushmore T. H., Trager W. F. Electrospray ionization mass spectrometric analysis of intact cytochrome P450: Identification of tienilic acid adducts to P450 2C9. Biochemistry 1999; 38: 2312–2319
- Landsteiner K., Jacobs J. Studies on the sensitization of animals with simple chemical compounds. J. Exp. Med. 1935; 61: 643–656
- Lopez-Flores I., Barroso J. B., Valderrama R., Esteban F. J., Martinez-Lara E., Luque F., Peinado M. A., Ogawa H., Lupianez J. A., Peragon J. Serine dehydratase expression decreases in rat livers injured by chronic thioacetamide ingestion. Mol. Cell Biochem. 2005; 268: 33–43
- Lopez-Garcia M. P., Dansette P. M., Coloma J. Kinetics of tienilic acid bioactivation and functional generation of drug-protein adducts in intact rat hepatocytes. Biochem. Pharmacol. 2005; 70: 1870–1882
- Lopez-Garcia M. P., Dansette P. M., Mansuy D. Thiophene derivatives as new mechanism-based inhibitors of cytochromes P-450: Inactivation of yeast-expressed human liver cytochrome P-450 2C9 by tienilic acid. Biochemistry 1994; 33: 166–175
- Luisi S., Florio P., Reis F. M., Petraglia F. Expression and secretion of activin A: Possible physiological and clinical implications. Eur. J. Endocrinol. 2001; 145: 225–236
- Matzinger P. Tolerance, danger and the extended family. Ann. Rev. Immunol. 1994; 12: 991–1045
- Mishra L., Cai T., Yu P., Monga S. P., Mishra B. Elf3 encodes a novel 200-kD beta-spectrin: Role in liver development. Oncogene 1999; 18: 353–364
- Mohn K. L., Melby A. E., Tewari D. S., Laz T. M., Taub R. The gene encoding rat insulin-like growth factor-binding protein 1 is rapidly and highly induced in regenerating liver. Mol. Cell Biol. 1991; 11: 1393–1401
- Momoi T. Caspases involved in ER stress-mediated cell death. J. Chem. Neuroanat. 2004; 28: 101–105
- Nguyen T., Yang C. S., Pickett C. B. The pathways and molecular mechanisms regulating Nrf2 activation in response to chemical stress. Free Rad. Biol. Med. 2004; 37: 433–441
- Ogasawara K., Hida S., Azimi N., Tagaya Y., Sato T., Yokochi-Fukuda T., Waldmann T. A., Taniguchi T., Taki S. Requirement for IRF-1 in the microenvironment supporting development of natural killer cells. Nature 1998; 391: 700–703
- Pahl H. L., Baeuerle P. A. The ER-overload response: Activation of NF-κ B. Trends Biochem. Sci. 1997; 22: 63–67
- Park B. K., Kitteringham N. R., Powell H., Pirmohamed M. Advances in molecular toxicology – towards understanding idiosyncratic drug toxicity. Toxicology 2000; 153: 39–60
- Robin M. A., Maratrat M., Le Roy M., Le Breton F. P., Bonierbale E., Dansette P., Ballet F. E., Mansuy D., Pessayre D. Antigenic targets in tienilic acid hepatitis. Both cytochrome P450 2C11 and 2C11-tienilic acid adducts are transported to the plasma membrane of rat hepatocytes and recognized by human sera. J. Clin. Invest. 1996; 98: 1471–1480
- Roujeau J. C., Stern R. S. Severe adverse cutaneous reactions to drugs [see comments]. N. Engl. J. Med. 1994; 331: 1272–1285
- Sakurai A., Yuasa K., Shoji Y., Himeno S., Tsujimoto M., Kunimoto M., Imura N., Hara S. Over-expression of thioredoxin reductase 1 regulates NF-κ B activation. J. Cell. Physiol. 2004; 198: 22–30
- Seguin B., Uetrecht J. The danger hypothesis applied to idiosyncratic drug reactions. Curr. Opin. Allergy Clin. Immunol. 2003; 3: 235–242
- Stoeckert C., Pizarro A., Manduchi E., Gibson M., Brunk B., Crabtree J., Schug J., Shen-Orr S., Overton G. C. A relational scheme for both array-based and SAGE gene expression experiments. Bioinformatics 2001; 17: 300–308
- Thimmulappa R. K., Mai K. H., Srisuma S., Kensler T. W., Yamamoto M., Biswal S. Identification of Nrf2-regulated genes induced by the chemopreventive agent sulforaphane by oligonucleotide microarray. Cancer Res. 2002; 62: 5196–5203
- Thomas R. S., Rank D. R., Penn S. G., Zastrow G. M., Hayes K. R., Pande K., Glover E., Silander T., Craven M. W., Reddy J. K., Jovanovich S. B., Bradfield C. A. Identification of toxicologically-predictive gene sets using cDNA microarrays. Mol. Pharmacol. 2001; 60: 1189–1194
- Turnley A. M. Role of SOCS2 in growth hormone actions. Trends Endocrinol. Metab. 2005; 16: 53–58
- Uetrecht J. Screening for the potential of a drug candidate to cause idiosyncratic drug reactions. Drug Discov. Today 2003; 8: 832–837
- Uetrecht J. Role of drug metabolism for breaking tolerance and the localization of drug hypersensitivity. Toxicology 2005; 209: 113–118
- Uetrecht J. P. Is it possible to more accurately predict which drug candidates will cause idiosyncratic drug reactions?. Curr. Drug Metab. 2000; 1: 133–141
- Vance R. E. Cutting edge: cutting edge commentary: A Copernican revolution? Doubts about the danger theory. J. Immunol. 2000; 165: 1725–1728
- Wang M. H., Zhou Y. Q., Chen Y. Q. Macrophage-stimulating protein and RON receptor tyrosine kinase: Potential regulators of macrophage inflammatory activities. Scand. J. Immunol. 2002; 56: 545–553
- Yang C., Sun M., Ilic Z., Friedrich T. D., Sell S. Reduced expression of p27kip1 and increased hepatocyte proliferation in p53-deficient mice. Mol. Carcinog. 2003; 36: 15–22
- Hepatotoxicity: The Adverse Effects of Drugs and Other Chemicals on the Liver. 2nd Edition, H. Zimmerman. Lippincott Williams & Wilkins, Philadelphia 1999