Abstract
Drugs that target the CNS or doses of drugs near the maximum tolerated dose may cause a non-specific stress response during routine safety testing in rodents that leads to the release of corticosterone and changes immunological parameters. In situations with mild clinical signs of stress and changes to immune organs, it may be difficult to differentiate direct immunotoxicity from changes mediated by stress. To address this concern, studies were conducted to identify potential biomarker of stress in rats that could be used in routine toxicology studies. Since serial blood collections for corticosterone levels are not practical, studies were conducted to evaluate urine corticosterone and its metabolites as a potential biomarker of stress in male Sprague-Dawley rats. Exogenous corticosterone was used as a reference to identify immune system targets and determine their relative sensitivity to corticosterone. The data from rats treated with exogenous corticosterone and from rats treated with drug or chemical stressors produced linear relationships between urine corticosterone and most immunological parameters, with r-squared values greater than 0.6. Thus, quantitatively similar effects on immunological end points are produced by exogenous corticosterone and by corticosterone induced by chemical stressors with regard to their correlation to selected immunological changes. In preclinical safety testing for a new drug, the combined findings of increased urinary corticosterone and changes of the predicted magnitude and direction in blood lymphocyte and neutrophil differentials and thymus weight or cellularity would strongly suggest that the immunological effects are secondary to a drug-induced stress response. Because these results can be obtained reliably during routine preclinical evaluations, they should be useful for the weight-of-evidence approaches often used in regulatory settings.
INTRODUCTION
Preclinical safety testing for new drugs typically involves testing at doses up to the maximum tolerated dose. For certain chemicals, such dosages cause a neuroendocrine stress response in both rodents and primates (de Boer et al., Citation1992; Barr et al., Citation2004). Stress responses are also more commonly observed with drugs targeted to the CNS (de Boer et al., Citation1992). The stress response and associated increases in circulating glucocorticoids cause changes in the immune system. Neutrophilia and lymphopenia may be observed along with decreased weight and cellularity of the thymus, spleen and lymph nodes. In reviewing data from studies with dramatic stress-related events, a combination of clinical signs, decreases in body weight and changes in hematological parameters and lymphoid organ weights and histopathology strongly suggest a stress-mediated mechanism rather than direct toxicity of the test compound.
However, in situations in which mild changes are observed it may be difficult to differentiate stress from direct immunotoxicity. For these situations, an additional indicator of stress could be very valuable. This is consistent with the recommendations of the ICH S8 Guidance for Industry on Immunotoxicity Studies of Human Pharmaceuticals (2006). Compelling evidence of stress is needed to justify not conducting additional studies to further investigate potential direct immunotoxicity. Although ICH S8 includes immune function tests (Tier 2), this study focuses on Tier 1 tests because it is these that have been historically used to claim that a drug-induced effect is mediated by a neuroendocrine stress response.
Previous studies in mice demonstrated that the area under the corticosterone concentration vs. time curve (AUC) correlates with and can even predict changes in immunological parameters induced by drug and chemical stressors (Pruett et al. Citation2003; Schwab et al. Citation2005). However, determination of the AUC value requires control and treated groups at each of 4–6 timepoints. This would not be practical for routine toxicity studies and would require additional satellite groups of animals for blood collection. Thus, in a recent study we investigated the possibility of measuring corticosterone (and/or metabolites) in the urine in rats and found that urine corticosterone correlated well with serum corticosterone AUC values following exposure of rats to stressors (Pruett et al., Citation2006).
However, it remains to be determined if changes in immunological parameters correlate with urine corticosterone. Therefore, studies were conducted to determine if increases urine corticosterone levels are associated with immunological changes induced with the administration of corticosterone and by different chemical stressors. This report is a summary of findings from a series of studies. These results should provide a basis for determining whether immunological changes noted in safety testing are caused by a stress response.
MATERIALS AND METHODS
Animals and Dosing
Male specific pathogen free Sprague-Dawley rats were used in these experiments at approximately 8 weeks of age. Female rats were used in a previous study (Pruett et al., 2007), and males were used in this study, in part, to determine if effects in males were similar. Rats were housed singly in metabolic cages and were allowed to acclimate to the facility and recover from shipping stress for at least 2 weeks before use in experiments. Rats were maintained on a 12-hr/12-hr light/dark cycle (0700-1900 light) with food (Purina Lab Chow 5001) and water available ad libitum. Animal care and use were in accordance with the guidelines of LSU Health Sciences Center and the Guide for the Care and Use of Laboratory Animals (Institute of Laboratory Animal Resources, Commission on Life Sciences, National Research Council, 1996). The animal facility in which the animals were housed is accredited by the American Association for Accreditation of Laboratory Animal Care.
Rats were given corticosterone (Sigma Chemical Co., St. Louis, MO) as a suspension in a vehicle of β -cyclodextrin (2%, Sigma) and methylcellulose (1%, Sigma) in phosphate-buffered saline. This vehicle was designed to delay absorption and provide a peak concentration and area under the concentration vs. time curve similar to those induced by chemical stressors (Weiss et al., 2006). Corticosterone was administered subcutaneously at 10, 20, or 30 mg/kg, and in most experiments two doses were given 2 hr apart. Atrazine (ChemService, Inc., West Chester, PA) was administered subcutaneously as a suspension in a vehicle of 1% methylcellulose and 0.05% Tween 80 (Sigma) in phosphate buffered saline. Ethanol was administered as a 32% solution in water by oral gavage at dosages of 5 or 6 g/kg. Kepone (ChemService) was administered subcutaneously at 10 mg/kg body weight using corn oil as a vehicle. 2-Deoxyglucose (2-DG, Sigma) was dissolved in phosphate buffered saline and administered at 500 mg/kg intraperitoneally.
Experimental Design
Compounds were administered for at least 4 d, and in all but one experiment urine samples were collected 0–6 hr after the last dose and immunological parameters were measured at necropsy 24 hr after the last dose. This design was selected to allow time for relatively small effects of some stressors in immunological parameters to become as evident as possible. The times of administration are indicated for each experiment:
Experiment 13: Vehicle or kepone was administered on Days 1, 4, 7, and 9 with 5 rats per group. Urine was collected 0–6 hr after the last dose, and immunological parameters were assessed 24 hr after the last dose.
Experiment 14: Vehicle or 2-deoxyglucose was administered on Days 1, 4, 7, and 9 with 5 rats per group. Urine was collected 0–6 hr after the last dose, and immunological parameters were assessed 24 hr after the last dose.
Experiment 15: Vehicle or exogenous corticosterone was administered twice per day (2 hr apart) for 5 d with 5 rats per group. Urine was collected from 0–6 hr after the fourth dose. Necropsy was performed and immunological parameters assessed 2 hr after the last dose. Although this experiment was different in the timing of necropsy, the data were still suitable for use because the immunological changes reflect changes induced by 4–5 d of dosing, which are similar whether assessed 2 or 24 hr after the last dose.
Experiment 20: Vehicle or atrazine (200 or 400 mg/kg) was administered daily for 7 d with 5 rats per group. Urine was collected 0–6 hr after the last dose, and immunological assessments were done 24 hr after the last dose.
Experiment 21: Vehicle or ethanol (5.9 g/kg on Day 1, then 5.0 g/kg on Days 2-5 for one group and two doses per day of 5.0 g/kg then 4 hr later 3.0 g/kg on Day 2, 4.0 g/kg on day 3, and 5.0 g/kg on Days 4 and 5) was administered to groups of five rats (vehicle), six rats (single dose of ethanol per day), or seven rats (two doses of ethanol per day). Urine was collected 0–6 hr after the last dose of ethanol, and immunological parameters were evaluated 24 hr after the last dose.
Experiment 22: Vehicle or corticosterone (10, 20, or 30 mg/kg) was administered twice per day (2 hr apart) for 5 d with a group size of 5. Urine was collected 0–6 hr after the last dose, and immunological parameters were evaluated 24 hr after the last dose.
Experiment 25: Vehicle or atrazine (200, 400, or 600 mg/kg) was administered once daily for 5 d. Urine was collected 0-6 hr after the last dose, and immunological parameters were assessed 24 hr after the last dose. Urine samples were also collected in most experiments from 6–24 hr. However, initial analysis indicated that the values from the 0–6 hr samples correlated better with immunological parameters, so these values are the only ones shown.
Corticosterone Immunoassay
Corticosterone metabolites are excreted in the urine, whereas only low levels of un-metabolized corticosterone are found in the urine (Bamberg et al., Citation2001; Cavigelli et al., Citation2005). The immunoassay used for this study was developed for corticosterone. The cross-reactivity of the anti-corticosterone antibody against corticosterone metabolites has not been well characterized (Assay Designs Corticosterone Enzyme Immunoassay package insert). The concentration of total corticosterone metabolites measured in the assay is based on a standard curve with corticosterone. Thus, data were presented as percent of vehicle to evaluate relative changes in urine corticosterone rather than absolute amount of corticosteroid metabolites. Urine samples were diluted 1/200 (for control and low dose stressors) or 1/500 (for high dose stressors) and analyzed by a commercial corticosterone ELISA (Assay Designs, Ann Arbor, MI).
Values for some samples were also determined using an RIA kit from MP Bioproducts (formerly ICN), and the values were similar. Corticosterone values were calculated on the basis of a standard curve prepared using standards included in the kit. To simplify terminology, urine corticosteroid metabolites measured by the immunoassay will be referred to as urine corticosterone in this report.
Immunological Assessments
Rats were anesthetized then exsanguinated by cardiac puncture and blood was collected in heparin tubes for hematological analysis. Blood samples were labeled for flow cytometry with antibodies specific for CD8 (labeled with FITC), CD4 (labeled with phycoerythrin), and NKRP1 (labeled with CyChrome) or with antibodies specific for CD45R (labeled with FITC) and MHC Class II (labeled with phycoerythrin). All antibodies were obtained from BD Pharmingen (San Diego, CA). A separate sample was used for white blood cell counts and differentials (Bayer Advia 12 0 instrument). Organ weights were determined at necropsy, then portions were fixed in formalin for histological analysis and portions of spleen and thymus were used to prepare single cell suspensions to obtain the number of cells per organ. This was done by performing a cell count with a Coulter Counter and extrapolating to total cells per organ on the basis of total organ weight and weight of the portion from which the cells were obtained.
Statistical Analysis and Correlation Models
To allow comparison of results from separate experiments, results were normalized by expressing values from the control group as 100% and calculating the values for other groups in relationship to this value. Values for corticosterone in the urine (total amount excreted in 6 hr) were plotted against immunological parameters. All of the data shown can be described by a linear model with no significant contribution from a non-linear component (as indicated by Prism 4.0 software, GraphPad, San Diego, CA). However, this required deleting one or two data points with the greatest increase in corticosterone. Because these models were derived for the purpose of predicting and explaining these effects, a linear model in which prediction is possible only within a certain range of values seemed appropriate.
RESULTS
Urine Corticosterone
Creatinine in the urine samples was also measured, since differences in the concentration of the urine can be compensated by dividing the corticosterone values by the creatinine values (Spangenberg et al., Citation2005). In addition, total corticosterone output in the urine for 6 hr was determined by multiplying the recorded urine volume collected by corticosterone concentration. Comparison of corticosterone/creatinine and total urine corticosterone yielded similar results in terms of differences between groups, but the within group variability was less for the total corticosterone value, so it was used in all analyses shown here. Corticosterone values are expressed here as percent of control group values. This facilitates comparison of results from different experiments.
There was some variation in the corticosterone values for urine from control groups in different experiments. However, the values for treated animals as a proportion of values from control animals allowed the development of excellent linear models. The mean absolute value for corticosterone and metabolites in control mice from all experiments was 339 ± 161 ng per 6 hr urine sample. The mean value for treated animals was 4553 ± 1996 ng per 6 hr urine sample.
Differential White Blood Cell Counts
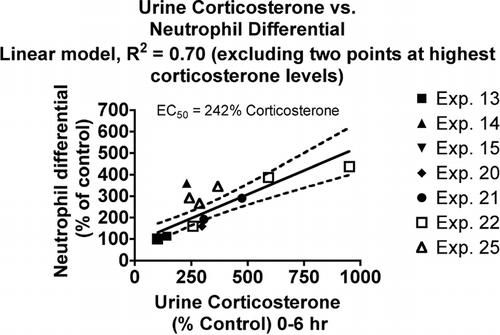
Corticosterone was administered at levels comparable to those induced by a stress response, and it increased neutrophils and decreased lymphocyte counts. The extent of the changes observed was found to correlate with urine corticosterone levels. Neutrophil differential (percent of white blood cells) increased with increasing concentrations of corticosterone in the urine (). The linear model shown in has an r2 value of 0.70 and describes results for different treatments that cause elevated urine corticosterone values. The neutrophil differential was one of the most sensitive parameters to the effects of corticosterone, as indicated by the EC50 value (242%). The EC50 is defined in this case as the % increase in urine corticosterone required to cause the immunological parameter value to decrease by one-half or to double.
FIG. 1 Relationship between urine corticosterone and neutrophil differential count in the blood. Values for both parameters were normalized by expressing control values as 100% and comparing the values for treated animals to this value. Each symbol represents the mean values for one group of rats (4–7 rats per group, see Materials and Methods). Symbols of the same type indicate groups from a particular experiment. The linear model was derived and r-squared values calculated using Prism 4.0 software (GraphPad, San Diego).
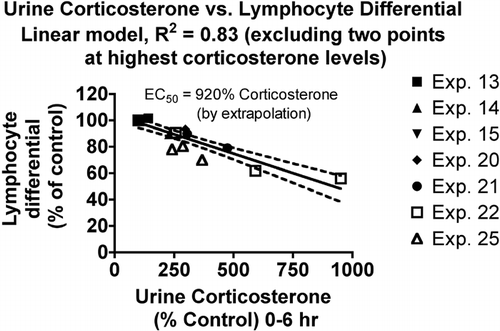
The lymphocyte differential count was not as sensitive to corticosterone, with a much greater EC50 value comparing the linear model for lymphocytes () to the linear model for neutrophils (). The r2 value is 0.83, which indicates the best correlation for any model in this series.
FIG. 2 Relationship between urine corticosterone and lymphocyte differential count in the blood. Values for both parameters were normalized by expressing control values as 100% and comparing the values for treated animals to this value. Each symbol represents the mean values for one group of rats (4–7 rats per group, see Materials and Methods). Symbols of the same type indicate groups from a particular experiment. The linear model was derived and r-squared values calculated using Prism 4.0 software.
Thymus Weight
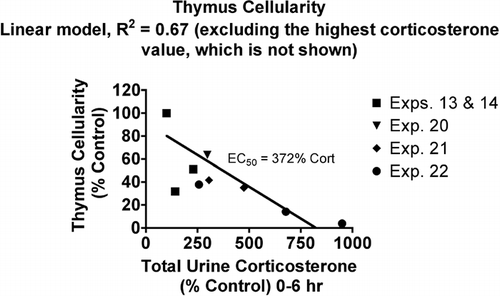
The relationship between thymus cellularity (nucleated cells per thymus) and urine corticosterone was similar to the relationship for neutrophils, but the EC50 value was higher for thymus cellularity, indicating it is slightly less sensitive to changes in corticosterone ().
FIG. 3 Relationship between urine corticosterone and thymus cellularity. Values for both parameters were normalized by expressing control values as 100% and comparing the values for treated animals to this value. Each symbol represents the mean values for one group of rats (4–7 rats per group, see Materials and Methods). Symbols of the same type indicate groups from a particular experiment. The linear model was derived and r-squared values calculated using Prism 4.0 software.
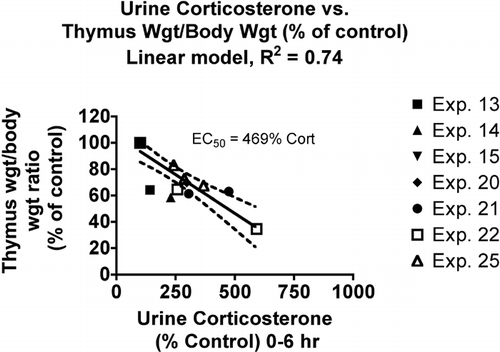
The thymus weight to body weight ratio yielded similar EC50 values with linear (excluding the two data points with the greatest increase in corticosterone) and non-linear models. However, thymus weight was apparently not as sensitive to corticosterone as cellularity, with an EC50 value of 470% as compared to 372% for cellularity (). This may not indicate greater sensitivity of this parameter per se, but the thymus weight is compensated for body weight loss (which did occur in some groups) by dividing thymus weight by body weight, whereas thymus cellularity is not adjusted in this way.
FIG. 4 Relationship between urine corticosterone and thymus weight to body weight ratio. Values for both parameters were normalized by expressing control values as 100% and comparing the values for treated animals to this value. Each symbol represents the mean values for one group of rats (4–7 rats per group, see Materials and Methods). Symbols of the same type indicate groups from a particular experiment. The linear model was derived and r-squared values calculated using Prism 4.0 software.
NK Cell Percentage in Blood
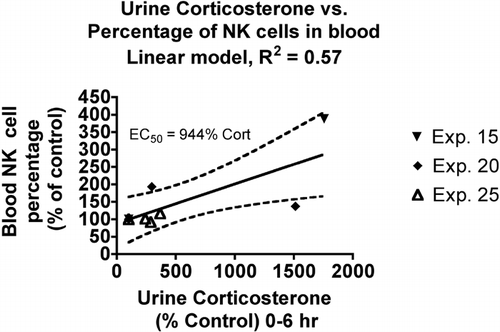
The percentage of total blood leukocytes with the NKRP1 marker for NK cells was determined by flow cytometry in three experiments. In contrast to the lymphopenia associated with increasing urine corticosterone levels, there was a slight increase in NK cell percentage (). The linear model was adequate, but the r2 value was lower than for the other immunological parameters. The EC50 value indicates that this is not a very sensitive parameter.
FIG. 5 Relationship between urine corticosterone and neutrophil differential count in the blood. Values for both parameters were normalized by expressing control values as 100% and comparing the values for treated animals to this value. Each symbol represents the mean values for one group of rats (4–7 rats per group, see Materials and Methods). Symbols of the same type indicate groups from a particular experiment. The linear model was derived and r-squared values calculated using Prism 4.0 software.
Other Parameters
Blood leukocytes were also labeled for B-cell and T-cell markers, but no obvious trends of change in these cell types were noted, so these results are not shown. The situation was similar for the total white blood cell count. Adrenal weight tended to increase in animals treated with the highest dosage of chemical stressors, but administration of exogenous corticosterone was associated with a decrease in adrenal weight. Thus, these data were unsuitable for modeling.
DISCUSSION
The results of this study demonstrate that corticosterone administration to rats results in increases in neutrophils, decreases in lymphocytes, and decreases in thymic weight and cellularity. These parameters were also altered by known chemical stressors. Increases in neutrophil percentage and decreases in thymic cellularity and weight appear to be the most sensitive parameters. An unexpected finding was the slight increase in NK cell percentage in light of the decreases in lymphocyte counts and percentage (only significant in the two groups with the greatest increases in corticosterone). This finding was confirmed in an additional experiment with exogenous corticosterone (not shown) and is consistent with a report that a high dose of methylprednisolone results in an increase in NK cell percentage in blood (Tunc et al., Citation2003). These results indicate that stress is one factor that must be considered in immunotoxicity resulting from high dosages such as those mandated or commonly used in safety testing in animals.
In a previous study, we demonstrated that urinary corticosterone correlates well with area under the corticosterone concentration vs. time curve determined using serum (Pruett et al., Citation2006). Thus, collecting urine for 6 hr gives a single corticosterone value that can be used to evaluate the total increase in corticosterone exposure during that period of time. Changes in urine corticosterone levels (percent increase) correlated well with changes in neutrophils, lymphocytes, thymus weight and cellularity and NK cells.
Data from this study demonstrate that urine corticosterone is a good biomarker of stress and could provide necessary evidence to differentiate stress from direct immunotoxicity. Taking the correlation a step further in the future, quantitative models using urine corticosterone data in the rat may be developed when additional data are obtained. Such models have been developed in the mouse with different chemical stressors (Pruett et al., Citation2003). For most parameters, including thymus cellularity, the linear model derived from data obtained using exogenous corticosterone accurately predicted the immunological effects of the stressors. These models may help identify compounds that produce stress-induced immunological changes and in addition are directly immunotoxic. For these compounds it would be expected that there would be greater changes in immunological parameters than one would expect to be produced by corticosterone alone. Additional studies will be needed to better define a model that could be used to quantitatively differentiate stress from direct toxicity.
In conclusion, these findings indicate that urine corticosterone is a good biomarker of stress in rats. Urine samples could be collected from samples of animals that show clinical signs of stress during a toxicity study and stored frozen until organ weight data are obtained and histopathology analysis is completed. If signs of immunotoxicity are observed, urine samples could be analyzed for corticosteroids to help differentiate stress from direct immunotoxicity.
REFERENCES
- Bamberg E., Palme R., Meingassner J. G. Excretion of corticosteroid metabolites in urine and feces of rats. Lab. Anim. 2001; 35: 307–314
- Barr C. S., Newman T. K., Lindell S., Becker M. L., Shannon C., Champoux M., Suomi S. J., Higley J. D. Early experience and sex interact to influence limbic-hypothalamic-pituitary-adrenal-axis function after acute alcohol administration in rhesus macaques (Macaca mulatta). Alcohol Clin. Exp. Res. 2004; 28: 1114–1119
- Cavigelli S. A., Monfort S. L., Whitney T. K., Mechref Y. S., Novotny M., McClintock M. K. Frequent serial fecal corticoid measures from rats reflect circadian and ovarian corticosterone rhythms. J. Endocrinol. 2005; 184: 153–163
- De Boer S. F., Slangen J. L., van der Gugten J. Brain benzodiazepine receptor control of stress hormones. Stress: Neuroendocrine and Molecular Approaches, R. Kvetnansky, R. McCarty, J. Axelrod. Gordon and Breach Science Publishers, New York 1992
- Pruett S. B., Fan R., Zheng Q., Myers L. P., Hébert P. Modeling and predicting immunological effects of chemical stressors: characterization of a quantitative biomarker for immunological changes caused by atrazine and ethanol. Toxicol. Sci. 2003; 75: 343–354
- Pruett S. B., Hébert P., Lapointe J. M., Reagan W., Lawton M., Kawabata T. T. Characterization of the action of drug-induced stress responses on the immune system: Evaluation of biomarkers for drug-induced stress in rats. J. Immunotoxicol. 2006; 4: 25–38
- Schwab C. L., Fan R., Zheng Q., Myers L. P., Hébert P., Pruett S. B. Modeling and predicting stress-induced immunosuppression in mice using blood parameters. Toxicol. Sci. 2005; 83: 101–113
- Spangenberg E. M., Augustsson H., Dahlborn K., Essen-Gustavsson B., Cvek K. Housing-related activity in rats: Effects on body weight, urinary corticosterone levels, muscle properties and performance. Lab. Anim. 2005; 39: 45–57
- Tunc B., Oner A. F., Hicsonmez G. The effect of short-course high-dose methylprednisolone on peripheral blood lymphocyte subsets in children with acute leukemia during remission induction treatment. Leuk. Res. 2003; 27: 19–21
- Weiss P. A., Collier S. D., Pruett S. B. Role of glucocorticoids in ethanol-induced decreases in expression of MHC Class II molecules on B-cells and selective decreases in spleen cell number. Toxicol. Appl. Pharmacol. 1996; 139: 153–162