
Abstract
Inhalation of indoor air pollutants may cause airway irritation and inflammation and is suspected to worsen allergic reactions. Inflammation may be due to mucosal damage, upper (sensory) and lower (pulmonary) airway irritation due to activation of the trigeminal and vagal nerves, respectively, and to neurogenic inflammation. The terpene, d-limonene, is used as a fragrance in numerous consumer products. When limonene reacts with the pulmonary irritant ozone, a complex mixture of gas and particle phase products is formed, which causes sensory irritation. This study investigated whether limonene, ozone or the reaction mixture can exacerbate allergic lung inflammation and whether airway irritation is enhanced in allergic BALB/cJ mice. Naïve and allergic (ovalbumin sensitized) mice were exposed via inhalation for three consecutive days to clean air, ozone, limonene or an ozone–limonene reaction mixture. Sensory and pulmonary irritation was investigated in addition to ovalbumin-specific antibodies, inflammatory cells, total protein and surfactant protein D in bronchoalveolar lavage fluid and hemeoxygenase-1 and cytokines in lung tissue. Overall, airway allergy was not exacerbated by any of the exposures. In contrast, it was found that limonene and the ozone–limonene reaction mixture reduced allergic inflammation possibly due to antioxidant properties. Ozone induced sensory irritation in both naïve and allergic mice. However, allergic but not naïve mice were protected from pulmonary irritation induced by ozone. This study showed that irritation responses might be modulated by airway allergy. However, aggravation of allergic symptoms was observed by neither exposure to ozone nor exposure to ozone-initiated limonene reaction products. In contrast, anti-inflammatory properties of the tested limonene-containing pollutants might attenuate airway allergy.
Introduction
Asthma is characterized by the presence of airway inflammation, mucus hypersecretion, airway remodeling and airway hyper-responsiveness leading to airflow limitation (Lambrecht & Hammad Citation2015). Persons suffering from asthma and allergic airway disease may be more sensitive to inhaled irritants because of these airway abnormalities. For example, cold air-induced asthma attacks may be caused by the stimulation of receptors on the vagus nerves, which activate bronchial smooth muscles (Xing et al. Citation2008). Further, trigeminal neuronal hyper-responsiveness has been observed in allergic inflammation (Canning Citation2002). Another observation is that prostaglandin E2 released during inflammatory reactions enhances the sensitivity of pulmonary C-fibers to sensory irritants (Lee & Widdicombe Citation2001). Inhalation of reactive volatile organic compounds (VOC) and particles present in the indoor environment can per se cause airway inflammation and irritation (Wolkoff et al. Citation2013). This may be due to direct mucosal damage, upper (sensory) and lower (pulmonary) airway irritation due to activation of the trigeminal and the vagal nerves, respectively, and neurogenic inflammation. However, the reaction to inhalation of irritant VOC or particles is not well elucidated in persons with allergic airway inflammation.
Indoor air pollutants can contain complex mixtures of VOC emitted from paints, furniture, cleaning agents and fabrics. Several studies have suggested that outdoor pollutants may exacerbate asthma (Carlsten & Melen Citation2012; Huang et al. Citation2015; Thurston et al. Citation1997), but the causality between exacerbation and exposure to irritants and pollutants in indoor air is yet unsupported (Nurmatov et al. Citation2015). Ozone is an indoor air pollutant; it infiltrates from the outdoors and is emitted from high-voltage electrical appliances. Ozone causes pulmonary irritation (Nielsen et al. Citation1999) and triggers pulmonary responses (Johansson et al. Citation2015; Silverman & Ito Citation2010). Generally, indoor ozone concentrations are between 20% and 70% of outdoor levels. Reported indoor levels are between 2 and 100 ppb, but substantially higher levels in aircrafts (Fadeyi Citation2015). Epidemiological studies have described associations between asthma attacks and high levels of air pollution, including ozone (Peel et al. Citation2005; Silverman & Ito Citation2010).
The terpene, limonene, a ubiquitous indoor VOC, is used as a fragrance in consumer and household products (Nazaroff & Weschler Citation2004). Reported concentrations are from 10–100 ppb in air cabins and offices (Nørgaard et al. Citation2014), but peak exposures may be considerably higher (Trantalidi et al. Citation2015). When limonene reacts with and thus consumes ozone, a complex reaction mixture of (poly)-oxygenated VOC and ultrafine particles (secondary organic aerosols) is formed that causes upper airway irritation (Rohr et al. Citation2002; Wolkoff et al. Citation2008, Citation2012).
Based on the above findings, it was hypothesized that inhalation of ozone and of ozone-initiated limonene reaction products aggravate allergic airway disease, including inflammation. Further, it was hypothesized that the effect of inhaled airway irritants is exacerbated in the presence of an allergic lung inflammation. A few studies have demonstrated an anti-inflammatory prophylactic effect of limonene alone using rodent models of allergic inflammation (Bibi et al. Citation2015; Hirota et al. Citation2012; Hansen et al. Citation2013; Keinan et al. Citation2005). Thus, it was further hypothesized that inhalation of limonene could attenuate an existing allergic airway inflammation and thus possess a treatment-related effect.
To address the hypotheses, allergic and nonallergic mice were exposed to air alone, ozone, limonene or an ozone–limonene reaction mixture. By using a factorial design, where allergic and nonallergic animals were exposed to the same air pollutants, it was possible to investigate if: (a) limonene, ozone, or their reaction products caused acute effects on respiration and inflammation in non-allergic mice; (b) limonene, ozone or their reaction products aggravated or attenuated an existing pulmonary allergic inflammation; and (c) the inflammatory and irritant responses to limonene, ozone or their reaction products differed between allergic and nonallergic mice. Standard mouse models of airway irritation based on head-out plethysmography (Alarie Citation1973; Nielsen et al. Citation1999; Vijayaraghavan et al. Citation1993) and airway allergy to the model allergen ovalbumin (OVA) (Kumar et al. Citation2008) were used to test the hypotheses.
Methods
Animals
Forty inbred BALB/cJ mice (female, 3- or 5-week of age) were purchased from Taconic M&B (Ry, DK) and acclimatized for 3 or 1 week, respectively. All cages were furnished with Lignocel (Brogaarden, DK) bedding material, gnaw sticks and transparent red plastic nesting houses. The photoperiod was from 6 AM to 6 PM, and temperature and mean relative humidity in the animal room were 20–22 °C and 37–57%, respectively. Cages were sanitized twice weekly. Food (Altromin no. 1324, Altromin, Lage, DE) and potable municipal tap water were available ad libitum.
Mice were randomly assigned to cages on arrival. Mice were housed 3–4 per cage, thus 10 mice for each airborne exposure were allocated to three cages. Of these 10 mice, five were sham- and five OVA-sensitized and these mice were evenly distributed in the three cages to eliminate any cage effects. Thus, 1–2 naïve and 1–2 allergic mice were housed together. For practical reasons, the limonene and ozone–limonene groups were sensitized and exposed two weeks following the air and ozone groups, but all mice were 6-week of age when entering the experiment. Mean body weight was 17.5 and range of group means was 16.8–18.1 g at Day 1 and did not differ between groups.
Treatment of the animals followed procedures approved by The Animal Experiment Inspectorate, Denmark (Permissions no. 2006/561-1123-C3 and 2012 − 15 − 2934 − 00616-C1). All experiments were performed by trained personnel and conformed to the Danish Regulations on Animal Experiments (LBK nr. 474 af 15/05/2014 and BEK nr. 88 af 30/01/2013) that includes guidelines on care and use of animals in research. Anesthesia was not used during any airborne exposures because the bioassay depended on spontaneously breathing animals. Animals were weighed on Days 1, 22, 26, 28 and 30.
Chemicals and anesthesia
Chicken egg ovalbumin (OVA, Grade V) was purchased from Sigma (St. Louis, MO) and used without further purification. The Al(OH)3 adjuvant (Alhydrogel) was obtained from Brenntag Biosector, Denmark. R-(+)-Limonene (99%) was bought from Fluka (Sigma). For terminal anesthesia, ZRF cocktail containing 3.3 mg zolazepam/mL, 3.3 mg tiletamine/mL, 0.5 mg xylazine/mL and 2.6 μg fentanyl citrate/mL was administered intraperitoneally at a nominal dose of 0.1 mL/10 g body weight.
Generation and characterization of test atmospheres
OVA aerosols were generated by a PARI LC STAR nebulizer (PARI GmbH, Germany) and the airborne concentration of allergen determined gravimetrically as previously described (Hansen et al. Citation2007). Generation and characterization of ozone, limonene vapor and reaction mixtures of ozone and limonene have been described previously (Clausen et al. Citation2001; Wolkoff et al. Citation2008). In brief, ozone was generated by ultraviolet light photolysis of oxygen (O2) and transferred at ≈50 mL/min through a stainless-steel tube to a 5 m polyethylene reaction flow tube (ID = 2.5 cm) and diluted with an airflow of 17.7 L/min dry medical grade air. Limonene vapor was generated by passing nitrogen at ≈0.5 L/min through a 2-L glass thermostated flask at 30 °C with limonene (55 mL) and transferred upstream by a 1/4”-Teflon tube (84 cm) to a 500-mL flask at ambient temperature to trap condensed limonene before entering the reaction flow tube in a 1/8-inch Teflon tube (length 84 cm). The reaction flow tube was connected to a glass tube at the exposure chamber inlet and the total flow adjusted to 18.2 [±0.1] L/min in all experiments. This resulted in an ≈16 sec aged reaction mixture in the exposure chamber where >95% of ozone was consumed, leading to <0.03 ppm residual ozone in the reaction mixture reaching the exposure chamber.
All experiments were carried out at ≈27 °C, 1% relative humidity, and 21% O2 content. Limonene and ozone concentrations were monitored directly by a calibrated photoionization detector (ppbRAE, RAE systems Inc., San Jose, CA) and a photometric ozone analyzer (Model 400, API, Inc., San Diego, CA), respectively. In addition, limonene was sampled on Tenax TA 60–80 mesh adsorbent tubes (200 mg) using a sample volume of 50 mL (gas-tight syringe) and a sampling time of ≈ 30 sec. Two samples were taken twice during exposure in addition to samples of the background levels before and after exposure, respectively. Tubes were analyzed by thermal desorption–gas chromatography–mass spectrometry (TD–GC–MS) as described previously (Norgaard et al. 2014). We previously characterized similar limonene–ozone reaction mixtures and determined the levels of formaldehyde (Wolkoff et al. Citation2008).
Aerosol number size distribution spectra were measured by a Fast Mobility Particle Sizer (FMPS model 3091, TSI Inc., Shoreview, NM). The FMPS measures aerosols in the size range from 5.6–532 nm, with a time resolution of 1 sec. Sample air to the FMPS was diluted 1:10.
Exposure protocol
The experiment was performed as a 2 × 4 factorial design with animals allocated to 1) OVA or sham sensitization and 2) exposure to air (AIR), 2 ppm ozone (O3), 40 ppm limonene (LIM) or a mixture of ozone and limonene that forms ozone-initiated limonene reaction products (MIX). depicts the exposure protocol. Half the mice were sensitized subcutaneously (SC) with 1 μg OVA in 270 μg Al(OH)3 on Day 1 and received a SC booster with 0.1 μg OVA on Day 15 (in bolus of 0.1 mL 0.9% saline). On Days 23 and 26, these mice were placed in body plethysmographs and exposed head-out only to 1% OVA solution for 20 min. The other half of the mice went through sham procedures; sham-immunization with Al(OH)3 and 0.9% sterile saline and exposed to aerosols of saline. A blood sample was collected by facial vein puncture on Days 0 and 26. On Days 27, 28, and 29, the naïve and allergic mice were placed in body plethysmographs and exposed head-out for 60 min to airborne exposures (AIR, O3, LIM, or MIX). On Day 30, the mice were anaesthetized with ZRF cocktail. Blood was collected by heart puncture, bronchoalveolar lavage (BAL) of the whole lung was performed and the left lung was frozen at −80 °C.
Table 1. Exposure protocol and overview over statistical main effects, exposure groups and tissue/data collection.
Collection of respiratory parameters
Notocord Hem (Notocord Systems SA, Croissy-sur-Seine, France) data acquisition software was used to collect respiratory parameters. The acquisition program calculates for example the breathing frequency (breaths/min), tidal volume (VT, mL), time from end of inspiration until the beginning of expiration, termed time of brake (TB, ms) and time from end of expiration until beginning of the next inspiration, termed time of pause (TP, ms). Stimulation of the trigeminal and vagal nerve endings causes increases in TB and TP, which are markers of sensory and lower airway irritation, respectively. Rapid shallow breathing (RSB) is another reflex change in respiration due to pulmonary irritation. Comprehensive descriptions of the breathing parameters and their analyses have been made elsewhere (Alarie Citation1973; Vijayaraghavan et al. Citation1993; Nielsen et al. Citation1999).
Assessment of acute respiratory effects during airborne exposures
A short period was allowed for the animals to settle down and a stable baseline to be reached as recommended (ASTM Citation1984). Then, a 15-min baseline period was recorded for each mouse while inhaling laboratory air. The exposure period (20 min for allergen challenge and 60 min for airborne exposure) was followed by a 15-min recovery period in which the mice were exposed to laboratory air. To assess exposure-related effects, the respiratory parameters during exposure were compared to baseline levels, that is, each mouse served as its own control. For each mouse, mean values of each minute during the experiment were calculated. Airway irritation was evaluated during the airborne exposures on Days 27–29. For each mouse, the mean value of the 20–29 min and 51–60 min periods was calculated for the different respiratory parameters. Thus, individual means of the periods were used in the statistical analyses. This strategy was based on the expected effects of ozone and the reaction products on airway irritation (Nielsen et al., Citation1999; Clausen et al., Citation2001). The baseline values of the individual mice did not differ significantly on Day 27–29 (data not shown). To capture a potential cumulative effect, the data presented are from Day 29 only. Sensory irritation data from this mouse bioassay is highly predictive of sensory irritation in humans (Kuwabara et al. Citation2007; Schaper Citation1993).
Detection of OVA-specific antibodies in serum
Sera collected on Days 0, 26 and 30 were diluted 1:10, 1:300 and 1:300, respectively, and analyzed for OVA-specific IgE using an in-house enzyme-linked immunosorbent assay (ELISA). Day 30 serum was also diluted 1:2000 and analyzed for OVA-specific IgG1 using an in-house ELISA. Maxisorb microtiter plates (Nunc, Roskilde, DK) were coated with 2 μg/mL rat anti-mouse IgE (LO-ME-3) or rat anti-mouse IgG1 (LO-MG1-13) (both, Life Technologies, Carlsbad, CA) in 0.05 M carbonate/bicarbonate buffer [pH 9.6]), followed by incubation for 1 h at room temperature (RT) and thereafter at 4 °C overnight. After washing with wash buffer (50 mM Tris/HCl +0.05% Tween-20), the plates were blocked with 3% skimmed milk powder in Milli-Q water and incubated for 1 h at RT. After washing, 100 μL diluted sera was added into duplicate wells and the plates were incubated for 1 h at RT.
To assess IgE, wells were washed with buffer, 3 μg/mL biotin-conjugated OVA (Nordic Biosite, DK) was added, and the plates then incubated 1 h at RT. After another washing, poly-horseradish peroxidase (HRP)–streptavidin (Life Technologies; 1:40 000 dilution) was added to each well and the plates incubated for another 1 h at RT. To assess IgG1, the wells were washed, treated with 100 μL HRP-conjugated OVA (AbD Serotec, Oxford, UK; 1:300 dilution in wash buffer) and then incubated for 1 h at RT. After a final wash, all wells received 100 μL stabilized chromogen TMB (Thermo Fisher Scientific, Waltham, MA)/well and then were incubated for 15 min before addition of 50 μL 2M H2SO4 stop solution to each well. Optical density of all wells was then measured at 450 nm in an Epoch microplate reader (BioTek, Winooski, VT). Standard curves were generated from duplicates of diluted mouse antiovalbumin IgE (clone 2C6, AbD Serotec) or diluted OVA-specific IgG1 (antiovalbumin antibody [F2-3.58], Kerafast, Boston, MA) that had been included on each plate. From these curves, values of the levels of each antibody in a given sample were extrapolated. The detection limits of the ELISAs were 60 ng IgE/mL and 1250 ng IgG1/mL.
Evaluation of inflammation in bronchoalveolar lavage fluid (BALF)
BALF was collected by flushing the lungs three times each with 0.8 mL ice-cold saline solution. Cells from the pooled fluids were isolated by centrifugation (400 × g, 10 min, 4 °C), resuspended in 100 μL HAMF12 and the supernatant then placed at −80 °C for later analyses. The total number of cells [including live and dead; data not shown] was then determined using a Nucleocounter NC-900-004 (ChemoMetec, Allerød, Denmark). The collected cells were then spun onto cytospin slides that were then stained with May-Grünwald/Giemsa as described in Hansen et al. (Citation2013). Macrophages, lymphocytes, neutrophils and eosinophils were differentially counted using a light microscope. A total of 200 cells/slide was evaluated.
Surfactant protein D (SP-D) in BALF and serum
BALF supernatants were shipped from Copenhagen to Odense on dry ice. Measurement of SP-D levels were done using a sandwich ELISA as previously described (Hansen et al. Citation2008), taking advantage of mouse-specific monoclonal antibody. Sera were diluted 1:4 and BALF supernatants were diluted 1:50–1:500, depending on the SP-D concentrations present. Measures were carried out in triplicate. The detection limit of the ELISA was 5 ng SP-D/mL.
Lung tissue homogenization and determination of protein, HO-1 and cytokines
Lavaged lung tissues were homogenized according to Viscardi et al. (Citation2006). A sample of approximately 100 mg frozen lung tissue/mouse was homogenized in 700 μL of 150 mM NaCl/2 mM Tris [pH 7.5] solution containing 0.5% Triton-X and protease inhibitors (P8340, Sigma). All homogenized lysates were incubated at 4 °C for 15 min (with gentle rocking) and then centrifuged for 10 min (13 000 × g, 4 °C). The resulting supernatants were isolated and stored as aliquots at −20 °C until analysis. A BCA protein assay kit (Pierce, Rockford, IL) was used to assay protein content in the lysates and BALF.
Heme oxygenase-1 (HO-1) levels were measured with an ImmunoSet HO-1 (mouse) ELISA (Enzo Life Sciences, Farmingdale, NY) according to manufacturer instructions. In brief, wells were coated with capture antibody at RT overnight and washed with blocking buffer before standards and aliquots containing 100 μg lysate protein were transferred to each well. Following subsequent washes, wells were incubated with detection antibody and HRP conjugate. TMB substrate was added for color development that was stopped by addition of 1 M HCl. Background signal was determined by including a blank sample with just the assay buffer and the analysis was carried out in duplicate. All wells had their absorbance values measured at 450 nm in the Epoch microplate reader. The detection limit of the ELISA was 96 pg HO-1/mL.
Levels of interleukin (IL)-5, IL-10, tumor necrosis factor (TNF)-α and interferon (IFN)-γ were determined by analyzing the content in 100 μg lysate protein using a BD CBA Flex Set assay on a BD Accuri flow cytometer (BD Biosciences, San Jose, CA).
Statistical analyses
BALF cell data and some respiratory parameters were log-transformed to obtain homoscedasticity and normal distribution of the residuals. Data were analyzed by two-way analysis of variance (ANOVA) with sensitization (naïve, allergic) and airborne exposure (AIR, O3, LIM, MIX) as fixed factors (). A Tukey’s post hoc test was performed in cases when a significant main effect of airborne exposure or a significant interaction effect were found. In cases of a significant interaction, only relevant post hoc comparisons are shown in figures, that is, comparisons between the four allergic and four naive groups are not shown (e.g. naïve LIM compared with allergic AIR, LIM, MIX or O3 groups). A p value < 0.05 was considered statistically significant. Means ± SEM are shown in the figures if not otherwise noted. The means (M) of the compared groups are also given in the text when significant differences were seen.
Results
Characterization of aerosols and gases
The mean (± SD) air concentrations of the 1% OVA feeding solution was based on the gravimetric measurements calculated to 65 [± 8 mg] OVA/m3 air. We (Hansen et al. Citation2007) previously estimated that >50% of the inhaled OVA aerosol is deposited in the respiratory tract. This amounts to ≈47 μg OVA during the two OVA challenges (for calculation method, see Hansen et al. Citation2007).
For the groups of mice exposed to limonene or ozone alone, the concentrations were 40.0 [±2] and 2.0 [±0.3] ppm (mean ±95% CI), respectively. These were also used as initial concentrations for the MIX group where the residual limonene and ozone were measured to 34 [±2] and < 0.03 ppm, respectively. Particle number concentration (measured during the presence of mice) was; for pure air < 500 cm−3, but around 1000 cm−3 during ozone and limonene exposure. The number concentrations for the limonene–ozone reaction mixture varied slightly in the range 1.3–1.5 × 107 cm−3 during the exposure. By fitting log-normal distribution to the averaged number size distribution spectrum, a geometric mean particle size 29.3 nm with a geometric standard deviation (σg) of 1.43 was obtained.
Animal weights
Mean group weights of the mice did not differ at Day 1 and the sensitization procedures did not affect weight gain measured at Day 26 (range of group mean = 18.6–20.5 g). Due to the daily restraining from Days 26-29, mice lost 5.4% weight (range of group weight means on Day 30 = 17.5–19.4 g), but this was not significantly affected by either sensitization or airborne exposure.
Sensory irritation differed between naïve and allergic mice exposed to ozone and to the reaction mixture
The sensory irritation response at 20–29 min (indicated from specific marker TB elongation; ), was only significantly affected by airborne exposure (p = 0.035). A post hoc analysis of the group means revealed that only the AIR (M = 130%) and O3 (M = 186%) groups differed significantly (p = 0.035) (). Thus, ozone caused sensory irritation in both naïve and allergic mice, but the maximal response appeared to be reached faster in naïve compared to allergic mice. Although TB was elongated in the MIX groups compared to the AIR groups, this was not significant at 20–29 min ().
Figure 1. Effects on inhalation of air (AIR), ozone (O3), limonene (LIM) or limonene/O3 reaction products (MIX) on Day 29 in allergic and naïve mice. Mice were exposed to laboratory air during the 15 min baseline period, followed by 60 min of exposure to AIR, O3, LIM or MIX. Daily exposures were performed on Days 27–29. The respiratory parameter Time of brake is shown for AIR- and O3-exposed mice (A) and for AIR- and MIX-exposed mice (B). Tidal volume is shown for AIR- and O3-exposed mice (C). Mean values (n = 5 mice/group) of 1 min periods are shown. Statistical analyses are reported in the text.
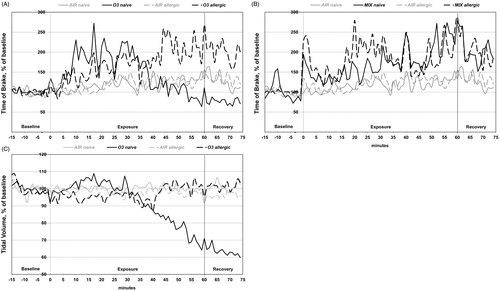
At 51–60 min, a significant interaction effect was found (p = 0.007) and all eight groups compared by post hoc testing. At this time point, sensory irritation had disappeared in naive O3 mice; thus, irritation differed significantly between naïve O3 (M = 93%) and allergic O3 (M = 208%) mice (, post hoc, p = 0.011). Also at 51–60 min, the sensory irritation was significantly larger in naïve MIX (M = 238%) mice compared with both naïve (M = 134%) and allergic (M = 128%) AIR animals (, post hoc naïve MIX vs. naïve AIR; p = 0.027). The allergic MIX (M = 213%) group did not differ significantly from the two AIR groups or from the naïve MIX group.
Lower airway irritation differed between naïve and allergic mice exposed to ozone
Pulmonary irritation may be observed from the RSB response characterized by an increase in breathing frequency and a decrease in VT. The LIM and MIX exposures did not induce pulmonary irritation as seen from the breathing frequency (Supplementary Figure 1(A)). At 20–29 min, an effect on VT was not observed in any of the groups (). Looking at VT at the end of the exposure period (51–60 min), a significant interaction effect was found (p = 0.001). Comparing the groups revealed that a reduction of VT was observed only in naïve O3 mice (, post hoc naïve O3 vs. all other groups, p < 0.05) indicating a shallow breathing pattern. The means of the groups in are: naïve O3 (M = 72%), allergic O3 (M = 101%), naïve AIR (M = 99%), allergic AIR (M = 96%). At the same time, the breathing frequency increased nonsignificantly with 14% relative to the AIR groups (Supplementary Figure 1(A)). TP, another marker of pulmonary irritation was not affected in any of the groups (Supplementary Figure 1(B)). The minute volume per gram body weight decreased mainly in the MIX and O3 groups (). The statistical analysis showed a significant main effect of airborne exposures during the exposure time 51–60 min, and post hoc analyses revealed that only the O3-exposed mice had significantly lower minute volume/gram compared to the AIR- and LIM-exposed mice.
Table 2. Effects on minute volume per gram on day 29 during the exposure period 51–60 min.
OVA-specific antibodies in serum
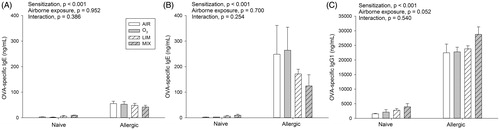
Before the primary sensitization, no OVA-specific IgE was detected in serum. Serum was collected before the last OVA challenge (Day 26) and at the end of the experiment (Day 30); there was a significant effect of sensitization at Day 26, where the M of naïve and allergic mice were 5 and 50 ng/mL, respectively () On Day 30, the group means of naïve (M = 5 ng/mL) and allergic (M = 202 ng/mL) mice also differed significantly (). IgE levels at Day 26 did not differ in the AIR, O3, LIM and MIX groups, indicating comparable immune responses in the groups before airborne exposures. The following 3 d of O3, LIM, or MIX exposures were without significant effects on OVA-specific IgE levels, although they appeared lower in the allergic LIM and MIX mice. OVA-specific IgG1 was only affected significantly by sensitization (), with mean values of 2606 and 24 459 ng/mL in naïve and allergic mice, respectively.
Figure 2. Naïve and allergic mice were exposed to AIR, O3, LIM or MIX for 60 min on Days 27–29. OVA-specific IgE was measured in serum (A) before (Day 26) and (B) after (Day 30) exposure. (C) Day 30 OVA-specific IgG1. Bars represent mean ± SEM of 5 mice/group. Results of two-way ANOVA are given above figures.
Allergic inflammation was reduced in particular by the ozone/limonene reaction mixture (MIX)
Whereas no inflammation was observed in the sham-sensitized mice, significantly higher numbers of macrophages (M = 119 339 vs. 214 892 cells; naïve vs. allergic, respectively), eosinophils (38 999 vs. 1 477 746 cells), lymphocytes (1887 vs. 78 754 cells) and neutrophils (1109 vs. 3684 cells) were observed in the allergic mice (, significant main effect of sensitization). A significant interaction effect was found for the total number of eosinophils; in allergic mice, numbers were significantly decreased by the MIX exposure (M = 863 484 cells) compared to the O3 exposure (1 919 820 cells) (). A significant main effect of airborne exposure was found for the number of lymphocytes and neutrophils, that is, in both naïve and allergic mice, MIX exposure (16 569 cells) reduced the numbers of lymphocytes (compared to LIM [58 905 cells] and O3 [47 025 cells], p = 0.04 and 0.032, respectively, ). The MIX exposures (M = 23 cells) also reduced neutrophil numbers (compared to AIR [4960 cells] and O3 [3784 cells], p = 0.013 and 0.023, respectively, ) in both allergic and naïve mice.
Figure 3. Naïve and allergic mice were exposed to AIR, O3, LIM and MIX for 60 min on Days 27–29 and total number of (A) eosinophils, (B) lymphocytes and (C) neutrophils in BALF analyzed on Day 30. (D) Protein levels in BALF and (E) IL-5 levels in lung homogenates on Day 30. Bars represent mean ± SEM of 5 mice/group. Results of two-way ANOVA are given above figures. Post hoc analyses of significant main and interaction effects are described in the text. *indicates a significant effect at p < 0.05.
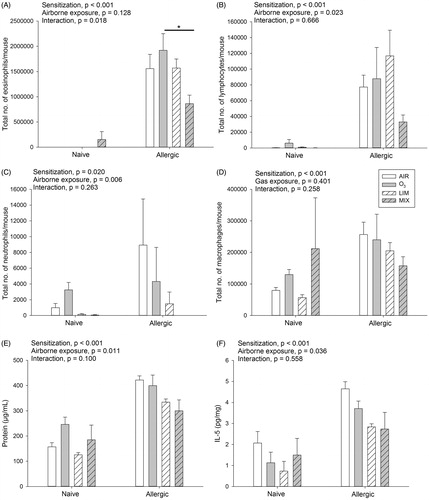
Elevated protein levels in BALF in allergic compared to naïve mice were in agreement with an increased inflammation, but these levels were also affected by the airborne exposures (). In both naïve and allergic mice, LIM (M = 230 μg/mL) and MIX (M = 242 μg/mL) exposures significantly reduced protein levels in comparison to those seen in the O3 group (M = 323 μg/mL) (p = 0.02 and p = 0.03, respectively).
Levels of TNFα, IFNγ and IL-10 in lung homogenates were not significantly affected (Supplementary ). However, IL-5 levels were significantly increased in allergic compared to naïve mice (M = 7.0 vs. 2.7 pg/mL, ). Further, post hoc analysis of the significant main effect of airborne exposure revealed that IL-5 levels in the LIM groups (M = 3.6 pg/mL) were reduced relative to those in the AIR groups (M = 6.7 pg/mL) (p = 0.029).
SP-D in BALF and serum and HO-1 in lung tissue homogenates
In their BALF, allergic mice had higher levels of SP-D than naïve mice (M = 4685 vs. 902 ng/mL, ). Post hoc analyses of the significant interaction effect revealed that in the allergic mice, the LIM (M = 2342 ng/mL) and MIX (M = 2312 ng/mL) groups had significantly lower SP-D levels compared to both the AIR (M = 2941 ng/mL) and O3 (M = 3405 ng/mL) groups. SP-D levels in serum were near the detection limit and no significant differences were observed (M = 6 ng/mL for both naïve and allergic mice).
Figure 4. Naïve and allergic mice were exposed to AIR, O3, LIM and MIX for 60 min on Days 27–29. Levels of (A) SP-D in BALF and (B) HO-1 in lung homogenate were measured on Day 30. Bars represent mean ± SEM of 5 mice/group. Results of two-way ANOVA are given above figures. Post hoc analyses of significant interaction effect in (A) is shown in figure by a * indicating a significant difference at p < 0.05.
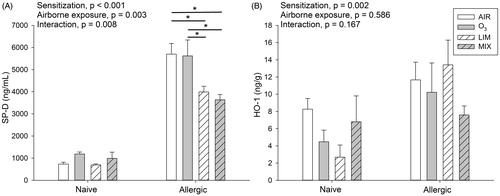
The levels of HO-1 were measured in lung homogenates as a marker of oxidative stress (Valacchi et al. Citation2004). The allergic mice had significantly increased levels of HO-1 compared to naïve mice (M = 10.7 vs. 5.6 ng/g) and this was independent of airborne exposure ().
Discussion
Effects of ozone and ozone–limonene reaction products on sensory/pulmonary irritation
In contrast to the current findings, ozone-induced sensory irritation has not been observed previously in mice (Nielsen et al. Citation1999). Ozone is generally not a potent sensory irritant as the threshold is 5 ppm for trigeminal nerve activation in rats (Kulle & Cooper Citation1975). Interestingly, sensory irritation persisted only in allergic O3-exposed mice. This indicates that the upper airways could be more susceptible to irritation due to the inflammatory condition. During the recovery period, the effect of ozone on TB slowly disappeared, suggesting that the sensory nerve activation is not due to a simple reversible receptor binding.
Because the ozone concentration was negligible in the MIX group (< 0.003 ppm), oxidation reaction products were not expected to be generated in the nasal mucosa. A major part of the irritation caused by the reaction mixture is due to formaldehyde, which is highly water soluble (Wolkoff et al. Citation2008). In the MIX groups, the sensory irritation was significant in naïve mice as previously reported (Clausen et al. Citation2001), but not in allergic mice. Further, the maximal TB elongation due to ozone appeared to occur faster in naïve compared to allergic mice. Overall, this suggests that increased mucus content of the airway (as expected in allergic mice (Larsen et al. Citation2010) may retard sensory irritants.
In contrast, allergic mice in the current study appeared to be protected from the pulmonary irritation response induced by ozone. We have previously shown a 50% reduction of VT (Nielsen et al. Citation1999) by 2 ppm ozone, which is in fair agreement with the 30–40% in the naïve mice in the present study. The sensory irritation response (TB) would later disappear or be masked by the occurrence of pulmonary effects in the naive mice. Thus, it may be speculated that airway inflammation protects the allergic mice from pulmonary irritation induced by ozone. We previously showed that sensory irritation of formaldehyde was more severe in naïve compared to allergic mice; this could be explained by a scavenging effect of the increased mucus layer in allergic airways (Larsen et al. Citation2013). Opposite to formaldehyde, ozone reaches the lower airways due to its low water solubility. However, in an analogy with the scavenging of formaldehyde by the nasal mucus, ozone may be scavenged by mucus in the inflamed airways. OVA-sensitized mice have more mucus (Larsen et al. Citation2010), which is supported by their higher BALF protein content. A study by Schelegle and Walby (Citation2012) indicated a more rapid onset of the VT decrease (and thus pulmonary irritation response) in naïve compared to allergic rats, which is in overall agreement with the current results, where only naïve mice had a decrease in VT during the 1-h exposure. After 2 h (out of a total of 8 h) of exposure to 1 ppm ozone, those investigators found the RSB response to be aggravated in allergic relative to naïve rats; therefore, prolonged exposure may be necessary to see an aggravating response in allergic animals.
In another study, C57Bl/6 mice were exposed for 1 h to 1 ppm ozone 3 h after an OVA challenge. Pulmonary measurements by intubation showed a decreased minute ventilation in allergic, but increased minute ventilation in control mice; this was interpreted as allergic mice being more sensitive to ozone (Yamauchi et al. Citation2002). We did not observe differences in minute ventilation between allergic and naïve O3 mice, but a decreased minute volume in both groups. The decrease in O3-exposed naïve mice could reflect occurrence of the RSB response, whereas the decrease in in allergic mice exposed to O3 was driven by sensory irritation, characterized by TB elongation, and thus, a decrease in respiratory frequency. The major differences between the Yamauchi study and the current one is that the latter used conscious spontaneously breathing mice in contrast to anaesthetized and intubated mice in the former. Furthermore, the outcome may depend on strain (Vancza et al. Citation2009; Wesselkamper et al. Citation2001). A recent review of chamber studies concludes that no differences in sensitivity were observed on FEV1 and airway resistance in asthmatic and healthy subjects exposed to up to 2 ppm ozone (Johansson et al. Citation2015), in agreement with the current study.
Effects of ozone and ozone/limonene reaction products on allergic airway inflammation
It was hypothesized that inhalation of ozone, limonene, and ozone-initiated limonene reaction products may aggravate or attenuate allergic airway inflammation. Our mouse asthma model exhibited classical features of airway allergy, such as elevated allergen-specific IgE, eosinophil-dominated inflammation and increased protein and IL-5 content in the lungs.
When allergic mice were exposed to 2 ppm ozone on three consecutive days, ozone did not aggravate allergen-specific antibody production or existing airway inflammation. In contrast, 4 h of exposure to 0.1 ppm ozone did not induce airway inflammation in itself, but did exacerbate eosinophilia, when preceding airway allergen challenge (Depuydt et al. Citation2002). Kierstein et al. (Citation2008) exposed Aspergillus-sensitized mice for 2 h to 3 ppm ozone 3 days after allergen challenge and found eosinophil numbers were elevated compared to air-exposed allergic mice, but other parameters did not differ from ozone-exposed naïve mice. Several weeks of repeated ozone/allergen (compared to air/allergen) exposure increased the anaphylaxis reactivity in Swiss-Webster mice with a dose–response relationship from 0.10 (no-observed effect level) to 0.24 ppm ozone (Osebold et al. Citation1988). Thus, some animal studies have demonstrated exacerbation of allergy under circumstances of extended ozone exposure. One human study showed that ozone inhalation increased sputum markers of inflammation in atopic subjects with asthma compared to in atopic subjects without asthma (Hernandez et al. Citation2010). However, only few controlled studies have demonstrated asthmatic subjects to be more sensitive in terms of inflammatory markers (Johansson et al. Citation2015).
Few animal studies have investigated airway effects of ozone–terpene oxidation products apart from sensory irritation. Sunil et al. (Citation2007) investigated pulmonary pathology in rats after 3 h of exposure to a mixture of 0.8 ppm ozone and 6 ppm limonene and found increased levels of TNFα and markers of oxidative stress, but no inflammatory cells in BALF. Although limonene levels were much lower than in the present study, all ozone is expected to be removed and the changes in biomarkers thus related to generation of reaction products. Rohr (Citation2001) found no pulmonary inflammation in mice after single or repeated exposures to reaction products from a mixture of 862 ppm isoprene and 3.23 ppm ozone. No airway inflammation was observed in mice after 10 days of repeated exposure to ozone-limonene reaction mixtures based on 52 ppm limonene and initial ozone concentrations of 0.5, 2.5 or 3.9 ppm (Wolkoff et al. Citation2012). The resulting residual ozone concentration was < 0.01 ppm ozone. The present study supports the above findings that the ozone-terpene reaction mixture does not induce inflammation in itself. Further, aggravation of allergic airway inflammation was not observed. A chamber study comparing subjects with or without asthma found a lower perceived nose and throat sensory irritation in asthmatic subjects, but not in the eyes, when exposed to ozone/limonene reaction products; however, other responses were inconclusive (Fadeyi et al. Citation2015).
Anti-inflammatory effects of limonene and ozone/limonene reaction products
Lastly, it was hypothesized limonene alone could have an alleviating effect on allergic inflammation. In murine splenocytes, limonene is suggested to have anti-inflammatory and T-helper cell (TH)-2-stimulating properties mainly via promoting IL-10 secretion (Ku & Lin Citation2013) and limonene has been shown to possess antioxidant properties (Fraternale et al. Citation2007; Roberto et al. Citation2010). However, dampening of inflammatory responses was more evident in the MIX compared to the LIM groups and in particular relative to the O3 mice. This could not be explained by differences in minute ventilation, because it did not differ between these groups. Limonene did not decrease cellular infiltration significantly, but decreased protein, IL-5 and SP-D. In contrast, inhalation of the reaction mixture decreased inflammatory cells, protein, and SP-D levels in the BALF. The tendency to lower IL-5 production supported the anti-inflammatory effects.
The observed low attenuation of cellular infiltration by limonene may require a larger group size or prolonged limonene exposure to detect significant effects. The Keinan group used 7–30 days of exposure to 125 ppm limonene to show decreases in peribronchial inflammation and BALF neutrophils in sensitized rats and BALB/c mice (Bibi et al. Citation2015; Keinan et al. Citation2005). Hirota et al. (Citation2012) used limonene inhalation exposures for 30 days concurrent with allergen sensitization of BALB/c mice and showed clear decreases in antibody production, airway inflammation and cytokine levels. Our previous subchronic inhalation study indicated an anti-inflammatory effect of limonene, but the ozone/limonene exposure most evidently decreased inflammation, although an IgE-promoting effect also was noted (Hansen et al. Citation2013). Limonene that has not reacted with ozone is still the dominating VOC present in the reaction mixture. Thus, the anti-inflammatory effect of the reaction mixture may be due not only to the excess limonene, but also due to other oxidation products.
Upregulation of pulmonary SP-D is linked to both chronic obstructive pulmonary disease and asthma (Sorensen et al. Citation2007). Post-translational modifications of SP-D occur due to reactive oxygen species (ROS) exposure, which enhances the pro-inflammatory signaling of SP-D (Ledford et al. Citation2014). Thus, the significantly lower content of SP-D in BALF of the allergic LIM and MIX mice may reflect lower requirement for protection against oxidative stress. Also, a feedback regulation between eosinophils and SP-D occurs in allergic inflammation (Ledford et al. Citation2014); this was reflected in particular in the MIX group in the present data set. Overall, this study supports SP-D as being a marker of oxidative stress and/or of immunomodulation.
In several cell and tissue models, HO-1 is upregulated in response to cellular stress (Ryter et al. Citation2006), including exposures to environmental pollutants such as ozone (Sunil et al. Citation2013; Valacchi et al. Citation2004), or when cytoprotective responses are required (Ryter et al. Citation2006). Therefore, HO-1 was selected to investigate whether antioxidant effects of limonene (and the reaction mixture) could be detected. However, HO-1 was not differentially expressed between the four airborne exposures. The regulation of HO-1 is biphasic and as a response to oxidative stress, HO-1 is upregulated within 6 h (Risom et al. Citation2003; Sunil et al. Citation2013). At later time points (including in the lung), HO-1 is involved in suppressing inflammation and initiating wound healing (Lee et al. Citation2009; Ryter et al. Citation2006), which may be the reason for a comparable upregulation in the groups of allergic mice.
The present study noted a trend of decreased OVA-specific IgE in the allergic LIM and MIX mice compared to in the AIR mice. IgG1 levels were unaffected by airborne exposures. Isotype switching to IgE occurs after IgG1, and thus, it may be speculated that local IgE production may be affected by ongoing allergic inflammation. In the allergic LIM and MIX mice, cytokine levels and inflammatory markers were dampened, which eventually may lead to less antigen being processed by antigen-presenting cells (Lambrecht & Hammad Citation2015). Whether local antioxidant treatment may lead to a reduction in antibody levels remains to be confirmed, but limonene inhalation concurrent with allergen exposure did decrease allergen-specific antibody levels in a mouse model of airway allergy (Hirota et al. Citation2012). Until now, the main focus of terpene–ozone reaction products has been in relation to adverse health effects. However, this study suggests that health effects may be more complex.
Conclusions
Ozone and ozone/limonene reaction products exposures caused significant sensory irritation, however, the reaction products only in naïve mice. Allergic compared to naive mice appeared more sensitive to upper airway irritation, but allergic mice were protected from the pulmonary irritation caused by ozone. This may be ascribed to a scavenging effect of the mucus in the airways. Surprisingly, the ozone-initiated reaction products were more potent in attenuating airway inflammation than limonene itself. Characterization of the mechanisms behind this requires further studies. Overall, airway allergic responses were not exacerbated by short-term exposure to the tested airway irritants. Our data on ozone exposure are in general agreement with human chamber studies not showing consistent differences between healthy and asthmatic subjects.
Declaration of interest
The authors declare no conflicts of interest. The authors alone are responsible for the content of this manuscript.
Funding information
The study was funded by Realdania under the project CISBO (Centre for Indoor Climate and Diseases in Dwellings). JBS was funded by Innovation Fund Denmark.
Supplementary Figures
Download PDF (435.1 KB)References
- Alarie Y. 1973. Sensory irritation by airborne chemicals. CRC Crit Rev Toxicol. 2:299–363.
- ASTM 1984. “Standard test method for estimating sensory irritancy of airborne chemicals”, designation: E981-94. Philadelphia: American Society of Testing and Materials.
- Bibi H, Reany O, Waisman, D, Keinan E. 2015. Prophylactic treatment of asthma by an ozone scavenger in a mouse model. Bioorg Med Chem Lett. 25:342–346.
- Canning BJ. 2002. Neurology of allergic inflammation and rhinitis. Curr Allergy Asthma Rep. 2:210–215.
- Carlsten C, Melen E. 2012. Air pollution, genetics, and allergy: An update. Curr Opin Allergy Clin Immunol. 12:455–460.
- Clausen PA, Wilkins CK, Wolkoff P, Nielsen GD. 2001. Chemical and biological evaluation of a reaction mixture of R-(+)-limonene/ozone: Formation of strong airway irritants. Environ Intl. 26:511–522.
- Depuydt PO, Lambrecht BN, Joos GF, Pauwels RA. 2002. Effect of ozone exposure on allergic sensitization and airway inflammation induced by dendritic cells. Clin Exp Allergy. 32:391–396.
- Fadeyi MO, Tham KW, Wu WY. 2015. Impact of asthma, exposure period, and filters on human responses during exposures to ozone and its initiated chemistry products. Indoor Air. 25:512–522.
- Fadeyi M. 2015. Ozone in indoor environments: Research progress in the past 15 years. Sustain Cit Soc. 18:78–94.
- Fraternale D, Giamperi L, Bucchini A, Ricci D. 2007. Essential oil composition and anti-oxidant activity of aerial parts of Grindelia robusta from Central Italy. Fitoterapia. 78:443–445.
- Hansen JS, Larsen ST, Poulsen LK, Nielsen GD. 2007. Does lipophilicity per se cause adjuvant effects? Methyl palmitate as model substance does not affect ovalbumin sensitization. J Toxicol Environ Health. 70:128–137.
- Hansen JS, Nielsen GD, Sorli JB, Clausen PA, Wolkoff P, Larsen ST. 2013. Adjuvant and inflammatory effects in mice after subchronic inhalation of allergen and ozone-initiated limonene reaction products. J Toxicol Environ Health. 76:1085–1095.
- Hansen S, Schmidt V, Steffensen MA, Jensen PH, Gjerstorff M, Thiel S, Holmskov U. 2008. An enzyme-linked immunosorbent assay (ELISA) for quantification of mouse surfactant protein D (SP-D). J Immunol Meth. 330:75–85.
- Hernandez ML, Lay JC, Harris B, Esther CR, Brickey WJ, Bromberg PA, Diaz-Sanchez D, Devlin RB, Kleeberger SR, Alexis NE, et al. 2010. Atopic asthmatic subjects but not atopic subjects without asthma have enhanced inflammatory response to ozone. J Allergy Clin Immunol. 126:537–544.
- Hirota R, Nakamura H, Bhatti SA, Ngatu NR, Muzembo BA, Dumavibhat N, Eitoku M, Sawamura M, Suganuma N. 2012. Limonene inhalation reduces allergic airway inflammation in Dermatophagoides farinae-treated mice. Inhal Toxicol. 24:373–381.
- Huang SK, Zhang Q, Qiu Z, Chung KF. 2015. Mechanistic impact of outdoor air pollution on asthma and allergic diseases. J Thorac Dis. 7:23–33.
- Johansson M, Johanson G, Öberg M. 2015. Evaluation of the experimental support for assess-ment factors to protect people with asthma during short-term exposure to airborne chemicals. Crit Rev Toxicol. 46:241–60.
- Keinan E, Alt A, Amir G, Bentur L, Bibi H, Shoseyov D. 2005. Natural ozone scavenger prevents asthma in sensitized rats. Bioorg Med Chem. 13:557–562.
- Kierstein S, Krytska K, Sharma S, Amrani Y, Salmon M, Panettieri RA, Jr., Zangrilli J, Haczku A. 2008. Ozone inhalation induces exacerbation of eosinophilic airway inflammation and hyper-responsiveness in allergen-sensitized mice. Allergy. 63:438–446.
- Ku CM, Lin JY. 2013. Anti-inflammatory effects of 27 selected terpenoid compounds tested through modulating TH1/TH2 cytokine secretion profiles using murine primary splenocytes. Food Chem. 141:1104–1113.
- Kulle TJ, Cooper GP. 1975. Effects of formaldehyde and ozone on the trigeminal nasal sensory system. Arch Environ Health. 30:237–243.
- Kumar RK, Herbert C, Foster PS. 2008. The “classical” ovalbumin challenge model of asthma in mice. Curr Drug Targets. 9:485–494.
- Kuwabara Y, Alexeeff GV, Broadwin R, Salmon AG. 2007. Evaluation and application of the RD50 for determining acceptable exposure levels of airborne sensory irritants for the general public. Environ Health Perspect. 115:1609–1616.
- Lambrecht BN, Hammad H. 2015. The immunology of asthma. Nat Immunol. 16:45–56.
- Larsen ST, Matsubara S, McConville G, Poulsen SS, Gelfand EW. 2010. Ozone increases airway hyper-reactivity and mucus hyper-production in mice previously exposed to allergen. J Toxicol Environ Health. 73:738–747.
- Larsen ST, Wolkoff P, Hammer M, Kofoed-Sorensen V, Clausen PA, Nielsen GD. 2013. Acute airway effects of airborne formaldehyde in sensitized and non-sensitized mice housed in a dry or humid environment. Toxicol Appl Pharmacol. 268:294–299.
- Ledford JG, Addison KJ, Foster MW, Que LG. 2014. Eosinophil-associated lung diseases. A cry for surfactant proteins A and D help? Am J Respir Cell Mol Biol. 51:604–614.
- Lee IT, Luo SF, Lee CW, Wang SW, Lin CC, Chang CC, Chen YL, Chau LY, Yang CM. 2009. Over-expression of HO-1 protects against TNFα-mediated airway inflammation by down-regulation of TNFR1-dependent oxidative stress. Am J Pathol. 175:519–532.
- Lee LY, Widdicombe JG. 2001. Modulation of airway sensitivity to inhaled irritants: Role of inflammatory mediators. Environ Health Perspect. 109:585–589.
- Nazaroff WW, Weschler CJ. 2004. Cleaning products and air fresheners: Exposure to primary and secondary air pollutants. Atmos Environ. 38:2841–2865.
- Nielsen GD, Hougaard KS, Larsen ST, Hammer M, Wolkoff P, Clausen PA, Wilkins CK, Alarie Y. 1999. Acute airway effects of formaldehyde and ozone in BALB/c mice. Human Exp Toxicol. 18:400–409.
- Nørgaard AW, Kudal JD, Kofoed-Sorensen V, Koponen IK, Wolkoff P. 2014. Ozone-initiated VOC and particle emissions from a cleaning agent and an air freshener: Risk assessment of acute airway effects. Environ Intl. 68:209–218.
- Nurmatov UB, Tagiyeva N, Semple S, Devereux G, Sheikh A. 2015. Volatile organic compounds and risk of asthma and allergy: A systematic review. Eur Respir Rev. 24:92–101.
- Osebold JW, Zee YC, Gershwin LJ. 1988. Enhancement of allergic lung sensitization in mice by ozone inhalation. Proc Soc Exp Biol Med. 188:259–264.
- Peel JL, Tolbert PE, Klein M, Metzger KB, Flanders WD, Todd K, Mulholland JA, Ryan PB, Frumkin H. 2005. Ambient air pollution and respiratory emergency department visits. Epidemiology. 16:164–174.
- Risom L, Moller P, Vogel U, Kristjansen PE, Loft S. 2003. X-Ray-induced oxidative stress: DNA damage and gene expression of HO-1, ERCC1 and OGG1 in mouse lung. Free Radic Res. 37:957–966.
- Roberto D, Micucci P, Sebastian T, Graciela F, Anesini C. 2010. Anti-oxidant activity of limonene on normal murine lymphocytes: Relation to H2O2 modulation and cell proliferation. Basic Clin Pharmacol Toxicol. 106:38–44.
- Rohr AC. 2001. Effects of terpene/ozone reaction products on the murine respiratory system. Doctor of Science dissertation, Harvard University School of Public Health.
- Rohr AC, Wilkins CK, Clausen PA, Hammer M, Nielsen GD, Wolkoff P, Spengler JD. 2002. Upper airway and pulmonary effects of oxidation products of (+)-α-pinene, d-limonene, and isoprene in BALB/c mice. Inhal Toxicol. 14:663–684.
- Ryter SW, Alam J, Choi AM. 2006. Heme oxygenase-1/carbon monoxide: from basic science to therapeutic applications. Physiol Rev. 86:583–650.
- Schaper M. 1993. Development of a database for sensory irritants and its use in establishing occupational exposure limits. Am Ind Hyg Assoc J. 54:488–544.
- Schelegle ES, and Walby WF. 2012. Vagal afferents contribute to exacerbated airway responses following ozone and allergen challenge. Respir Physiol Neurobiol. 181:277–285.
- Silverman RA, Ito K. 2010. Age-related association of fine particles and ozone with severe acute asthma in New York City. J Allergy Clin Immunol. 125:367–373.
- Sorensen GL, Husby S, Holmskov U. 2007. Surfactant protein A and surfactant protein D variation in pulmonary disease. Immunobiology. 212:381–416.
- Sunil VR, Laumbach RJ, Patel KJ, Turpin BJ, Lim HJ, Kipen HM, Laskin JD, Laskin DL. 2007. Pulmonary effects of inhaled limonene ozone reaction products in elderly rats. Toxicol Appl Pharmacol. 222:211–220.
- Sunil VR, Vayas KN, Massa CB, Gow AJ, Laskin JD, Laskin DL. 2013. Ozone-induced injury and oxidative stress in bronchiolar epithelium are associated with altered pulmonary mechanics. Toxicol Sci. 133:309–319.
- Thurston GD, Lippmann M, Scott MB, Fine JM. 1997. Summertime haze air pollution and children with asthma. Am J Respir Crit Care Med. 155:654–660.
- Trantalidi M, Dimitroulopoulou C, Wolkoff P, Kephalopoulos S, Carrer P. 2015. EPHECT III: health risk assessment of exposure to household consumer products. Sci Total Environ. 536:903–913.
- Valacchi G, Pagnin E, Corbacho AM, Olano E, Davis PA, Packer L, Cross CE. 2004. In vivo ozone exposure induces anti-oxidant/stress-related responses in murine lung and skin. Free Radic Biol Med. 36:673–681.
- Vancza EM, Galdanes K, Gunnison A, Hatch G, Gordon T. 2009. Age, strain, and gender as factors for increased sensitivity of the mouse lung to inhaled ozone. Toxicol Sci. 107:535–543.
- Vijayaraghavan, R, Schaper, M, Thompson R, Stock MF, Alarie Y. 1993. Characteristic modifications of the breathing pattern of mice to evaluate the effects of airborne chemicals on the respiratory tract. Arch Toxicol. 67:478–490.
- Viscardi RM, Atamas SP, Luzina IG, Hasday JD, He JR, Sime PJ, Coalson JJ, Yoder BA. 2006. Antenatal Ureaplasma urealyticum respiratory tract infection stimulates pro-inflammatory, pro-fibrotic responses in the preterm baboon lung. Pediatr Res. 60:141–146.
- Wesselkamper S, Chen LC, Kleeberger SR, Gordon T. 2001. Genetic variability in the development of pulmonary tolerance to inhaled pollutants in inbred mice. Am J Physiol. 281:L1200–L1209.
- Wolkoff P, Clausen PA, Larsen K, Hammer M, Larsen ST, Nielsen GD. 2008. Acute airway effects of ozone-initiated d-limonene chemistry: Importance of gaseous products. Toxicol Lett. 181:171–176.
- Wolkoff P, Clausen PA, Larsen ST, Hammer M, Nielsen GD. 2012. Airway effects of repeated exposures to ozone-initiated limonene oxidation products as model of indoor air mixtures. Toxicol Lett. 209:166–172.
- Wolkoff P, Larsen ST, Hammer M, Kofoed-Sorensen V, Clausen PA, Nielsen GD. 2013. Human reference values for acute airway effects of five common ozone-initiated terpene reaction products in indoor air. Toxicol Lett. 216:54–64.
- Xing H, Ling JX, Chen M, Johnson RD, Tominaga M, Wang CY, Gu J. 2008. TRPM8 mechanism of autonomic nerve response to cold in respiratory airway. Mol Pain. 4:22.
- Yamauchi T, Shima M, Kuwaki T, Ando M, Ohmichi M, Fukuda Y, Adachi M. 2002. Acute effects of ozone exposure on lung function in mice sensitized to ovalbumin. Toxicology. 172:69–78.