
Abstract
The impact of agrichemicals on aquatic vertebrate species has been a matter of increasing concern to researchers and environmentalist. The present study aimed to evaluate the effect of atrazine (ATZ), a worldwide used herbicide, on some immune parameters of red-eared slider (Trachemys scripta). Twenty-four turtles (2 years old) were randomly distributed in four groups. Three groups were intraperitoneally injected once with one of three different doses of atrazine (0.01, 0.1 or 1.0 ng/g body mass), while one was maintained as control (saline injected). Blood samples were taken 1- and 2-week post-treatment. A positive correlation was found between atrazine (high dose) concentration and immunosuppressive effects as evidenced by lowered serum complement and lysozyme activities, reduced leucocyte number as well as their phagocytic activity and increased heterophil/lymphocyte ratio. These data demonstrate that turtles with elevated atrazine exposure exhibit immunomodulation.
Introduction
Atrazine (2-chloro-4-ethythlamino-6-isopropylamine-1,3,5-tiazine) is a commonly used herbicide (Hayes et al. Citation2002; Murphy Citation2005). Atrazine does not degrade significantly in groundwater and surface water and has a half-life of >200 days – 2 years (ATSDR Citation2003). Emerging research indicates that lower concentrations of atrazine can cause more damage to organisms than can higher concentrations (Crews et al. Citation2000; Hayes et al. Citation2002; Storrs & Kiesecker Citation2004; Propper Citation2005). While a lot of atrazine research has focused on amphibians and fish, little is known about the effects of atrazine on other wild vertebrates, such as reptiles (Solomon et al. Citation2008; Rohr & McCoy Citation2010). This is surprising given that many reptile species are highly aquatic, use habitats near agricultural areas, are carnivores or scavengers, and are long-lived (Hopkins Citation2000; Moll & Moll Citation2004).
Atrazine has been demonstrated to be immunotoxic in animal models (Rowe et al. Citation2006). Acute exposures to atrazine induced short-lived significant decreases in the numbers of hematopoietic progenitors in murine bone marrow (Mencoboni et al. Citation1992). Atrazine has also been implicated in immunosuppression in a variety of models, that is, salamanders were made more susceptible to viruses (Forson & Storfer Citation2006a,Citationb), rats had decreased antibody responses (Rooney et al. Citation2003), innate immune responses were reduced in frogs (Brodkin et al. Citation2007; Houck & Sessions Citation2006), and genes that regulate immune function were down-regulated in tadpoles (Langerveld et al. Citation2009).
Recent reviews have highlighted a need for more information regarding the immunotoxicity of atrazine to turtle in light of the lack of information in reptiles, but notable immunotoxic effects in other aquatic organisms (Rohr & McCoy Citation2010; Solomon et al. Citation2008). Thus, the purpose of the current study was to investigate effects of atrazine on the immune system of reptiles. It was hypothesized that exposure of red-eared slider turtles to increasing concentrations of atrazine would correlate with a decrease in host immunocompetence, reflected in several non-specific immune responses including heterophil/lymphocyte ratios, peripheral blood leukocyte numbers and phagocytic activity, as well as in serum lysozyme and hemolytic complement activities.
Materials and methods
Experimental design
The experiment was performed on ≈2-year-old captive-raised Trachemys scripta hatch-lings with a mean body weight of 125.5 [± 14.2] g. Turtles were randomly divided into 60-L tanks (three turtles/tank) held at an average [water] temperature of 27 ± 2 °C with a natural light cycle. Two replicate tanks were used per treatment. Basking platforms were provided in the tanks for the turtles. Water temperature was monitored daily and turtles were fed pelleted rainbow trout food three times a week.
In these experiments, T. scripta hatchlings were allocated randomly into four experimental groups (n = 6/group). Three of the groups were treated once with a single intraperitoneal (IP) injection of ATZ (PESTANAL®, analytical standard; Sigma, St. Louis, MO). Use of the IP injection rather than simply applying the ATZ into the tank water allowed for optimal control of each turtle’s true exposure. For example, dermal absorption could not be controlled nor could any agent uptake from small ingestions of tank water, etc. Use of the IP route allowed for optimal control of total dosage; IP injection is a common route of drug delivery, exclusively used for experimental purposes with laboratory animals (small) and affords an ability to generate accurate convenient dosing (with minimal stress to host) with reproducible results.
The ATZ concentrations employed here were: Treatment 1 (ATZ 1) = 1 ng/g body mass, Treatment 2 (ATZ 0.1) = 0.1 ng/g body mass and Treatment 3 (ATZ 0.01) = 0.01 ng/g body mass. These concentrations were chosen to reflect a range of environmentally relevant concentrations (Graymore et al. Citation2001; Hayes et al. Citation2002; de Solla et al. Citation2006). As a negative control, the fourth group of turtles received vehicle (saline) only. All turtles were routinely monitored for any outward signs of overt toxicity from the treatment (e.g. including any increases in mortality, abnormal behavior, abnormal swimming patterns, anorexia or other clinical signs of diseases). All the procedures involving the animals were reviewed and approved by the Institutional Research Ethics Committee of the School of Veterinary Medicine of Shiraz University.
Blood collection
All turtles were sampled for blood 1- and 2-week post-treatment. Samples were collected from the subcarapacial vein using a 2-mL syringe and a 24-G needle from all six turtles in each sample group. One sample of blood sample was collected into heparinized Eppendorf tubes (10 parts blood: 1 part heparin [1 mg/mL]), while the other was collected into a tube without anticoagulant and allowed to clot for 2 h at room temperature. The clot was then cut with a glass rod and care taken not to hemolyze it. The tubes were then placed at 4 °C overnight, centrifuged at 2500 × g for 15 min, and the supernatant serum collected. Serum was stored at −20 °C until use.
Blood leukocyte numbers and ratios
Blood samples from the heparinized tube were analyzed for numbers of leukocytes and evaluation of heterophil/lymphocyte ratio (HLR). Determination of total number of leukocytes was performed using a Neubauer chamber. For this, an aliquot of whole blood was diluted 1:200 with 0.6% NaCl (w/v) solution (Siroski et al. Citation2016) that acted as a red cell lysing agent without interfering with leukocyte integrity. For the differential leukocyte counts, two smears on glass slides were prepared/animal, air-dried, fixed with absolute methanol, and stained with May Grunwald–Giemsa solution. Heterophils and lymphocytes were differentiated [out of 300 cells counted at a 1000X magnification]/slide and the HLR calculated for each turtle.
Phagocytic activity ex vivo
The ex vivo phagocytic activity of whole blood cells was analyzed using commercial Baker’s yeast, Saccharomyces cerevisiae, as an indicator according to Zhou et al. (Citation2002). Dried live yeast was incubated in 2% sucrose solution (pH 3–4) for 2 h at 30 °C and boiled for 30 min. The yeast was then centrifuged and the pellet washed twice and re-suspended in 0.85% saline (at 2 × 10⁸ cell/mL). An aliquot [20 μL] of suspension as well as 40 μL heparinized whole blood was then added to a 0.1-mL Eppendorf tube and the mixture incubated at 30 °C for 30 min with gentle shaking. After this period, smears were prepared and the air-dried slides then stained with Wright–Giemsa stain. Phagocytic activity (PA) was determined by evaluating 100 phagocytes per slide using a light microscope. A minimum of three slides/turtle was evaluated. The mean PA was calculated as: 100% × [Number of phagocytic cells with engulfed yeast cells/Number of phagocytes counted].
Serum lysozyme activity
Serum lysozyme activity was determined using the method of Jian and Wu (Citation2004). In brief, a suspension of an overnight grown Micrococcus lysodeikticus was prepared by dissolving 20 mg M. lysodeikticus in 100 mL of 67 mM phosphate buffer (pH 6.4). For the assay, 100 μL serum was added to a 3 mL suspension of M. lysodeikticus and the mixture incubated at 25 °C. At timepoints of 0.5 and 4.5 min, the absorbance of the sample was measured at 540 nm in a Biophotometer UV-visible spectrophotometer (Eppendorf, Stevenage, UK). One unit of activity was defined as the amount of lysozyme producing a decrease in absorbance of 0.001/min.
Serum hemolytic complement assay
Serum complement activity was determined by the method of sheep red blood cells (SRBC) hemolysis following the protocol of Siroski et al. (Citation2016). In brief, SRBC were obtained from heparinized whole blood collected from healthy sheep reared at the Veterinary School of Shiraz University. The blood was centrifuged at 3000 × g and the plasma discarded. The SRBC were resuspended in phosphate-buffered saline (PBS, pH 7.4) and centrifuged at 3000 × g. The SRBC were then diluted to 2% (v/v) in PBS. Turtle serum was then incubated with an equal volume of 2% SRBC (v/v) for 30 min at 25 °C for 5 min. Thereafter, the sample was centrifuged at 2500 × g for 5 min and then 300 μL of supernatant was recovered to permit measures of optical density in a PowerWave XS2 microplate reader at 540 nm (BioTek, Winooski, VT). As a positive control, 2 μL Triton X-100 was added to 1 mL of a 1% SRBC suspension and repeatedly homogenized until complete hemolysis was achieved (considered maximum hemolysis [MH]). The results of hemolysis of SRBC in each experiment were divided by the absorbance of the positive control to obtain the maximum percentage of hemolysis (% MH) and results expressed as mean % MH.
Statistical analysis
Data are presented as means ± SD. Immune parameters were analyzed by one-way analysis of variance (ANOVA) and a Tukey’s multiple comparison range. All statistical analyses were tested at the 0.05 level of probability, using the SPSS 16.0 for Windows software (SPSS, Chicago, IL).
Results
Over the course of the post-exposure periods, all turtles were examined for any signs of overt toxicities. These included any increases in mortality, abnormal behavior, abnormal swimming patterns, anorexia, or other clinical signs of diseases. At both timepoints, no overt manifestations of these types were noted in the test animals. No overt toxicities were even noted in a subset of animals followed for up to 1 mo. post-exposure (data not shown).
Total leukocyte analyses showed that control turtles had higher values than those exposed to the pesticide, but these differences were statistically significant only against turtles that had the ATZ 1 treatment (). Values for the control turtles were 3.36 [± 0.37] × 103/μL and 3.21 [± 0.39] × 103/μL at the 1- and 2-week post-exposure timepoints, respectively. None of the ATZ treatments led to significant changes from these values at 1-week post-exposure, but the ATZ 1 regimen did induce a significant reduction to 2.28 [± 0.53] × 103/μL at 2-week post-exposure. Overall, there did appear to be a dose-trend relationship for the outcomes.
Figure 1. Total leukocyte counts. Turtles were injected once with different concentrations of atrazine and assayed on Day 7 and 14 post-treatment. Bars shown are mean ± SD (n = 6/group). (L-R: Control, ATZ 1.0, ATZ 0.1, ATZ 0.01). *Value significant from control or ‡from all other ATZ doses (p < 0.05).
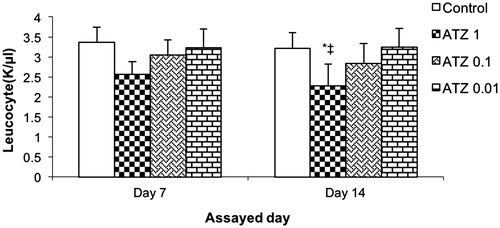
Figure 2. Heterophil/lymphocyte ratios (HLR). Turtles were injected once with different concentrations of atrazine and assayed on Day 7 and 14 post-treatment. Bars shown are mean ± SD (n = 6/group). (L-R: Control, ATZ 1.0, ATZ 0.1, ATZ 0.01). *Value significant from control or ‡from all other ATZ doses (p < 0.05).
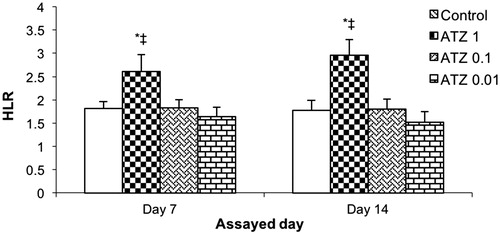
With regard to H/L indices, values for the control turtles were 1.80 [± 0.15] and 1.77 [± 0.20] at the 1- and 2-week post-exposure timepoints, respectively (). The ATZ 1 regimen induced a significant increase to 2.61 [± 0.35] and 2.95 [± 0.33] at 1- and 2-week post-exposure, respectively. Overall, there did appear to be a dose-trend relationship for the outcomes. The two other ATZ doses had no significant effect on this endpoint at either post-exposure timepoint.
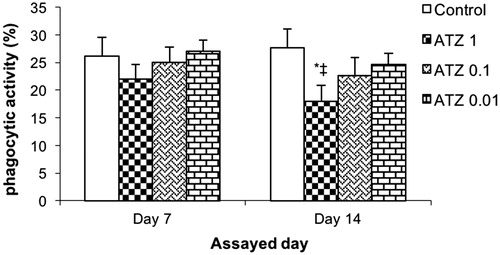
The percentage of ex vivo phagocytic activity was also affected by treatment of the turtles with the highest ATZ dose used here (). Values for the control turtles were 26.2 [± 3.4] % and 27.7 [± 3.4] % at 1- and 2-week post-exposure, respectively. None of the ATZ treatments led to significant changes from these values at 1-week post-exposure, but the ATZ 1 regimen did induce a significant reduction to 18.0 [± 2.9]% at 2-week post-exposure. The two other ATZ doses had no significant effect on this endpoint at either post-exposure timepoint.
Figure 3. Ex vivo phagocytic activity of leukocyte. Turtles were injected once with different concentrations of atrazine and assayed on Day 7 and 14 post-treatment. Bars shown are mean ± SD (n = 6/group). (L-R: Control, ATZ 1.0, ATZ 0.1, ATZ 0.01). *Value significant from control or ‡from lowest ATZ dose (p < 0.05).
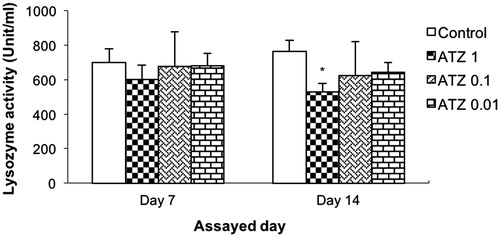
A similar pattern of effects was also noted with regard to lysozyme activity (). Values for control turtles were 698.3 [± 79.4] U/mL and 764.3 [± 63.1] U/mL at 1- and 2-week post-exposure, respectively. None of the ATZ treatments led to significant changes from these values at 1-week post-exposure. However, the ATZ 1 and ATZ 0.1 regimens did induce significant reductions to, respectively, 528.5 [± 51.3] U/mL and 622.5 [± 50.0] U/mL at 2-week post-exposure.
Figure 4. Serum lysozyme activity. Turtles were injected once with different concentrations of atrazine and assayed on Day 7 and 14 post- treatment. Bars shown are mean ± SD (n = 6/group). (L-R: Control, ATZ 1.0, ATZ 0.1, ATZ 0.01). *Value significant from control (p < 0.05).
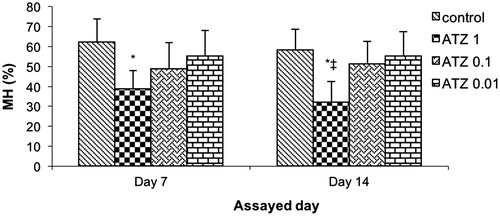
SRBC were used to characterize complement activity in the blood of T. script exposed to different ATZ concentrations. ATZ exposure reduced complement activity in all treatments; however, this reduction was statistically significant only with the animals of ATZ 1 treatment (). In this treatment, hemolytic activity was significantly reduced from 62.3 [± 11.5]% to 38.6 [± 9.2]% and from 58.3 [± 10.3]% to 32 [± 10.5]%, respectively, at 1- and 2-week post-exposure. The two other ATZ doses had no significant effect on this endpoint at either timepoint.
Figure 5. Serum complement activity – expressed as percentage of maximal sheep red blood cells hemolysis (% MH). Turtles were injected once with different concentrations of atrazine (ATZ 1, ATZ 0.1 and ATZ 0.01) and assayed on Day 7 and 14 post-treatment. Bars shown are mean ± SD (n = 6/group). (L-R: Control, ATZ 1.0, ATZ 0.1, ATZ 0.01). *Value significant from control or ‡from lowest ATZ dose (p < 0.05).
Discussion
Wildlife immunotoxicology is quite new, and studies examining reptiles have been started to become more common in the last decade (Keller et al. Citation2006). Recent studies have shown that some pesticides are immunotoxic, triggering disease emergence and severity in exposed organisms (Carter & Goodman Citation2015; Chen et al. Citation2011; Colosio et al. Citation1999; Forson & Storfer Citation2006a,Citationb; Gantress et al. Citation2003; Gray et al. Citation2009; Keller et al. Citation2005; Kerby & Storfer Citation2009; Kiesecker Citation2002; Kreutz et al. Citation2010; Polakiewicz & Goodman Citation2013). Among the various potential reptiles for study, turtles have long been considered excellent sentinel species in toxicology research due to their long lifespan, generalist feeding behavior, widespread distribution, occupation of diverse habitats and non-migratory habits (Lamb et al. Citation1995; Sparling et al. Citation2010).
Hematologic investigations in wildlife are important as they can reflect the overall health condition of the local populations (Gilbertson et al. Citation2003). In the current study, exposure to ATZ induced a decrease in the total leucocyte number in turtles, with the lowest leucocyte count observed at the highest ATZ concentration (ATZ1 treatment). Likewise, atrazine exposure induced a significant reduction in peripheral leukocyte number in the tiger salamander, Ambystoma tigrinum (Forson & Storfer Citation2006a,Citationb; Kerby & Storfer Citation2009). Moreover, exposure to glyphosate (Roundup®) induced a decrease in the total leukocyte counts in newborn broad snouted caiman (Caiman latirostris) (Siroski et al. Citation2016). In a similar study in red-eared slider turtles, total white blood cell (WBC) counts were negatively correlated with concentrations of total PCBs and Arochlor 1260 (Yu et al. Citation2012). Conversely, a study on loggerhead sea turtles reported that estimated WBC was positively correlated with levels of total PCBs and total TCDD-like PCBs, respectively (Keller et al. Citation2004). Thus, a variety of widely used pesticides clearly have shown a potential to impact upon the leukocyte status of a variety of potential sentinel species, including turtles.
An increase in the heterophil/lymphocyte (H/L) index is a common response to stress caused by different factors, especially in birds and reptiles (Latorre et al. Citation2013). In the present study, the H/L index was significantly higher in the animals from the group exposed to highest concentration of atrazine (ATZ1 treatment) compared to those from the control, suggesting that pesticide exposure induced a state of stress. Similar results were reported in newborn broad snouted caiman exposed to glyphosate (Latorre et al. Citation2013). Likewise, a positive correlation was found between H/L ratio and the concentration of total PCBs and total TCDD-like PCBs in loggerhead sea turtles (Keller et al. Citation2004b). Furthermore, green turtles (Chelonia mydas) with fibro-papillomas showed a significant increase in H/L ratios that positively correlated with increases in their blood corticosterone levels (Aguirre et al. Citation1995), providing further evidence of the impact of chronic stress on reptilian immune parameters (Aguirre et al. Citation1995). Merchant et al. (Citation2006) reported that the American alligator (Alligator mississippiensis) injected with bacterial lipopolysaccharides had an increase in H/L index.
Phagocytosis and killing activity by macrophages is an important defence mechanism against pathogenic bacteria (Rao et al. Citation2006). In the present study, high-dose treatment with ATZ significantly impaired phagocytic activity. Likewise, atrazine exposure of silver catfish (Rhamdia quelen) caused decreased phagocytosis (Kreutz et al. Citation2010) but failed to do so in the common carp (Cossarini Dunier et al. Citation1987; Cossarini-Dunier & Hattenberger Citation1988). Moreover, a lindane bath of Nile tilapia reduced phagocytic activity (Khalaf-Allah Citation1999). In another study in crimson-spotted rainbow fish (Melanotaenia fluviatilis), golden perch (Macquaria ambigua) and Murray cod (Maccullochella peelii), leukocytes had decreased phagocytic activity after endosulfan treatment (Harford et al. Citation2005).
Various types of lysozyme have been isolated from several reptilian species (reviewed in Zimmerman et al. [Citation2010]). Circulating lysozyme is a marker of pro-inflammatory responses, has antibacterial functions, and is a measure of innate immunity (Burton et al. Citation2002; Weeks et al. Citation1992). In the current work, lysozyme activity was affected by atrazine exposure, significantly reduced in ATZ1 treatment. Likewise, a significant reduction in lysozyme activity was observed in silver catfish (Rhamdia quelen) after 10 days exposure to a sublethal concentration of atrazine (Kreutz et al. Citation2010). In loggerhead sea turtles (Caretta caretta), serum lysozyme activity was positively correlated with brevetoxin concentrations measured in the blood of rescued turtles that suffered a red tide toxin exposure (Walsh et al. Citation2010). Conversely, in the same species, lysozyme activity was significantly but negatively correlated with whole blood concentrations of organochlorine (OC). Although the mechanism of altered lysozyme activity is not understood, the data suggested heterophil function might be affected in different ways after exposure to contaminants (Yu et al. Citation2012).
In the present study, a positive correlation was also found between ATZ concentration and inhibition of complement activity in the red-eared sliders. The highest herbicide level (i.e., ATZ1 treatment) resulted in the greatest inhibition. This was along the lines of findings in a previous study showed that newborn broad snouted caimans (Caiman latirostris) exposed to glyphosate presented with decreased responses by their complement systems (Siroski et al. Citation2016). In addition, a dysregulation of C3 complement and its mRNA levels was noted in the kidney, spleen, and plasma of the common carp (C. carpio) exposed acutely to chlorpyrifos (Li et al. Citation2013). On the other hand, in silver catfish (Rhamdia quelen), no effect on natural complement hemolytic activity was observed even after 10 days exposure to a sub-lethal concentration of atrazine (Kreutz et al. Citation2010). Therefore, activity of complement system could be used as an indicator of toxicities induced by a variety of pesticides and, potentially, by other environmental factors. However, a wide range of endpoints would still clearly need to be evaluated to substantiate the characterization of any agent as immunotoxic.
In the end, while most of the above-noted studies in fish, caiman, reptiles, amphibians, etc. were conducted under controlled environmental conditions, it would not necessarily be a great leap to believe such changes also occur in the wild. However, this must assume of course, that equivalent doses (either by direct exposure or through consumption of bioconcentrated materials in lower organisms in food chain) of any of the given pesticides were attainable by the wild hosts. To date, there are no published population studies/other data to suggest that environmental contaminants, specifically atrazine, are associated with declines in populations of reptiles - or specifically of slider turtles. It thus remains uncertain if the induced immune system-related modulations noted here actually occur in the wild. Such studies are warranted.
Conclusion
The fact that environmentally relevant exposure to atrazine was positively correlated with a level of immunosuppression in laboratory red-eared slider turtles provides evidence that turtles with elevated atrazine exposure likely undergo immunomodulation and hence might be become more susceptible to infection and increasing mortality in the wild. While there is no direct evidence that turtle immunosuppression in the wild has had an impact, that is, on population size (Solomon et al. Citation2008) and health issues (Sparling et al. Citation2010), the issue itself has yet to be investigated. Overall, further studies are needed to understand the real effect of environmental contaminants on turtle species, including the red-eared slider as well as other reptiles that could serve as sentinels. This is due, in great part, to the fact that most of the data pertaining to immunotoxic effects of environmental contaminants come from studies with invertebrates, fish, and/or amphibians.
Funding information
This work was supported by the Aquatic Animal Health & Diseases Department, School of Veterinary Medicine at Shiraz University [Grant number: 94GRD1M154665].
Acknowledgements
The author also expresses sincere thanks to M.S. Fereidouni for his kind cooperation and technical assistance throughout the studies.
Disclosure statement
The author declares no conflicts of interest. The author alone is responsible for the content of this manuscript.
Related Research Data
References
- ATSDR (Agency for Toxic Substances and Disease Registry). 2003. Chemical and physical information on atrazine. Atlanta (GA): US Department of Health and Human Services, Public Health Services.
- Aguirre AA, Balazs GH, Spraker TR, Gross TS. 1995. Adrenal and hematological responses to stress in juvenile green turtles (Chelonia mydas) with and without papillomas. Physiol Zool. 68:831–854.
- Brodkin MA, Madhoun H, Rameswaran, M. Vatnick I. 2007. Atrazine is immune disruptor in adult Northern leopard frogs (Rana pipiens). Environ Toxicol Chem. 26:80–84.
- Burton JE, Dorociak IR, Schwedler TE, Rice CD. 2002. Circulating lysozyme and hepatic CYP1A activities during chronic dietary exposure to tributyltin (TBT) and 3,3´,4,4´,5-pentachlorobiphenyl (PCB-126) mixtures in channel catfish Ictalurus punctatus. J Toxicol Environ Health. 65:589–602.
- Carter ED, Goodman RM. 2015. Effects of chemical pollutants and an emerging infectious disease on juvenile red-eared slider turtles (Trachemys scripta elegans). The Hampden-Sydney College Journal of the Sciences. Volume IV.
- Chen G, and Robert J. 2011. Anti-viral immunity in amphibians. Viruses. 3:2065–2086.
- Colosio C, Corsini E, Barcellini W, Maroni M. 1999. Immune parameters in biological monitoring of pesticide exposure: Current knowledge and perspectives. Toxicol Lett. 108:285–295.
- Cossarini-Dunier M. 1987. Effects of the pesticides atrazine and lindane and of manganese ions on cellular immunity of carp, Cyprinus carpio. J Fish Biol. 31:67–73.
- Cossarini-Dunier M, Hattenberger AM. 1988. Effect of pesticides (atrazine and lindane) on the replication of spring viremia of carp virus in vitro. Ann Res Vet Med. 19:209–211.
- Crews D, Willingham E, Skipper JK. 2000. Endocrine disruptors: Present issues, future directions. Q Rev Biol. 75:243–260.
- de Solla S, Martin P, Fernie K, Park B, Mayne G. 2006. Effects of environmentally relevant concentrations of atrazine on gonadal development in snapping turtles (Chelydra serpentina). Environ Toxicol Chem. 25:520–526.
- Forson D, Storfer AS. 2006a. Atrazine increases ranavirus susceptibility in the tiger salamander, Ambystoma tigrinum. Ecol Appl. 6:2325–2332.
- Forson D, Storfer AS. 2006b. Effects of atrazine and iridovirus infection on survival and life history characteristics in long-toed salamanders, Ambystoma macrodactylum. Environ Toxicol Chem. 25:168–173.
- Gantress J, Maniero GD, Cohen N, Robert J. 2003. Development and characterization of a model system to study amphibian immune responses to iridoviruses. Virology. 311:254–262.
- Gilbertson MK, Haffner G, Drouillard GD, Albert A, Dixon B. 2003. Immunosuppression in Northern leopard frog (Rana pipiens) induced by pesticide exposure. Environ Toxicol Chem. 22:101–110.
- Gray MJ, Miller DL, Hoverman JT. 2009. Ecology and pathology of amphibian Ranaviruses. Dis Aquat Org. 87:243–266.
- Graymore M, Stagnitti F, Allinson G. 2001. Impacts of atrazine in aquatic ecosystems. Environ Intl. 26:483–495.
- Harford AJ, O’Halloran K, Wright PF. 2005. The effects of in vitro pesticide exposures on the phagocytic function of four native Australian freshwater fish. Aquat Toxicol. 75:330–342.
- Hayes TB, Collins A, Lee M, Mendoza M, Noriega N, Stuart AA, Vonk A. 2002. Hermaphroditic de-masculinized frogs after exposure to herbicide atrazine at low ecologically relevant doses. Proc Natl Acad Sci USA. 99:5476–5480.
- Hopkins WA. 2000. Reptile toxicology: Challenges and opportunities on the last frontier in vertebrate ecotoxicology. Environ Toxicol Chem. 19:2391–2393.
- Houck A, Sessions SK. 2006. Could atrazine affect the immune system of the frog, Rana pipiens? Biosphere. 77:107–112.
- Jian J, Wu Z. 2004. Influence of traditional Chinese medicine on non-specific immunity of giant Carp (Cyprinus carpio var. giant). Fish Shellfish Immunol. 16:185–191.
- Keller JM, Kucklick JR, McClellan-Green PD. 2004. Organochlorine contaminants in logger-head sea turtle blood: Extraction techniques and distribution among plasma and red blood cells. Arch Environ Contam Toxicol. 46:254–264.
- Keller JM, Peden-Adams MM, Alonso Aguirre A. 2005. Immunotoxicology and implications for reptilian health. In: Gardner SC and Oberdörster E, editors. Toxicology of reptiles, new perspectives: toxicology and the environment. Boca Raton, FL: Taylor and Francis, pp. 199–240.
- Keller JM, McClellan-Green PD, Kucklick JR, Keil DE, Peden-Adams MM. 2006. Effects of organochlorine contaminants on loggerhead sea turtle immunity: Comparison of correlative field study and in vitro exposure experiments. Environ Health Perspect. 114:70–76.
- Kerby JL, Storfer A. 2009. Combined effects of atrazine and chlorpyrifos on susceptibility of the tiger salamander to Ambystoma tigrinum virus. Eco Health. 6:91–98.
- Khalaf-Allah S. 1999. Effect of pesticide water pollution on some hematological, biochemical, and immunological parameters in Tilapia nilotica fish. Deutsch Tierarztl. Wochenschr, 106:67–71.
- Kiesecker JM. 2002. Synergism between trematode infection and pesticide exposure: A link to amphibian limb deformities in nature? Proc Natl Acad Sci USA. 99:9900–9904.
- Kreutz LC, Barcellos LJ, Marteninghe A, Dos Santos ED, Zanatta R. 2010. Exposure to sublethal concentration of glyphosate or atrazine-based herbicides alters the phagocytic function and increases the susceptibility of silver catfish fingerlings (Rhamdia quelen) to Aeromonas hydrophila challenge. Fish Shellfish Immunol. 29:694–697.
- Lamb T, Bickham, JW, Lyne TB, Gibbons JW. 1995. Slider turtle as an environmental sentinel: multiple tissues assay using flow cytometric analysis. Ecotoxicology. 4:5–14.
- Langerveld AJ, Celestine R, Zaya R, Mihalko D, Ide CF. 2009. Chronic exposure to high levels of atrazine alters expression of genes that regulate immune and growth-related functions in developing Xenopus laevis tadpoles. Environ Res. 109:379–389.
- Latorre MA, Gonzalez EC, Larriera A, Poletta GL, Siroski PA. 2013. Effects of in vivo exposure to roundup on immune system of Caiman latirostris. J Immunotoxicol. 10:349–354.
- Li X, Liu L, Zhang Y, Fang Q, Li Y. 2013. Toxic effects of chlorpyrifos on lysozyme activities, contents of complement C3 and IgM, and IgM and complement C3 expression in common carp (Cyprinus carpio L.). Chemosphere. 93:428–433.
- Mencoboni M, Lerza R, Bogliolo G, Flego G, Pannacciulli I. 1992. Effect of atrazine on hematopoietic system. In Vivo. 6:41–44.
- Merchant ME, Mills K, Williams S, Kleckley F, Sims A, Elsey RM, Bushnell J. 2006. Effects of bacterial lipoolysaccharide on peripheral leukocytes in the American alligator (Alligator mississippiensis). Vet Immunol Immunopathol. 111:315–320.
- Moll D, Moll E, editors. 2004. The ecology, exploitation, and conservation of river turtles. New York: Oxford University Press.
- Murphy M. 2005. Atrazine banned in EU, but safe in U.S. Chem Ind. 3:10.
- Polakiewicz FJ, Goodman RM. 2013. The effects of environmental stressors and the pathogen Ranavirus on survival and health of juvenile freshwater turtles. The Hampden-Sydney College Journal of the Sciences. Volume II.
- Propper C. 2005. The study of endocrine-disrupting compounds: Past approaches and new directions. Integr Comp Biol. 45:194–200.
- Rao Y., Das B, Jyotyrmayee P, Chakrabarti R. 2006. Effect of Achyranthes aspera on the immunity and survival of Labeo rohita infected with Aeromonas hydrophila. Fish Shellfish Immunol. 20:263–273.
- Rohr JR, McCoy KA. 2010. A qualitative meta-analysis reveals consistent effects of atrazine on freshwater fish and amphibians. Environ Health Perspect. 118:20–32.
- Rooney AA, Matulka RA, Luebke RW. 2003. Developmental atrazine exposure suppresses immune function in male, but not female Sprague-Dawley Rats. Toxicol Sci. 76:366–375.
- Rowe AM, Brundage KM, Schafer R, Barnett JB. 2006. Immunomodulatory effects of maternal atrazine exposure on male Balb/c mice. Toxicol Appl Pharmacol. 214:69–77.
- Siroski PA, Poletta GL, Latorre MA, Merchant ME, Ortega HH, Mudry MD. 2016. Immuno-toxicity of commercial-mixed glyphosate in broad snouted caiman (Caiman latirostris). Chem Biol Interact. 244:64–70.
- Solomon KR, Carr JA., Du Preez LH, Giesy JP, Kendall RJ, Smith EE, van der Kraak GJ. 2008. Effects of atrazine on fish, amphibians, and aquatic reptiles: A critical review. Crit Rev Toxicol. 38:721–772.
- Sparling DW, Linder G, Bishop CA, Krest SK, editors. 2010. Recent advancements in amphibian and reptile ecotoxicology. In: Ecotoxicology of amphibians and reptiles, 2nd ed. Pensacola (FL): SETAC Press, pp. 1–11.
- Storrs SI, Kiesecker JM. 2004. Survivorship patterns of larval amphibians exposed to low concentrations of atrazine. Environ Health Perspect. 112:1054–1057.
- Walsh CJ, Leggett SR, Carter BJ, Colle C. 2010. Effects of brevetoxin exposure on the immune system of loggerhead sea turtles. Aquat Toxicol. 97:293–303.
- Weeks BA, Anderson DP, Du Four AP, Fairbrother A, Goven AJ, Lahvis, GP, Peters G. 1992. Immunological biomarkers to assess environmental stress. In: Huggett RJ, Kimerle RA, Mehrle, PM, Bergman HL, editors. Biomarkers: Biochemical, physiological, and histological markers of anthropogenic stress. London: Lewis Publishers, pp. 211–234.
- Yu S, Halbrook RS, Sparling DW. 2012. Accumulation of polychlorinated biphenyls (PCBs) and evaluation of hematological and immunological effects of PCBs exposure on turtles. Bull Environ Contam Toxicol. 88:823–827.
- Zhou X, Niu C, Sun R, Li Q. 2002. Effect of Vitamin C on non-specific immune response of juvenile soft-shelled turtle Trionyx sinensis. Comp Biochem Physiol. 131A:917–922.
- Zimmerman LM, Vogel LA, Bowden RM. 2010. Commentary understanding the vertebrate immune system: Insights from the reptilian perspective. J Exp Biol. 213:661–671.