
Abstract
The indoor pollutant hexabromocyclododecane (HBCD) has been added as flame retardant to many consumer products but detaches and accumulates in house dust. Inhalation of house dust leads to exposure to house dust mite (HDM) allergens in the presence of HBCD. Activation of dendritic cells is crucial in the sensitization to HDM allergens. The current study examined whether exposure to HBCD affected activation/maturation of HDM-exposed human dendritic cells (DC). Human monocyte-derived DC (moDC) were exposed simultaneously to HDM and a concentration range of HBCD (0.1–20 μM) in vitro. HDM exposure of moDC induced expression of co-stimulatory molecule CD80 and production of pro-inflammatory cytokines interleukin (IL)-6, IL-8, and tumor necrosis factor (TNF)-α. However, simultaneous exposure of moDC to HBCD and HDM enhanced the expression of antigen presenting molecule HLA-DR, co-stimulatory molecule CD86 and pro-inflammatory cytokine IL-8 depending on the dose of HBCD. Our results indicate that simultaneous exposure of HDM and HBCD can enhance the antigen presentation and maturation/activation of DC.
Introduction
The sharp increase in many inflammatory diseases, like allergic disorders and auto-immune diseases, over the past 60 years has resulted in many studies aiming to elucidate the risk factors in our changed life style and hygiene status. The underlying mechanism for these immune system disorders is multiple and complex (Eder et al. Citation2006; Beasley et al. Citation2015). One of the most common allergies is induced by allergens from the house dust mite (HDM). During the past decades, flame retardants (FR) have become a major indoor pollutant which leaches from the products into house dust. Although inhalation of house dust was determined as one of the routes of human exposure to FR (Abdallah et al. Citation2008), the possible effect of these chemicals in the immunological health of the respiratory system remains to be established. Epidemiological studies have revealed a possible association between exposure to indoor pollutants such as phthalates and development of asthma (Jaakkola & Knight Citation2008; Hulin et al. Citation2012; Patelarou et al. Citation2015).
The mucosal immune system is continuously exposed to inhaled antigens and provides protection against invaders by moderating appropriate humoral and cellular immune responses. Airway dendritic cells (DC) play a crucial role as antigen presenting cells in the initiation of an appropriate immune response to inhaled antigens. DC are able to recognize antigens via several pathways. Certain pathogen associated molecular patterns (PAMP) can be recognized through pattern recognition receptors (PRR) such as Toll-like receptors (TLR). Activation of PRR triggers phenotypic changes and functional maturation of DC (Willart & Hammad Citation2010; Dzopalic et al. Citation2012). Mature DCs acquire up-regulation of MHC (major histocompatibility complex) class II molecules (HLA-DR, human leukocyte antigen-D related), co-stimulatory molecules and pro-inflammatory cytokine production which are required to interact and differentiate naïve T-cells into a specific subset of effector T-cells (Iwasaki & Kelsall Citation1999; Dzopalic et al. Citation2012).
Differentiation and activation of T-cells depend on several factors including the type and dose of antigen, type of DC involved in the interaction with the naive T-cells, expression pattern of co-stimulatory molecules on the DC surface and secretion pattern of pro-inflammatory cytokines by DC (Hammad et al. Citation2001; Hubo et al. Citation2013; Froidure et al. Citation2016). In HDM allergy, an aberrant T-helper 2 (TH2) cell response is induced against a harmless protein derived from the HDM feces (Lambrecht & Hammad Citation2003, Citation2009). This response is designed to fight extracellular pathogens, like parasites (Allen & Sutherland Citation2014). The underlying mechanism in the misinterpretation of the allergen by the immune system has not yet been elucidated (Maes et al. Citation2010). Remarkably, DCs derived from peripheral blood monocytes from allergic patients have been shown to preferentially up-regulate co-stimulatory molecules CD86 and CD83, and produce cytokines interleukin (IL)-6 and tumor necrosis factor (TNF)-α after incubation with Der p 1, a major allergen of HDM. Co-culture of DC with autologous T-cells resulted in increased IL-4 production by autologous T-cells derived from HDM-sensitized patients while no effect on interferon (IFN)-γ production was observed, indicating this phenotype favored a TH2 response. In contrast, DC derived from healthy donors up-regulated CD80 and produced a lesser extent of IL-6 and TNFα, but did not induce IL-4 production by autologous T-cells – yet significantly increased IFNγ production – outcomes associated with a TH1 response (Hammad et al. Citation2001).
In the study reported here, it was hypothesized that the presence of the FR hexabromocyclodedecane (HBCD) might affect activation and phenotype of DC while processing HDM allergens. Our laboratories recently showed that in vitro exposure of bone marrow-derived murine DC (BMDC) to HBCD and HDM increased production of IL-6 and IL-10. Adoptive transfer of these DC into the airways of naïve mice promoted development of a TH17 cell response after inhalation of HDM, while direct exposure of airways to HDM and HBCD enhanced either TH17 or TH2 cell responses – depending on strength of the HDM stimulus (Canbaz et al. Citation2016). However, no study has investigated the potential effect of HBCD on skewing human DC towards a pro-inflammatory phenotype in response to HDM allergens.
Materials and methods
Generation of human monocyte-derived DC from peripheral blood
Peripheral blood mononuclear cells (PBMC) from seven healthy male volunteers (from Academic Medical Center, Amsterdam, the Netherlands, see ) were isolated from freshly drawn peripheral blood using density centrifugation over Lymphoprep (Axis-Shield PoC AS, Oslo, Norway). Subsequently, monocytes were isolated by Percoll (GE Healthcare, Zeist, the Netherlands) gradient (34%, 47.5% and 60% of standard isotonic Percoll) separation. Monocytes were plated in 24-well flat-bottom culture plates (Corning Inc., Corning, NY) at 5 × 10⁵ cells/well and purified by a 45-min adherence step by incubation at 37 °C in 5% CO2. To differentiate monocytes into immature dendritic cells (moDC), cells were further cultured in Iscove's Modified Dulbecco's Medium (IMDM, Gibco Life Technologies, Paisley, UK)/5% fetal bovine serum (FBS Gold, PAA, Pasching, Austria) supplemented with 50 μg/ml gentamicin (Gibco), in the presence of 50 ng/ml recombinant human granulocyte-macrophage colony-stimulating factor (GM-CSF, R&D Systems, Minneapolis, MN) and 10 U/ml IL-4 (Sanquin, Amsterdam, the Netherlands) for 6 days with a refreshing of the cell culture medium at Day 3 (de Jong et al. Citation2002).
Table 1. Donor characteristics.
In vitro exposure of moDC with HBCD
On Day 6, moDC were exposed for 24 h to 0, 0.1, 1, 10 or 20 μM HBCD (Technical mixture from Dead Sea Bromine Group, Beer-Sheva, Israel) with or without 80 μg (protein) of HDM extract/ml, containing 1 μg Der p 1/ml, a cysteine protease and one of the major allergens of Dermatophagoides pteronyssinus HDM (12.3 EU/mg dry weight, XPB82D3A2.5, Greer Laboratories; Lenoir, NC). Since HBCD was dissolved in DMSO, controls contained 0.1% DMSO to match the final concentration achieved in the culture medium.
moDC surface marker analysis
At the end of the exposure (i.e. Day 7), moDC were harvested, washed in FACS buffer (0.25% BSA, 0.05% sodium azide, 0.5 mM EDTA), and stained for 30 min at 4 °C in 96-well plates with 45 μl FACS buffer/well containing specific fluorochrome-conjugated monoclonal antibodies for cell surface markers (at manufacturer recommended concentration for staining). The antibodies employed were: anti-human Alexa 700-conjugated anti-CD3 (eBioscience Inc., San Diego, CA), allophycocyanin-Cyanine 7 (APC-Cy7)-anti-HLA-DR, fluorescein isothiocyanate (FITC)-anti-CD80, phycoerythrin (PE)-anti-CD86, PE-Cy7-anti-CD40 (BD Biosciences, San Jose, CA) and APC-conjugated anti-CD83 (Invitrogen, Carlsbad, CA). Flow cytometry was then performed using a FACS CANTO II (BD Biosciences) and all data was analyzed with FlowJo software (Tree Star, Ashland, OR). In the assays, moDC were identified as forward scatterlow, side-scatterhigh CD3-/HLA-DR+ expressing CD83, CD80, CD86 or CD40. The geometric mean (GM) of the mean fluorescent intensity (MFI) of HLA-DR, CD83, CD80, CD86 and CD40 staining was determined. Two microgram propidium iodide/ml (PI, Sigma, St. Louis, MO) was added to distinguish between living (PI-) and dead (PI+) cells. In all cases, a minimum of 10 000 events/sample was acquired.
Cytokine production assay
On Day 6, moDC were harvested from 24-well cell culture plates, washed three times in IMDM supplemented with 1% FBS, and seeded at a density of 3.5 × 10⁴ cells/well in IMDM/5% FBS in 96-well plates. Cells were then exposed to HBCD (0, 0.1, 1, 10 or 20 μM) ± HDM or DMSO as a control for 24 h. Two of the seven volunteers did not yield sufficient cells to perform the assay with 0.1, 1, 10 and 20 μM HBCD without HDM; for all other condition samples from the seven volunteers could be used. Each exposure was performed in triplicate. IL-6, IL-8, TNFα, IL-10 and IL-12 production by the moDC was determined by evaluation of the culture supernatant using commercial ELISA kits, according to manufacturer instructions (PeliKine compact ELISA kit, Sanquin, Amsterdam, the Netherlands or Ready-SET-Go ELISA kit, eBioscience, San Diego, CA). The level of sensitivity of the kits was 0.2 pg IL-6/ml, 1.0 pg IL-8/ml, 1.0 pg TNFα/ml, 2.0 pg IL-10/ml and 4.0 pg IL-12/ml.
Statistical analysis
All experiments were performed with PBMC from seven volunteers (except where noted above). Conditions for a normal distribution were not met because of the limited number of samples. Therefore, all outcomes were rank transformed prior to the analysis. Per outcome, a linear mixed effect model (repeated analysis of variance [ANOVA]) was used to estimate the effects of HDM, dose (categorical) and their interaction, assuming a compound symmetry covariance structure to correct for relatedness of the samples. To correct for the eight parameters tested, a Bonferroni corrected significance threshold of 0.006 (0.05/8) was used for the overall effect. In case of a significant outcome (except for IL-8), a Wilcoxon signed rank test for matched pairs was applied for comparison of experimental exposure versus control exposure of moDC from the same volunteer. For IL-8, the repeated ANOVA analysis did not reach significance after the Bonferroni correction (after correction p = 0.007). However, a Wilcoxon signed rank test was performed for IL-8 because correlation analysis (Spearman) showed significant correlations with HLA-DR, CD80, IL-6 and TNFα, indicating the Bonferroni correction was too strict. All analyses were carried out using IBM SPSS Statistics 22 software (IBM Corp., Armonk, NY).
Throughout all graphs the same symbol is used for each donor (). Differences were considered significant at a p value <0.05 for Wilcoxon signed rank test.
Results
HDM increases CD80 expression and cytokine production
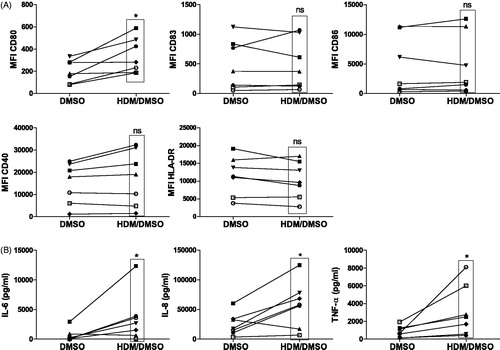
Monocyte-derived DC from seven healthy volunteers (donor characteristics in ) were exposed to HDM extract for 24 h and analyzed for expression of phenotypic cell surface markers (co-stimulatory molecules) and cytokine production, each involved in T-helper cell differentiation. Exposure of the isolated cells to HDM (HDM/DMSO) increased significantly the expression of the co-stimulatory molecule CD80 and not of CD83, CD86, CD40 and, HLA-DR (antigen-presenting molecule) compared with that by untreated (DMSO) controls in samples from all volunteers (). In addition to increased expression of CD80, HDM induced production of pro-inflammatory IL-6 (5/7 volunteers), TNFα (7/7) and IL-8 by the moDC (6/7) (). Exposure to DMSO did not affect HDM induced maturation of the DC (data not shown). Despite great variability in the strength of the MFI signal of individual membrane markers, the overall phenotype of the untreated (DMSO) DC between donors was similar. Individual histograms of all markers of each donor at baseline (DMSO) are shown in Supplementary Figure 1 [S1].
Figure 1. Activation of moDC after 24-h exposure to HDM/DMSO or DMSO control. (A) Expression of co-stimulatory molecules CD80, CD83, CD86 and CD40 as well as the antigen-presenting molecule HLA-DR. Mean fluorescence intensity (MFI) for each co-stimulatory molecule and HLA-DR is indicated for all individual donors/experimental condition. (B) Production of pro-inflammatory IL-6, IL-8 and TNFα by moDC. *p < 0.05 vs. DMSO-exposed moDC. NS: not significant.
Effects of HBCD exposure on moDC phenotypes
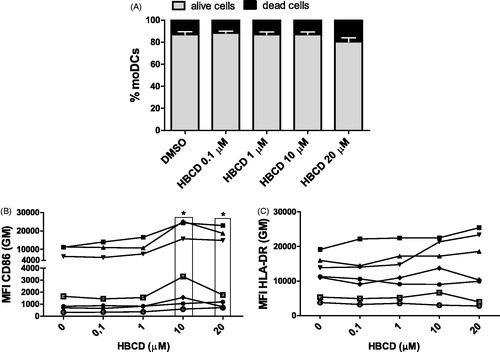
Next, we examined whether exposure of moDC to HBCD affected the expression of the phenotypic cell surface markers which are essential for antigen presentation or T-cell instruction. Cultured moDC were exposed to incremental concentrations of HBCD (0–20 μM) in the absence of HDM. Exposure of moDC to all concentrations of HBCD (0.1–20 μM) had no significant effect on cell viability as compared to the control DMSO (). Interestingly, exposure of moDC to HBCD enhanced significantly the expression of CD86 at concentrations of 10 and 20 μM compared to the solvent DMSO-exposed moDC with samples from all volunteers (7/7), whereas exposure of the DC to HBCD at lower concentrations did not induce a significant effect (). In addition, at 10 μM and 20 μM HBCD, the percentage of CD86+ HBCD was increased, although the outcome with 20 μM did not reach significance (10 μM p = 0.018 and 20 μM p = 0.063; Supplementary Figure 2 [S2]). Neither expression of CD80, CD83, CD40 or HLA-DR, nor the percentages of CD80-, CD83-, CD40-positive DC were enhanced by HBCD ( and data not shown).
Figure 2. Cell viability and phenotypic cell markers were measured after 24 h exposure of cultured moDC to HBCD (0.1–20 μM) and compared with DMSO control. (A) Percentages of alive (PI−) and dead (PI+) moDC. Data are presented as means ± SEM. No significant differences in viability seen between HBCD- and DMSO-exposed moDC. Expression of (B) CD86 or (C) HLA-DR on moDC. *p < 0.05 vs. control (0 μM).
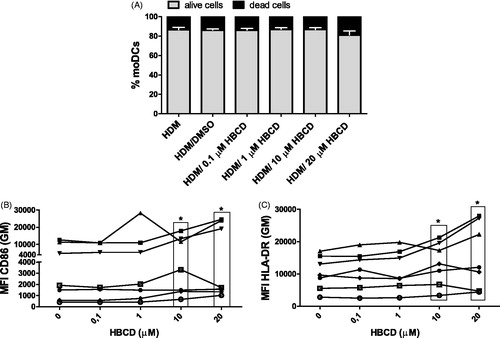
After simultaneous exposure to HBCD (0.1–20 μM) and HDM, the viability of cells was not affected. Further, expression of CD86 was increased with an exposure to 10 or 20 μM HBCD (cells of 6/7 volunteers) compared with that by HDM/DMSO-exposed moDC (as seen with HBCD alone; ). In addition, exposure to 10 or 20 μM HBCD remarkably enhanced expression of HLA-DR on HDM-exposed moDC (7/7 cases) compared to that by HDM/DMSO-exposed moDC (). The HBCD dose-effect on the increase in CD86 expression was similar in moDC exposed to HDM or not (p = 0.308). Besides an increase in the expression, the percentage of CD86+ DC was also increased with 10 μM HBCD (p = 0.018) but not 20 μM HBCD (p = 0.091; Supplementary Figure 2 [S2]). Simultaneous exposure to HDM and HBCD did not affect expression of CD80, CD83, or CD40 or the percentage of positive DC, compared with those seen among HDM/DMSO-exposed moDC (data not shown).
Figure 3. Cell viability and phenotypic cell markers were measured after 24 h simultaneous exposure of cultured moDC to HDM and HBCD (0.1–20 μM) and compared with HDM/DMSO-exposed control cells. (A) Percentages of alive (PI−) and dead (PI+) moDCs. Data are presented as means ± SEM. No significant differences in viability are seen between HDM/HBCD- and HDM/DMSO-exposed moDC. Expression of (B) CD86 or (C) HLA-DR on the moDC. *p < 0.05 vs. control (0 μM).
Effects of HBCD exposure on cytokine production by moDC
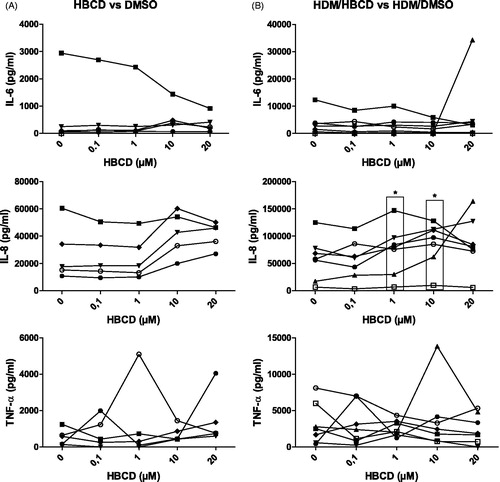
After exposure of moDC to incremental concentrations of HBCD (0–20 μM) in the presence or absence of HDM, the level of pro-inflammatory cytokine production was analyzed in the culture supernatant. HBCD exposure of moDC did not enhance the production of pro-inflammatory cytokines IL-6 and TNFα, while a trend for an increased production of IL-8 was observed with doses of 10 and 20 μM HBCD (4/5 cases: only five volunteers yielded sufficient number of cells to analyze effect of HBCD alone) compared with the DMSO control (). HDM/DMSO exposure induced IL-6, TNFα and IL-8 (6/7 cases) compared with DMSO alone ( vs. (B)). Simultaneous exposure of HBCD and HDM to moDC significantly increased production of IL-8, but not of IL-6 or TNFα, at concentrations of 1 (7/7 cases) and 10 μM (7/7 cases) and a trend was observed at 20 μM HBCD (5/7 cases) compared to HDM/DMSO-exposed moDC ().
Figure 4. Production of pro-inflammatory IL-6, IL-8 and TNFα by moDC. (A) Cytokine levels after 24-h exposure of moDC to 0.1, 1, 10 or 20 μM HBCD compared to DMSO-exposed moDC. (B) Production levels after 24-h moDC exposure to HDM and HBCD (0.1, 1, 10 or 20 μM) compared to HDM/DMSO-exposed moDC. *p < 0.05 vs. control (0 μM).
Discussion
Inhalation of house dust exposes the airways to allergens in the presence of indoor pollutants. Hence, indoor pollutant HBCD may modulate the immune responses evoked by inhaled HDM allergens. In this study, the effect of HBCD exposure on the immune response of human moDC to HDM allergens was analyzed. Exposure of moDC to HBCD increased expression of CD86, an outcome that has been associated with an allergic DC phenotype (Hammad et al. Citation2001). Interestingly, exposure of HDM-pulsed DC to HBCD increased the expression of not only CD86 but also of HLA-DR and enhanced IL-8 cytokine production compared with that seen with HDM/DMSO-exposed DC. Interestingly, HLA-DR molecules are needed to present HDM allergens to T-cells while IL-8 is pro-inflammatory. Together, these results suggested to us that HBCD might skew HDM-presenting DC towards a pro-TH2 inflammatory phenotype.
Hammad et al. (Citation2001) and Charbonnier et al. (Citation2003) observed that DC stimulation with Der p 1, a major HDM allergen, induced an increase in CD86 in HDM allergic patients, whereas there was increased expression of CD80 in healthy donors without differences in HLA-DR expression. Increases in CD86 or CD80 expression have been associated with over-production of IL-10 or IL-12, respectively (Hammad et al. Citation2001). The absence of IL-12 and presence of IL-10 has been associated with a TH2-biased response (Lambrecht & Hammad Citation2003; Pulendran et al. Citation2010). In concordance, in this study with moDC from healthy volunteers, HDM exposure induced up-regulation of CD80 in all donors but did not affect production of IL-10 and IL-12 ( and Supplemental Figure 3(A) and (B)). However, simultaneous exposure of moDC to HDM and HBCD increased expression of CD86 and increased IL-10 and IL-12 production ( and Supplemental Figure 3(C)). Still, the levels of IL-10 and IL-12 were very low compared with those of IL-6, TNFα and IL-8 in the culture supernatants. Hammad et al. (Citation2001) also showed there was a greater and long-lasting production of pro-inflammatory IL-6 and TNFα by Der p 1-exposed moDC from allergic patients compared with that by moDC of healthy donors. In the present study, moDC that were exposed to HDM in the presence of HBCD induced an increase in IL-8, but not of IL-6 or TNFα, production. It is important to note that in the current study, a crushed whole-body HDM extract instead of Der p 1 was used so as to mimic the exposure to other biochemical activities and components of HDM, including chitin/chitinases, β-glucan and lipopolysaccharide (LPS), besides Der p 1 (Post et al. Citation2012). The endotoxin LPS, present in the gastrointestinal tract of mites, is a strong inducer of DC activation that can (partly) convey the possible enhancing effect of HBCD on the production of these cytokines (Peters et al. Citation2010).
The up-regulation of HLA-DR and CD86 and increased production of IL-8 by the HDM/HBCD-exposed moDC might result from oxidative stress induced by the HBCD exposure. We have previously shown that HBCD can induce oxidative stress which led to enhanced IL-6 production by mouse DC (Canbaz et al. Citation2016). Likewise, oxidative stress has been shown to up-regulate expression of HLA-DR, CD86 and CD40 (Rutault et al. Citation1999) and increase production of IL-8 by human DC (Verhasselt et al. Citation1998). Remarkably, IL-8 production was increased with 1 and 10 μM HBCD in the presence of HDM while HLA-DR and CD86 expression were increased with 10 and 20 μM HBCD/HDM. IL-8 production has been recognized as one of the earliest signs of DC activation (Hellman & Eriksson Citation2007). Although the underlying mechanism still needs to be elucidated, a similar mechanism might be involved in the greater sensitivity to lower concentrations of HBCD with regard to IL-8 production in comparison with effects on membrane markers.
In contrast to our previous observation that HBCD did not affect co-stimulatory molecule expression on cultured murine BMDC in the absence of HDM (Canbaz et al. Citation2016), here it did increase expression of CD86 on cultured human moDC. This discrepancy might be due to a difference in maturation state between cultured BMDC and moDC. BMDC have a mature state after 10 days of culture while human moDC are still in an immature state with a low expression profile of co-stimulatory CD80, CD86 and CD83 molecules (Hammad et al. Citation2001). In support of this, Koike et al. (Citation2013) demonstrated that HBCD was able to increase expression of CD80 and CD86 on murine BMDC when it was added for 6 days during BMDC differentiation.
The present study was not able to determine the outcome of the differentiation of HDM-specific naive T-cells after co-culture with HDM-pulsed DC. Hammad et al. (Citation2001) showed that co-incubation of autologous T-cells with Der p 1-pulsed moDC from dust mite-allergic donors or healthy donors favored a TH2 or TH1 response, respectively. However, naive T-cells need three signals to differentiate into a TH2 cell. The first signal comprises interaction with the allergen-specific T-cell receptor with the allergen presented on a MHC-II molecule. In addition, the T-cells need appropriate co-stimulation and a presence of certain cytokines, although the specific crucial co-stimulatory molecules and cytokines are still under debate. However, the number of HDM specific T-cells in healthy controls is very low. Michaud et al. (Citation2014) was not able to identify HDM-specific T-cells in non-allergic children. The number of naive HDM-specific T-cells in PBMC was therefore not sufficient to study the endpoint of differentiation by HBCD-exposed moDC.
Still, in a mouse model, we were able to show that simultaneous exposure to HDM and HBCD induced a stronger IL-17A or IL-4 response, depending on the level of LPS in the HDM extract, while adoptive transfer of HDM/HBCD-pulsed DC in the airways induced a TH17 response in vivo (Canbaz et al. Citation2016). IL-17A has been associated in mice and human with a more severe airway hyper-responsiveness in asthma (Cosmi et al. Citation2011; Wang & Wills-Karp Citation2011). Although the effect of the HBCD exposure on the phenotype of moDC was consistently found in the cells from the seven independent donors here, the experimental dose needed to induce an effect (10 μM = 6,417 μg/ml HBCD) was quite likely to exceed an environmentally- relevant dose, i.e. humans are estimated to be exposed to 5 ng/day in UK homes via inhaled air (Abdallah et al. Citation2008). Further research is clearly needed to confirm the effect of HBCD in humans for the endpoint of differentiation of naive HDM-specific T-cells by HDM-pulsed DC.
Conclusions
The present study demonstrated that exposure to HBCD modulated activation and cytokine production of HDM-pulsed human DC. While exposure to HDM extract induced expression of CD80 and pro-inflammatory cytokines by the moDC, addition of HBCD enhanced expression of antigen-presenting molecule HLA-DR, the co-stimulatory CD86 molecule, and the pro-inflammatory IL-8 cytokine. Taken together, these data suggest that HBCD enhances the maturation and activation of HDM exposed DC. The contribution of HBCD to the development of allergic immune responses to HDM allergens in human still needs to be established in future studies.
Funding information
D.C. received a grant from the European Union, Seventh Framework Program (FP7/2007-2013 under grant agreement no. 264600: “INFLAME”).
Supplemental Figures
Download MS Word (2.5 MB)Acknowledgments
We thank Michael Tanck from the Department of Clinical Epidemiology, Biostatistics and Bioinformatics (AMC) for his input and help concerning the statistical analysis.
Disclosure statement
The authors declare no conflicts of interest. The authors alone are responsible for the content of this manuscript.
Related Research Data
References
- Abdallah MA, Harrad S, Covaci A. 2008. Hexabromocyclododecanes and tetrabromobisphenol-A in indoor air and dust in Birmingham, UK: Implications for human exposure. Environ Sci Technol. 42:6855–6861.
- Allen JE, Sutherland TE. 2014. Host protective roles of Type 2 immunity: Parasite killing and tissue repair, flip-sides of the same coin. Semin Immunol. 26:329–340.
- Beasley R, Semprini A, Mitchell EA. 2015. Risk factors for asthma: Is prevention possible? Lancet. 386:1075–1085.
- Canbaz D, Logiantara A, Hamers T, van Ree R, van Rijt LS. 2016. Indoor pollutant hexabromo-cyclododecane has a modest immunomodulatory effect on house dust mite-induced allergic asthma in mice. Environ Sci Technol. 50:405–411.
- Charbonnier AS, Hammad H, Gosset P, Stewart GA, Alkan S, Tonnel AB, Pestel J. 2003. Der p 1-pulsed myeloid and plasmacytoid dendritic cells from house dust mite-sensitized allergic patients dysregulate the T-cell response. J Leukocyte Biol. 73:91–99.
- Cosmi L, Liotta F, Maggi E, Romagnani S, Annunziato F. 2011. TH17 cells: New players in asthma pathogenesis. Allergy. 66:989–998.
- de Jong EC, Vieira PL, Kalinski P, Schuitemaker JH, Tanaka Y, Wierenga EA, Yazdanbakhsh M, Kapsenberg ML. 2002. Microbial compounds selectively induce TH1 cell-promoting or TH2 cell-promoting dendritic cells in vitro with diverse TH cell-polarizing signals. J Immunol. 168:1704–1709.
- Dzopalic T, Rajkovic I, Dragicevic A, Colic M. 2012. The response of human dendritic cells to co-ligation of pattern-recognition receptors. Immunol Res. 52:20–33.
- Eder W, Ege MJ, von Mutius E. 2006. The asthma epidemic. N Engl J Med. 355:2226–2235.
- Froidure A, Shen C, Pilette C. 2016. Dendritic cells revisited in human allergic rhinitis and asthma. Allergy. 71:137–148.
- Hammad H, Charbonnier AS, Duez C, Jacquet A, Stewart GA, Tonnel AB, Pestel J. 2001. TH2 polarization by Der p 1-pulsed monocyte-derived dendritic cells is due to allergic status of donors. Blood. 98:1135–1141.
- Hellman P, Eriksson H. 2007. Early activation markers of human peripheral dendritic cells. Hum Immunol. 68:324–333.
- Hubo M, Trinschek B, Kryczanowsky F, Tuettenberg A, Steinbrink K, Jonuleit H. 2013. Co-stimulatory molecules on immunogenic vs. tolerogenic human dendritic cells. Front Immunol. 4:82.
- Hulin M, Simoni M, Viegi G, Annesi-Maesano I. 2012. Respiratory health and indoor air pollutants based on quantitative exposure assessments. Eur Respir J. 40:1033–1045.
- Iwasaki A, Kelsall BL. 1999. Mucosal immunity and inflammation. I. Mucosal dendritic cells: Their specialized role in initiating T-cell responses. Am J Physiol. 276:G1074–G1078.
- Jaakkola JJ, Knight TL. 2008. The role of exposure to phthalates from polyvinyl chloride products in the development of asthma and allergies: A systematic review and meta-analysis. Environ Health Perspect. 116:845–853.
- Koike E, Yanagisawa R, Takigami H, Takano H. 2013. Brominated flame retardants stimulate mouse immune cells in vitro. J Appl Toxicol. 33:1451–1459.
- Lambrecht BN, Hammad H. 2003. Opinion – Taking our breath away: Dendritic cells in the pathogenesis of asthma. Nat Rev Immunol. 3:994–1003.
- Lambrecht BN, Hammad H. 2009. Biology of lung dendritic cells at the origin of asthma. Immunity. 31:412–424.
- Maes T, Provoost S, Lanckacker EA, Cataldo DD, Vanoirbeek JA, Nemery B, Tournoy KG, Joos GF. 2010. Mouse models to unravel role of inhaled pollutants on allergic sensitization and airway inflammation. Respir Res. 11:7.
- Michaud B, Gouvis-Echraghi R, Candon S, Couderc R, Jais JP, Bach JF, Chatenoud L, Just J. 2014. Quantification of circulating house dust mite-specific IL-4- and IL-13-secreting T-cells correlates with rhinitis severity in asthmatic children and varies with the seasons. Clin Exp Allergy. 44:222–230.
- Patelarou E, Tzanakis N, Kelly FJ. 2015. Exposure to indoor pollutants and wheeze and asthma development during early childhood. Int J Environ Res Publ Health. 12:3993–4017.
- Peters M, Dudziak K, Stiehm M, Bufe A. 2010. T-cell polarization depends on concentration of the danger signal used to activate dendritic cells. Immunol Cell Biol. 88:537–544.
- Post S, Nawijn MC, Hackett TL, Baranowska M, Gras R, van Oosterhout AJ, Heijink IH. 2012. The composition of house dust mite is critical for mucosal barrier dysfunction and allergic sensitization. Thorax. 67:488–495.
- Pulendran B, Tang H, Manicassamy S. 2010. Programming dendritic cells to induce TH2 and tolerogenic responses. Nat Immunol. 11:647–655.
- Rutault K, Alderman C, Chain BM, Katz DR. 1999. Reactive oxygen species activate human peripheral blood dendritic cells. Free Radic Biol Med. 26:232–238.
- Verhasselt V, Goldman M, Willems F. 1998. Oxidative stress up-regulates IL-8 and TNFα synthesis by human dendritic cells. Eur J Immunol. 28:3886–3890.
- Wang YH, Wills-Karp M. 2011. The potential role of IL-17 in severe asthma. Curr Allergy Asthma Rep. 11:388–394.
- Willart MA, Hammad H. 2010. Alarming dendritic cells for allergic sensitization. Allergol Int. 59:95–103.