
Abstract
Estrogen is a neuro-protective hormone in various central nervous system (CNS) disorders. The present study evaluated the role of estrogen during experimental autoimmune encephalomyelitis (EAE) at doses selected to mimic any suppressive potential from the hormone during pregnancy. Here, mice were ovariectomized and then 2 weeks later treated with MOG antigen to induce EAE. Concurrently, mice then received (subcutaneously) an implanted pellet to deliver varying estrogen amounts over a 21-day period. Clinical scores and other parameters were monitored daily for the 21 days. At the end of the period, brain/spinal cord histology was performed to measure lymphocyte infiltration; T-cell profiles were determined through ELISA, flow cytometry, and real-time PCR. Transcription factor expression levels in the CNS were assessed using real-time PCR; T-cell differentiation was evaluated via flow cytometry. The results demonstrated that estrogen inhibited development of EAE. Histological studies revealed limited leukocyte infiltration into the CNS. High and medium dose of estrogen increased TH2 and Treg cell production of interleukin (IL)-4, IL-10, and transforming growth factor (TGF)-β, but concurrently resulted in a significant reduction in production of interferon (IFN)-γ, IL-17, and IL-6. Flow cytometry revealed there were also significant decreases in the percentages of TH1 and TH17 cells, as well as significant increase in percentages of Treg and TH2 cells in the spleen and lymph nodes. Real-time PCR results indicated that high- and medium-dose estrogen treatments reduced T-bet and ROR-γt factor expression, but enhanced Foxp3 and GATA3 expression. Collectively, these results demonstrated that a medium dose of estrogen – similar to a pregnancy level of estrogen – could potentially reduce the incidence and severity of autoimmune EAE and possibly other autoimmune pathologies.
Introduction
Multiple sclerosis (MS) is a chronic autoimmune disease, distinguished by inflammation and demyelination in the central nervous system (CNS) that mainly affects young adults (Markovic-Plese & McFarland Citation2001; Bodhankar et al. Citation2013). The etiology of this heterogeneous disease has been related to immunologic, environmental, and genetic factors, but its precise cause is still unknown (Milo & Kahana Citation2010). The pathogenesis of the disease is accompanied by activation and infiltration of mononuclear cells predominantly antigen-specific CD4+ and CD8+ T-cells and B-cells in the CNS (Mosayebi et al. Citation2010; Zhang et al. Citation2014).
Experimental autoimmune encephalomyelitis (EAE) is the most commonly used animal model for the study of MS. This model causes inflammation and demyelination similar to the disease manifestation seen in humans (Zhu et al. Citation2011; Markoullis et al. Citation2012). EAE is a T-cell-mediated autoimmune disease of the CNS induced by immunizing animals with myelin antigens. Disease development is mediated by interferon (IFN)-γ and interleukin (IL)-17-producing T-cells while IL-10 is critical in negative regulation (Park et al. Citation2005). T-cells generated through this immunization are able to pass through the blood–brain barrier (BBB) and propagate an influx of monocytes into the CNS. Subsequent activation of resident microglia and perhaps CNS cells, such as astrocytes lead to the demyelination of axons and axonal loss (Miller & Karpus Citation2007).
Regulatory T (Treg) cells expressing transcription factor (TF) Foxp3 are a CD4+ subset with potent immune suppressive activities that are decisive for maintaining self-tolerance and immune homeostasis (Fontenot et al. Citation2005; Zhou et al. Citation2009). Treg cells play an important protective role in EAE based on the finding that mice depleted of Treg cells exhibit increased susceptibility to EAE, whereas adoptive transfer of Treg cells reduced EAE incidence (Akirav et al. Citation2009; Bebo et al. Citation2009; Stephens et al. Citation2009). IL-10 was reported as a factor provided by TH2 cells that prevents TH1 cytokine production. However, IL-10 also plays a critical role in regulation of autoimmune injury like that which occurs in EAE. It has been showed that susceptibility of IL-10−/− mice to EAE highly was increased, whereas mice over-expressing IL-10 were highly resistant to EAE induction (Dai et al. Citation2012).
Gender differences in EAE and in the epidemiology of MS have suggested that sex hormones play an important role in disease pathogenesis; treatment studies have demonstrated that estrogen (E2) decreased pathology in EAE (Papenfuss et al. Citation2004, Lavi Arab et al. Citation2015). Estrogen is neuro-protective in various clinical and experimental CNS disabilities, including autoimmune diseases like MS, neurodegenerative disorders like Alzheimer’s and Parkinson’s disease, and both traumatic injuries and stroke. It has been demonstrated that estrogen treatment in disease models could ameliorate clinical symptom and reduce neuropathology manifestation (Spence et al. Citation2011). Thus, it is likely that elevated levels of estrogen, as occur during pregnancy, could be a factor in reducing risk/severity of MS in some women.
In fact, the highest circulating levels of estrogens during the last trimester of pregnancy correlate with a reduction in relapse rates among pregnant women suffered from MS (Spence & Voskuhl Citation2012). These patients showed a considerable shift from a TH2 profile during pregnancy to a TH1 cytokine profile post-natal; this was suggestive evidence for the effect of pregnancy in this TH1-mediated disease (Al-Shammri et al. Citation2004). Building on those findings, the present investigation studied the role of estrogen during EAE. Ovariectomized (OVAR) mice were used to avoid potential confounders of various circulating sex hormones, especially estrogen.
Materials and methods
Animals
C57BL/6 mice (female, 8-week-old) were obtained from the Pasture Institute of Iran (Tehran, Iran). Mice were housed in animal facilities of the BuAli Research Institute maintained at 23 ± 2 °C with a 50 ± 5% relative humidity and a 12 h light/dark cycle. All mice had ad libitum access to standard rodent chow and filtered tap water. All experiments were performed according to Mashhad University of Medical Science ethical guidelines.
Surgery
To perform the ovariectomy, 10-week-old mice were anesthetized with an intraperitoneal injection of ketamine (150 mg/kg) and xylazine (0.1 mg/kg). Anesthesia was confirmed by a reduced respiratory rate and no response to gentle pinching of footpad. A ventral incision was made through the skin of the flank and the ovaries and ovarian adipose tissue were then aseptically removed. Ovaries were isolated by ligation of the most proximal portion of the oviduct before removal. The animals were then returned to their cages and monitored for recover from surgery. A single subset of mice underwent a sham operation and then would serve as the EAE only control for these studies. Surgery was performed 2 weeks prior to EAE induction.
Estrogen treatment and measurement of serum estrogen levels
The OVAR mice were randomized into different treatment groups (N = 10–11/group). Some mice were to be implanted with three different 21-day-release 17β-estradiol pellets (Innovative Research of America, Sarasota, FL); control mice were to receive placebo pellets containing all hormone pellet components except 17β-estradiol. Sham EAE control mice underwent mock implantation. In all cases where pellets were inserted, the material was implanted subcutaneously in the scapular region (behind neck) using a 12-G trochar as described by the manufacturer (Innovative Research of America).
For these studies, implants were performed in temporal conjunction with the EAE immunization. Mice were immunized first (see below) and then divided into five test groups: 1. Control group (Ctrl) to receive no treatment (EAE-induced/no ovariectomy); 2. OVAR group implanted with placebo pellets; 3. Low-dose estrogen (T1; 0.25 mg/21-day release); 4. Medium-dose estrogen (T2; 2.5 mg/21-day release); and 5. High-dose estrogen (T3; 15 mg/21-day release). The mice in Groups 2–5 were thus all EAE-induced/OVAR. Implantation occurred within 30 min of the EAE immunization.
Induction and clinical evaluation of EAE
To induce EAE, mice were immunized with 250 μg MOG35–55 (Myelin Oligodendrocyte Glycoprotein35–55; Chengdu Kaijie Biopharm, Chengdu, Sichuan, China) dissolved in 100 μl phosphate-buffered saline (PBS, pH 7.4) and emulsified with 100 μl complete Freund’s adjuvant (CFA; Sigma, St. Louis, MO) containing 400 μg Mycobacterium tuberculosis (Difco, Detroit, MI). On the day of immunization and 2 days after immunization, 250 ng Bordetella pertussis toxins (Sigma) were injected intraperitoneally (Huehnchen et al. Citation2011).
Over the course of the post-pellet (or sham) implantation period, mice were monitored daily for clinical signs of disease. Mice were scored using the following scale: 0 = no clinical signs; 1 = partial loss of tail tonicity; 2 = complete loss of tail tonicity; 3 = flaccid tail and abnormal gait; 4 = hind leg paralysis; 5 = hind leg paralysis with hind body paresis; 6 = hind and foreleg paralysis; 7 = moribund or death (Sinha et al. Citation2008; Mosayebi et al. Citation2010; Haghmorad et al. Citation2014b). Mice were scored daily and recorded for incidence, day of onset, day of maximal clinical signs (peak), and for total disease score over the course of the experiment (cumulative disease index).
At Day 21, mice were euthanized by overdose of ketamine/xylazine and bled by cardiac puncture. The blood was allowed to clot at 4 °C overnight after which the samples were centrifuged, and the sera collected and stored at −80 °C until hormone analysis was performed. Serum levels of E2 were determined by radioimmunoassay (RIA) using a kit from MP Biomedical (Shanghai, China). All samples were analyzed in a single assay for each hormone. Final measures were taken in an automated gamma counter (Hidex, Turku, Finland).
Histopathology
Mice (half of each group) that were euthanized at Day 21 had their peripheral lymph nodes (inguinal and axillary) and spleens removed before they were perfused with 40 ml PBS followed by PBS containing 4% paraformaldehyde. The brain and spinal cord tissues were collected, post-fixed in 4% paraformaldehyde overnight at room temperature and embedded in paraffin. Samples (5-μm sections) were processed and stained with hematoxylin and eosin (H&E) for assessment of inflammation or Luxol fast blue for demyelination. Spinal cord histopathology was assessed as follows; two sections were examined from each of three spinal cord levels (cervical, thoracic, and lumbar) for each mouse. All slides were coded and read in a blinded manner (Berard et al. Citation2012). Sections were assessed as follows; inflammation: 0. No inflammation; 1. Small number of inflammatory cells; 2. Existence of perivascular infiltrates; 3. Extending intensity of perivascular cuffing with expansion into contiguous tissue. Demyelination was scored as follows: 0, No demyelination; 1. Unique foci; 2. Few sections with demyelination; 3. Considerable numbers of sections with demyelination (Horstmann et al. Citation2013).
Cell culture and BrdU proliferation assay
Single cell suspensions of each peripheral lymph node and spleen were prepared and suspended in RPMI-1640 medium containing 10% fetal bovine serum (FBS), 100 IU penicillin/ml, and 100 μg streptomycin/ml (all reagents bought from Sigma, St. Louis, MO). Cells were then placed into round-bottom 24-well plates (at 2 × 10⁶ cells/well) and 96-well plates (at 4 × 10⁵ cells/well) and then treated with 50 μl medium alone or medium + MOG35–55 (1 mg/ml; Chengdu Kaijie Biopharm). All cultures were incubated for 72 h at 37 °C (under 5% CO2). With samples in the 96-well plates, during the last 24 h the cells were cultured in the presence of BrdU-labeling solution (100 μl/ml/well; Roche Applied Sciences, Indianapolis, IN). Proliferation was subsequently assessed using the Roche Cell Proliferation ELISA BrdU (colorimetric) kit, according to the manufacturer instructions. Final measures were taken in a Stat Fax 2100 Awareness microplate reader (Fisher BioBlock Scientific, Palm City, FL).
ELISA for cytokines detection
Supernatants from the 24-well plates were collected after 72 h, and levels of IL-4, IL-6, IL-10, IL-17, TNF-α, transforming growth factor (TGF)-β, and IFN-γ were using commercial ELISA kits (eBioscience, San Diego, CA). All well absorbance measures at 450 nm were obtained using the microplate reader. Levels of each cytokine in a sample were then extrapolated from standard curves in parallel using kit-provided recombinant cytokine standards. The level of sensitivity of the kits was 2 pg IL-4/ml, 6.5 pg IL-6/ml, 5 pg IL-10/ml, 1.6 pg IL-17/ml, 3.7 pg TNF-α/ml, 12 pg TGF-β/ml, and 5.3 pg IFN-γ/ml.
Flow cytometry
Splenocytes were isolated as above and suspended at a density of 5 × 10⁶/ml in complete RPMI-1640 containing 10% FBS. For intracellular staining, mononuclear cells suspensions were stimulated in 24-well plates (5 × 10⁶/well) for 4 h with phorbol 12-myristate 13-acetate (PMA; 50 ng/ml in well, Sigma) and ionomycin (750 ng/ml in well, Sigma) in the presence of Brefeldin A (BFA;10 mg/ml in well, BD Biosciences, San Jose, CA). Cells were then harvested and washed in staining buffer, then stained with FITC-conjugated anti-CD4 (GK1.5) and PE-Cy5-conjugated anti-CD8 (536.7) for 30 min in the dark at 4 °C at manufacturer recommended levels of each antibody. The cells were then washed, fixed, and permeabilized using BD Biosciences fixation/permeabilization buffer. Finally, the cells were divided into four aliquots and stained for intracellular cytokines using either PE-conjugated rat anti-mouse IL-4 (11B11), anti-IFN-γ (XMG1.2), or anti-IL-17 (eBio17B7) antibody (at manufacturer recommended levels). Nonspecific antibody was used as a control on the fourth aliquot.
For intracellular staining of Foxp3, mononuclear cells washed in staining buffer and stained for 30 min at 4 °C with FITC anti-CD4 (GK1.5) and PE anti-CD25 (PC61.5) at manufacturer recommended levels of each antibody. The cells were then washed and incubated in fixation/permeabilization buffer (BD Biosciences). Foxp3 staining was performed using the PE-Cy5 anti-Foxp3 (FJK-16s) antibody. The analyses were performed using appropriate isotype controls as well.
All antibodies were purchased from eBioscience (San Diego, CA). Data were acquired on a FACSCalibur system (BD Biosciences) and analyzed using Cell Quest software. A minimum of 20 000 events/sample was acquired.
Quantitative real-time RT-PCR of spinal cord and peripheral lymphoid organs
To evaluate cytokine expression and immune cell infiltration, both the spinal cord and brain collected from mice (half of each group) at Day 21 post-EAE induction were individually processed in PBS using a nylon mesh. Each resulting suspension was centrifuged at 3000 × g for 10 min and the cell pellet was re-suspended in Trizol reagent (Roche Diagnostics GmbH, Mannheim, Germany) to permit total RNA isolation. In turn, cDNA was synthesized using a PrimeScript™ RT reagent Kit (Takara Biotechnology, Otsu, Shiga, Japan) according to manufacturer instructions. Quantitative real-time PCR was then performed on a Rotor Gene Q system (Qiagen, Hilden, Germany) using Taqman Master Mix (Prime mix EXTaq™, Takara Biotechnology) with appropriate primers and probe (). Mouse β2 microglobulin (β2mG) was used as an endogenous control for sample normalization. Based on expression of target genes normalized to β2mG levels, relative quantification (ΔΔCT) values were calculated and the results presented as fold-change compared to control.
Table 1. Sequences of primer and probes used in the study.
Statistical analysis
A one-way non-parametric analysis of variance (ANOVA) (Kruskal–Wallis test) followed by a Bonferroni’s post-hoc or an unpaired Student’s t-test was conducted for comparisons of clinical signs between groups. Comparison of the effect of estrogen between treatment groups on development of clinical signs was conducted via two-way repeated measures ANOVA. Mann–Whitney U non-parametric unpaired t-tests were used for two-group comparisons. SPSS 21 software (Chicago, IL) was used to analyze the data. All data are presented as mean ± SEM. Statistical significance was accepted at a p value <.05.
Results
Estrogen treatment inhibited development of EAE
The purpose of this study was to determine whether lack of estrogen caused more extensive EAE and if varying doses of estrogen could provide protection against EAE. E2 levels were measured in representative animals () and determined to be equivalent to those predicted by the manufacturer ( and ). Pregnancy levels of E2 reduced the incidence/severity of the disease and more importantly, medium levels of E2 reduced clinical manifestations as well. Pellets releasing 1500–2000 pg E2/ml serum significantly reduced severity of paralysis when compared with outcomes seen in the other groups (). A significant reduction in incidence of disease was only seen in mice implanted with pregnancy (high) levels or the medium dose of E2. OVAR mice who did not receive exogenous E2 developed more extensive EAE than any other group. On the other hand, treatment group with medium- (T2) or high-dose (T3) estrogen significantly reduced the severity of EAE in comparison to that in all other groups, and actually almost completely protected hosts against EAE through Day 21 post-immunization (). The clinical scores among the mice with medium-dose (T2, 0.9 ± 0.3) or high-dose estrogen (T3, 0.7 ± 0.2), were significantly lower than those in the OVAR mice (4.1 ± 0.3), controls (Ctrl, 3.8 ± 0.3), or mice that received the low-dose estrogen regimen (T1, 3.6 ± 0.4).
Figure 1. Estrogen inhibited the development of EAE in MOG-immunized C57BL/6 mice in dose dependent manner. All ovariectomized Treatment groups were implanted with 3 different 21-day release 17β-estradiol pellets and OVA group with placebo pellets containing vehicle subcutaneously in the scapular region behind the neck using a 12-gauge trochar as described by the manufacturer simultaneous with EAE induction as detailed under the Materials and methods section. Mice were monitored for signs of EAE, and the results for all mice, were presented as (A) incidence of disease, (B) mean clinical score ±SEM, and (C) body weight. Results were expressed as mean ± SEM. *p < .05, **p < .01, and ***p < .001, T1, T2, T3 and Ctrl groups compared with OVA group. Mice were divided into five groups: 1. Control group (Ctrl), 2. Ovariectomized group (Ova), 3. Low dose estrogen treatment group (T1), 4. Medium dose estrogen treatment group (T2),and 5. High dose estrogen Treatment group (T3).
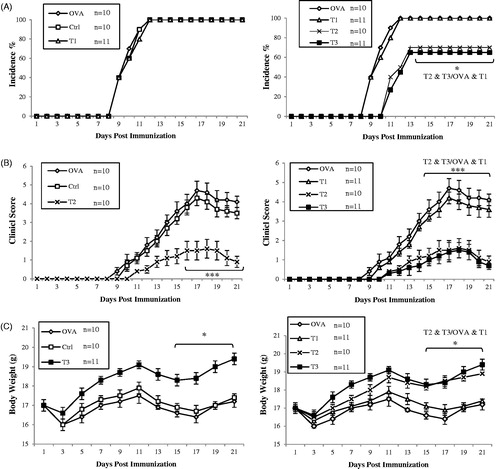
Table 2. Serum E2 levels in mice on Day 21.
Table 3. Serum E2 and E3 levels expected over 21 days by implanted hormone pellets.
Table 4. Serum E2 and E3 levels established for mouse serum.
Table 5. Clinical features of EAE as related to administration of estrogen.
Medium- and high-dose estrogen reduced immune cell infiltration into the CNS
To determine the effect of estrogen therapy on CNS pathology, inflammatory cell infiltration and demyelination of the spinal cord during EAE on Day 21 post-immunization was evaluated. Mononuclear cell infiltration and perivascular cuffing in the brain and spinal cord were analyzed using H&E staining. Fewer infiltrating cells and areas of perivascular cuffing were observed in high- (T3) and medium-dose (T2) estrogen-treated groups as compared to the OVAR, Ctrl, and low-dose (T1) estrogen groups. These latter three groups each presented with high levels of inflammation and cell infiltration in their brain and spinal cord ().
Figure 2. Comparative histopathology of spinal cords demonstrated that high and medium level of estrogen suppresses CNS inflammation and demyelination. Histopathological evaluation of spinal cords from all groups was performed. All ovariectomized treatment groups were implanted with 3 different 21-day release 17β-estradiol pellets and OVA group with placebo pellets. Spinal cords from each group, collected on day 21 post-immunization, were fixed in paraformaldehyde and embedded in paraffin. Five micrometer sections from different regions of the spinal cord from each of the groups were stained (A) with H&E to enumerate infiltrating leukocytes and (B) with Luxol fast blue to assess demyelination. (C) CNS inflammatory foci and infiltrating inflammatory cells were quantified. Pathological scores including inflammation and demyelination were analyzed and shown with bar graph as mean scores of pathological inflammation or demyelination ± SEM. Data are representative of 3 independent experiments. *p < .05, **p < .01, and ***p < .001, T1, T2, T3 and Ctrl groups compared with OVA group. Mice were divided into five groups: 1. Control group (Ctrl), 2. Ovariectomized group (Ova), 3. Low dose estrogen treatment group (T1), 4. Medium dose estrogen treatment group (T2),and 5. High dose estrogen Treatment group (T3).
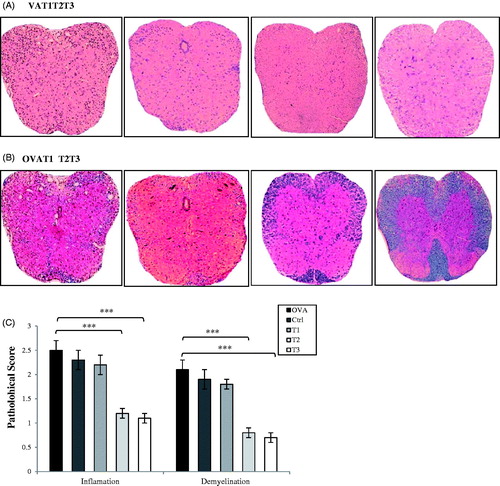
To evaluate demyelination, brain and spinal cord sections underwent Luxol fast blue staining. Significant demyelination in the areas of brain and spinal cord during the progression of disease was noted in the OVAR, Ctrl, and T1 mice (). High- (T3) and medium-dose (T2) estrogen-treated mice demonstrated reductions in levels of brain and spinal cord demyelination during the course of their disease development. The worst inflammation and cell infiltration in the brain and spinal cord was seen in OVAR mice without any exogenous estrogen ().
Medium- and high-dose estrogen preferentially induced TH2 and Treg cell cytokines
Cytokine production (e.g. specific inflammatory mediators like IL-6, TNF-α, IL-17, and IFN-γ) by cells from the spleen and lymph nodes on Day 21 post-immunization was determined using cells isolated from the mice and re-stimulated with MOG35–55 in vitro. Cells from high- (T3) and medium-dose (T2) estrogen-treated mice produced significantly less IL-17 and TNF-α relative to that by cells from OVAR, Ctrl, or T1 hosts (). IFN-γ and IL-6 production was also decreased in cells from the T2 and T3 groups. Similarly, at the RNA level, expression of IL-6, IL-17, IFN-γ, and TNF-α were all down-regulated in cells from the T2 and T3 mice relative to those in cells from the OVAR and Ctrl groups.
Figure 3. High and medium level of estrogen suppresses MOG-specific pro-inflammatory cytokines and preferentially induces Th2 and Treg cytokine production. Splenocytes and lymph nodes from immunized mice from all groups (52 mice) were isolated on day 21 post-immunization and restimulated with MOG35–55 (20 μg/ml) for 72 h. Culture supernatants were collected and Cytokine concentrations were measured by ELISA. Cytokine assays were conducted in triplicate wells. (A) Pro-inflammatory cytokines including IFN-γ, IL-17, TNF-α and IL-6 (B) Anti-inflammatory cytokines including IL-4, IL-10 and TGF-β were measured from supernatants of cultures from lymph nodes. Results from splenocytes were similar to lymph nodes and data was not shown. Mice were divided into five groups: 1. Control group (Ctrl), 2. Ovariectomized group (Ova), 3. Low dose estrogen treatment group (T1), 4. Medium dose estrogen treatment group (T2), and 5. High dose estrogen Treatment group (T3). Results were expressed as mean ± SEM. *p < .05, **p < .01, and ***p < .001, T1, T2, T3 and Ctrl groups compared with OVA group.
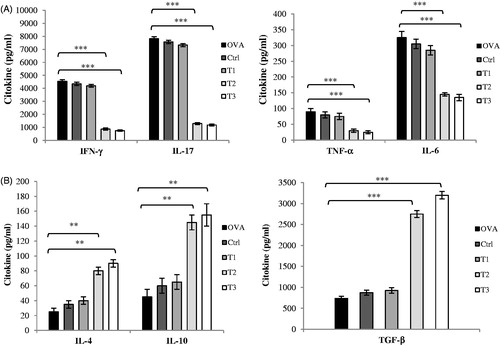
To determine if anti-inflammatory cytokines contributed to suppression of clinical disease observed during estrogen treatment, splenocyte and lymph node cell production of IL-4, IL-10, and TGF-β were examined ex vivo. IL-4 and IL-10 were found to be produced in significantly large amounts by cells from both high- (T3) and medium-dose (T2) estrogen-treated mice compared to that by cells from mice in the Ctrl and OVAR hosts (). Results also indicated higher levels of TGF-β formed by cells of mice in the T2 and T3 groups. Together, these results suggested that estrogen at high levels favored TH2 and Treg cell differentiation and could modulate T-cell cytokine secretion.
Medium- and high-dose estrogen-treated mouse splenocytes demonstrate reduced T-cell proliferation ex vivo
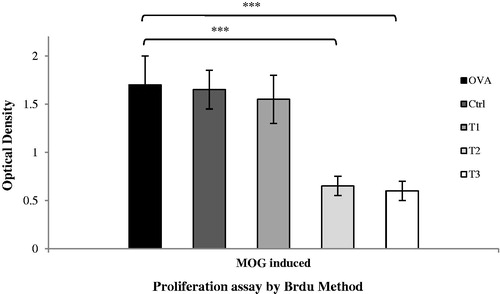
MOG-induced EAE is a T-cell-mediated disease and auto-reactive T-cells during EAE are activated within peripheral lymph nodes and spleen before they migrate into the CNS. To determine T-cell proliferative capability, Day 21 post-immunization lymph node cells and splenocytes were isolated and cultured/stimulated with MOG35–55 peptide; BrdU incorporation assays were then performed. The results clearly demonstrated that mononuclear cells from the high- and medium-dose estrogen-treated mice had ≈3-fold lower proliferative capacity (p < .001) compared with cells from the same sites in the OVAR, Ctrl, and T1 hosts ().
Figure 4. Splenocytes of high and medium estrogen treated mice demonstrated reducing T-cell proliferation in medium culture. Spleen cells were harvested on day 21 post-immunization and cultured in medium alone or with MOG (20 μg/ml) for 72 h on 96-well plates. Proliferation responses tested using a Cell Proliferation ELISA, BrdU (colorimetric) kit (Roche Applied Science, Indianapolis, IN). Proliferation assay was conducted in triplicate wells. Results were expressed as mean ± SEM. *p < .05, **p < .01, and ***p < .001, T1, T2, T3 and Ctrl groups compared with OVA group. Mice were divided into five groups: 1. Control group (Ctrl), 2. Ovariectomized group (Ova), 3. Low dose estrogen treatment group (T1), 4. Medium dose estrogen treatment group (T2), and 5. High dose estrogen Treatment group (T3).
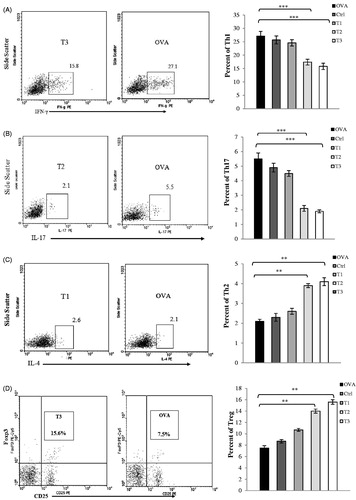
Medium and high levels of estrogen polarize CD4+ T-cells to TH2 and Treg status
To further investigate the possible role of estrogen in TH cell polarization, CD4+ T-cell subsets in lymph nodes (inguinal and axillary) and spleens from high- and medium-dose estrogen-treated mice (T2, T3 groups) were analyzed by flow cytometry. In concordance with the cytokine ELISA results, there were significant decreases in percentages of IFN-γ-producing CD4+ (TH1) and IL-17-producing CD4+ (TH17) T-cells, and also significant increases in percentages of CD4+ CD25+ Foxp3+ (Treg) and IL-4-producing CD4+ (TH2) T-cells isolated from T2 and T3 mice spleens and lymph nodes (). Further, high levels of TH1/TH17 cells and low levels of TH2/Treg cells were noted in samples from OVAR, Ctrl, and T1 mice; these values, in turn, were significantly different relative to counterpart values from T2 and T3 mice. In addition, expression of TH1, TH2, TH17, and Treg cell-specific TF in spleens were examined. The results indicated that high- and medium-dose estrogen treatment reduced T-bet (TH1) and ROR-γt (TH17) expression, but enhanced Foxp3 (Treg) and GATA3 (TH2) expression. Conversely, OVAR, Ctrl, and T1 groups showed up-regulation of T-bet and ROR-γt expression but also down-regulation of Foxp3 and GATA3 expression (data not shown).
Figure 5. Flow cytometry profiles of spleen mononuclear cells. The percentage of Th1, Th2, Th17 and Treg cells in the CD4+ gate was analyzed by flow cytometry. Mononuclear cells were isolated from spleen at the time of sacrifice on day 21 post-immunization from mice induced EAE. (A) Mononuclear cells were stimulated with PMA and ionomycin in the presence of the Golgi inhibitor brefeldin A for 4 h, then stained and analyzed by flow cytometry for intracellular production of (A) IFN-γ, (B) IL-17, and(C) IL-4. Values in the bar graphs are the mean ± SEM. (D) for intracellular staining of Foxp3; mononuclear cells were washed and stained with anti-CD4 and anti-CD25 antibodies for 30 min at 4 °C. Cells were washed and incubated in fixation/permeabilization buffer. Foxp3 staining was performed using the anti-Foxp3 antibody. CD4+ T-cells from spleen were gated and their CD25 and Foxp3 expression were analyzed by flow cytometry. Values in the bar graphs are the mean ± SEM. *p < .05, **p < .01, and ***p < .001, T1, T2, T3 and Ctrl groups compared with OVA group. Mice were divided into five groups: 1. Control group (Ctrl), 2. Ovariectomized group (Ova), 3. Low dose estrogen treatment group (T1), 4. Medium dose estrogen treatment group (T2), and 5. High dose estrogen Treatment group (T3).
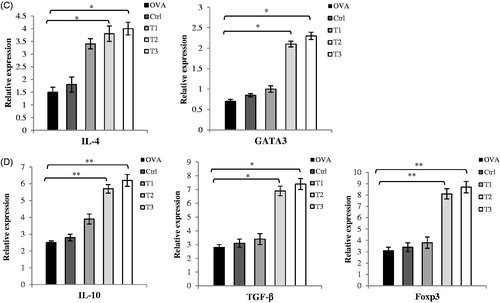
T-cell infiltration and cytokine production in CNS upon EAE induction
To evaluate infiltration of activated T-cells and determine T-helper (TH) cell polarization in the CNS microenvironment, mRNA expression levels of T-cell-related cytokines and TF were assayed. At Day 21 after EAE induction, T2 and T3 mice exhibited decreased expression of TH1 cell cytokines and related TF (T-bet, IFN-γ, TNF-α) and increased expression of TH2 cell cytokines and related TF (GATA3, IL-4, IL-10) when compared to values in OVAR, Ctrl, and T1 mice (). The T2 and T3 mice also showed decreased expression of TH17 cell cytokines and related TF (ROR-γt, IL-6, IL-17, and IL-23) and increased expression of Treg cell cytokines and related TF (Foxp3 and TGF-β) when compared to levels in the OVAR, Ctrl, and T1 mice. These changes in TH1, TH2, TH17, and Treg cytokines and TF were statistically significant relative to levels in the OVAR, Ctrl, and T1 mice. These consequences confirmed the flow cytometry/cytokine ELISA results obtained with cells from the spleen and lymph nodes.
Figure 6. mRNA expression of cytokines and transcription factors in CNS homogenates. On day 21 post-immunization, brains and spinal cords were collected and mRNA levels of cytokines and transcription factors were assessed by real time quantitative PCR as described in the Materials and methods section. Assay was run in triplicate and relative expression of genes was determined compared to the housekeeping gene, ?2microglobulin.(Relative to B2 microglobulin mRNA) (A) Th1 related cytokines and transcription factors as TNF-α, IFN-γ, T-bet (B) Th17 related cytokines and transcription factors as IL-6, IL-17, IL-23, ROR-?t (C) Th2 related cytokines and transcription factors as IL-4, GATA3 and (D) IL-10, TGF-β, Foxp3. Results were expressed as mean ± SEM. *p < .05, **p < .01, and ***p < .001, T1, T2, T3 and Ctrl groups compared with OVA group. Mice were divided into five groups: 1. Control group (Ctrl), 2. Ovariectomized group (Ova), 3. Low dose estrogen treatment group (T1), 4. Medium dose estrogen treatment group (T2), and 5. High dose estrogen Treatment group (T3).

Discussion
In a majority of autoimmune diseases, both incidence and severity differ between females and males. Although gender influences on autoimmune disorders has clearly been demonstrated after disease development, factors that result in increased susceptibility remain largely unknown. MS displays a distinct gender bias to increased susceptibility/disease severity in females with relapsing–remitting disease. However, women with MS experience remarkable recoveries during pregnancy, indicating a crucial protective role of sex hormones. Both estrogen and estradiol treatments have therapeutic potential in the treatment of MS. Since MS is often considered to be a T-cell-mediated autoimmune disease, the initial focus of immunomodulatory roles for estrogen was on T-cells (Bodhankar et al. Citation2011).
Recently, we demonstrated that treatment of EAE with pregnancy levels of estrogen invariably reduced subsequent neurologic disease, in part, through a suppression of TH1 and TH17 cell functions and a shift toward TH2 and Treg cells (Haghmorad et al. Citation2014a). Polanczyk et al. (Citation2004) demonstrated that protective effects of estrogen treatment were not mediated through direct action on the encephalitogenic T-cells, and that both immune and CNS cells were required in propagating immunomodulatory effects of E2. The exact molecular mechanisms in mediating regulatory effects of E2 in EAE have not yet been identified; Treg cells are prime immunoregulatory candidates since their numbers were increased by E2 in EAE-protected mice (Polanczyk et al. Citation2007; Wang et al. Citation2010). In the present study, administration of estrogen concurrent with EAE immunization led to an attenuated EAE clinical severity and protected mice against EAE. The present study showed that medium (pellets releasing 2000 pg/ml estradiol) and high-dose (pellets releasing 10 000 pg/ml estradiol) estrogen significantly diminished the relative percentages of TH1 and TH17 cells and increased those of TH2 and Treg cells in the CNS and peripheral lymphoid organs of mice with EAE.
Recruitment of myelin-reactive encephalitogenic T-cells into the CNS (and myelin destruction) are hallmarks of EAE (Anderton Citation2010), one potential mechanism of estrogen-mediated suppression of CNS inflammation might be inhibition of the BBB breakdown by immune cells (Liu et al. Citation2005; Shin et al. Citation2013), resulting in reduced infiltration into the CNS. Given the crucial role of TH17 cells in development of EAE, suppression of their infiltration into the CNS is likely an important mechanism underlying any beneficial effect of estrogen on this disease (El-Behi et al. Citation2011). Though the importance of TH1 cells in development of EAE is uncertain, recent studies support a pathogenic role. For example, Kroenke et al. (Citation2008) showed that adoptive transfer of either IL-12-polarized TH1 or IL-23-polarized TH17 cells into naive syngeneic mice resulted in clinically indistinguishable EAE between the groups. The present results also showed that estrogen treatment at medium and high doses suppressed both TH1 and TH17 cells in the CNS, thus reducing CNS autoimmune inflammation.
Cytokines regulate immune cell infiltration into different areas of the CNS, resulting in different clinical manifestations in animal models of MS (Cala et al. Citation2016). Both IFN-γ-secreting TH1 cells and IL-17-secreting TH17 cells are associated with activation of encephalitogenic T-cells, CNS inflammation, and demyelinating lesions (Wang et al. Citation2006; Fletcher et al. Citation2010; Lovett-Racke et al. Citation2011; Rostami & Ciric Citation2013). TH2/Treg cell-related cytokines like IL-4, IL-10, and TGF-β have been shown to be associated with reductions in inflammation and improvement of symptoms in MS patients (Oreja-Guevara et al. Citation2012; Koutrolos et al. Citation2014). In addition, these cells play a protective role in autoimmune diseases (Hedegaard et al. Citation2008, Zozulya & Wiendl Citation2008). The association between inflammatory cytokines with disease activity has led to suggestions that different T-cell subsets may be involved in induction of remission/suppression of disease processes (Miller et al. Citation1998). However, the importance of different T-cell subsets remains somewhat controversial (Leuenberger Citation2012; Harrirchian et al. Citation2014). As such, therapeutic strategies that lead to shifts in immune responses from TH1 → TH2 and TH17 → Treg cells may eventually be shown to be effective in the treatment of MS.
There is increasing evidence indicating that Treg cells accumulate and function within the inflamed CNS during EAE (Ephrem et al. Citation2008; Nosratabadi et al. Citation2016). In agreement with those observations, the present data showed that protective effects of estrogen may also result from an increase in Treg cell numbers. Though the molecular mechanisms by which estrogen shifts the balance between TH1 vs. TH2 and TH17 vs. Treg cells are currently unknown, for the first time, it was shown here that estrogen up-regulated expression level of TF (including GATA3 and Foxp3) in the CNS and possibly drove T-cells to TH2 and Treg states. The suppressive function of Treg cells is directed by Foxp3; its high-level expression is associated with suppressive function in human and mouse CD4+ T-cells (Liston & Gray Citation2014). As a master regulator of TH2 cells, GATA3 is required for TH2 cell differentiation, stability, and cytokine production (Chen et al. Citation2014; Fernando et al. Citation2014).
The elevated numbers of Treg cells in the CNS mice seen here might be a result of a direct expansion of Treg cells or their recruitment and accumulation into the CNS due to estrogen. It was observed that medium- and high-dose estrogen mice had greater levels of IL-10 in their CNS than other mice; this outcome could be due to an expansion of TH2 and Treg cells that each produces IL-10. In turn, an increase in IL-10 production may be responsible for reduced CNS inflammation through reduced production of pro-inflammatory cytokines/chemokines.
In an effort to determine specific changes responsible for the disease inhibition in the high- and medium-dose estrogen-treated mice (but not in the low dose or OVAR placebo-treated mice), cytokine production by splenocytes in response to antigen – including, pro-inflammatory IL-6, IL-17, IL-23, TNF-α, and IFN-γ or anti-inflammatory IL-4, IL-10, and TGF-β, were evaluated here as well. The results were confirmed through measures of mRNA expression levels of the cytokines in the CNS (and assayed by real-time quantitative RT-PCR). mRNA expression and secretion of anti-inflammatory cytokines were increased in the high- and medium-dose mice, but unchanged in low dose mice compared to OVAR placebo-treated mice. This difference in cytokine production may be an important contributor to the disease reduction seen in the high-/medium-dose estrogen mice. Increased IL-10 secretion is frequently associated with improvement in disease, while IL-10-deficient animals have a greater T-cell response to antigen and develop more severe EAE compared to WT mice (Yates et al. Citation2010).
Stimulated TH cells from the OVAR C57BL/6 mice here had enhanced expression of IFN-γ and TNF-α and TF T-bet, which clearly conferred a pro-inflammatory TH1-like phenotype. The same mice also had enhanced expression of IL-6, IL-17, and IL-23 and TF ROR-γt which conferred a pro-inflammatory TH17-like phenotype. Surprisingly, the data with the medium- and high-dose estrogen mice showed significantly higher levels of TH2 cell cytokines including IL-4 and IL-10 and Treg cell cytokines including IL-10 and TGF-β that antagonize TH1 and TH17 responses, respectively (Whitacre et al. Citation1999; Nosratabadi et al. Citation2015). A similar situation was previously described in female patients with MS, in whom regulatory cytokines like IL-4 and TGF-β were simultaneously up-regulated with IFN-γ during disease progression (Pelfrey et al. Citation2000; Rastin et al. Citation2013). The simultaneous up-regulation of TH2-like cytokines may be an attempt by the immune system to down-regulate the inflammatory TH1-like response. This also meant that cytokine interactions were much more complex than originally supposed for MS/EAE.
Conclusions
These studies showed that in OVAR mice, a medium or high dose of estrogen led to an increased expression of TF GATA3 and Foxp3 vs. decreased expression of TF T-bet and ROR-γt in the CNS. The study also demonstrated that medium dose estrogen treatment (≈5-fold lower than a pregnancy level) reduced the incidence/severity of EAE disease in a manner that appeared to favoring Treg and TH2 cell expansion and function.
Acknowledgements
The authors would like to thank the authorities in the research council of Mashhad University of Medical Sciences (MUMS) for their financial support [grant No. 88735].
Disclosure statement
The authors declare no financial or commercial conflicts of interest. The authors alone are responsible for the content of this manuscript.
References
- Akirav E, Bergman C, Hill M, Ruddle N. 2009. Depletion of CD4+CD25+ T-cells exacerbates experimental autoimmune encephalomyelitis induced by mouse, but not rat, antigens. J Neurosci Res. 87:3511–3519.
- Al-Shammri S, Rawoot P, Azizieh F, Abuqoora A, Hanna M, Saminathan TR, Raghupathy R. 2004. TH1/TH2 cytokine patterns and clinical profiles during and after pregnancy in women with multiple sclerosis. J Neurol Sci. 222:21–27.
- Anderton S. 2010. Treg and T-effector cells in autoimmune CNS inflammation: A delicate balance, easily disturbed. Eur J Immunol. 40:3321–3324.
- Bebo B, Dehghani B, Foster S, Kurniawan A, Lopez F, Sherman L. 2009. Treatment with selective estrogen receptor modulators regulates myelin specific T-cells and suppresses experimental autoimmune encephalomyelitis. Glia. 57:777–790.
- Berard J, Zarruk J, Arbor N, Prat A, Yong V, Jacques F, Akira S, David S. 2012. Lipocalin 2 is a novel immune mediator of experimental autoimmune encephalomyelitis pathogenesis and is modulated in multiple sclerosis. Glia. 60:1145–1159.
- Bodhankar S, Galipeau D, Vandenbark AA, Offner H. 2013. PD-1 interaction with PD-L1 but not PD-L2 on B-cells mediates protective effects of estrogen against EAE. J Clin Cell Immunol. 4:143.
- Bodhankar S, Wang C, Vandenbark A, Offner H. 2011. Estrogen-induced protection against experimental autoimmune encephalomyelitis is abrogated in the absence of B-cells. Eur J Immunol. 41:1165–1175.
- Cala CM, Moseley CE, Steele C, Dowdy SM, Cutter GR, Ness JM, DeSilva TM. 2016. T cell cytokine signatures: Biomarkers in pediatric multiple sclerosis. J Neuroimmunol. 297:1–8.
- Chen X, Shen Y, Liang Q, Flavell R, Hong Z, Yin Z, Wang M. 2014. Effect of bavachinin and its derivatives on T-cell differentiation. Int Immunopharmacol. 19:399–404.
- Dai H, Ciric B, Zhang G, Rostami A. 2012. Interleukin-10 plays a crucial role in suppression of experimental autoimmune encephalomyelitis by Bowman-Birk inhibitor. J Neuroimmunol. 245:1–7.
- El-Behi M, Ciric B, Dai H, Yan Y, Cullimore M, Safavi F, Zhang G, Dittel B, Rostami A. 2011. The encephalitogenicity of TH17 cells is dependent on IL-1- and IL-23-induced production of the cytokine GM-CSF. Nat Immunol. 12:568–575.
- Ephrem A, Chamat S, Miquel C, Fisson S, Mouthon L, Caligiuri G, Delignat S, Elluru S, Bayry J, Lacroix-Desmazes S, et al. 2008. Expansion of CD4+CD25+ regulatory T-cells by intravenous immunoglobulin: A critical factor in controlling experimental autoimmune encephalomyelitis. Blood. 111:715–722.
- Fernando V, Omura S, Sato F, Kawai E, Martinez N, Elliott S, Yoh K, Takahashi S, Tsunoda I. 2014. Regulation of an autoimmune model for multiple sclerosis in TH2-biased GATA3 transgenic mice. Intl J Mol Sci. 15:1700–1718.
- Fletcher J, Lalor S, Sweeney C, Tubridy N, Mills K. 2010. T-cells in multiple sclerosis and experimental autoimmune encephalomyelitis. Clin Exp Immunol. 162:1–11.
- Fontenot J, Dooley J, Farr A, Rudensky A. 2005. Developmental regulation of Foxp3 expression during ontogeny. J Exp Med. 202:901–906.
- Haghmorad D, Amini A, Mahmoudi M, Rastin M, Hosseini M, Mahmoudi M. 2014a. Pregnancy level of estrogen attenuates experimental autoimmune encephalomyelitis in both ovariwctomized and pregnant C57BL/6 mice through expansion of Treg and TH2 cells. J Neuroimmunol. 277:85–95.
- Haghmorad D, Mahmoudi M, Mahmoudi M, Rab S, Rastin M, Shegarfi H, Azizi G, Mirshafiey A. 2014b. Calcium intervention ameliorates experimental model of multiple sclerosis. Oman Med J. 29:185–189.
- Harrirchian MH, Honarvar NM, Koohdani F, Bitarafan S, Siassi F, Jafarirad S, Abdolahi M, Salehi E, Saharian MA, Rouystaee H, et al. 2014. The effect of vitamin a supplementation on disease progression, cytokine levels and gene expression in multiple sclerotic patients: study protocol for a randomized controlled trial. Acta Med Iranica. 52:94.
- Hedegaard CJ, Krakauer M, Bendtzen K, Lund H, Sellebjerg F, Nielsen CH. 2008. T-helper cell type 1 (TH1), TH2 and TH17 responses to myelin basic protein and disease activity in multiple sclerosis. Immunology. 125:161–169.
- Horstmann L, Schmid H, Heinen AP, Kurschus F, Dick H, Joachim S. 2013. Inflammatory demyelination induces glia alterations and ganglion cell loss in the retina of an experimental autoimmune encephalomyelitis model. J Neuroinflammation. 10:120.
- Huehnchen P, Prozorovski T, Klaissle P, Lesemann A, Ingwersen J, Wolf S, Kupsch A, Aktas O, Steiner B. 2011. Modulation of adult hippocampal neurogenesis during myelin-directed autoimmune neuroinflammation. Glia. 59:132–142.
- Koutrolos M, Berer K, Kawakami N, Wekerle H, Krishnamoorthy G. 2014. Treg cells mediate recovery from EAE by controlling effector T cell proliferation and motility in the CNS. Acta Neuropathol Commun. 2:163.
- Kroenke M, Carlson T, Andjelkovic A, Segal B. 2008. IL-12- and IL-23-modulated T-cells induce distinct types of EAE based on histology, CNS chemokine profile, and response to cytokine inhibition. J Exp Med. 205:1535–1541.
- Lavi Arab F, Rastin M, Faraji F, Zamani Taghizadeh Rabe S, Tabasi N, Khazaee M, Haghmorad D, Mahmoudi M. 2015. Assessment of 1,25-dihydroxyvitamin D3 effects on Treg cells in a mouse model of systemic lupus erythematosus. Immunopharmacol Immunotoxicol. 37:12–18.
- Leuenberger T. 2012. Regulatory CD4+ and CD8+ T-cells as candidates for regenerative therapies in a mouse model of multiple sclerosis. Berlin: Freie Universität.
- Liston A, Gray D. 2014. Homeostatic control of regulatory T-cell diversity. Nat Rev Immunol. 14:154–165.
- Liu R, Wen Y, Perez E, Wang X, Day A, Simpkins J, Yang S. 2005. 17β-Estradiol attenuates blood-brain barrier disruption induced by cerebral ischemia-reperfusion injury in female rats. Brain Res. 1060:55–61.
- Lovett-Racke AE, Yang Y, Racke MK. 2011. TH1 versus TH17: Are T cell cytokines relevant in multiple sclerosis? Biochim Biophys Acta. 1812:246–251.
- Markoullis K, Sargiannidou I, Gardner C, Hadjisavvas A, Reynolds R, Kleopa K. 2012. Disruption of oligodendrocyte gap junctions in experimental autoimmune encephalomyelitis. Glia. 60:1053–1066.
- Markovic-Plese S, McFarland H. 2001. Immunopathogenesis of the multiple sclerosis lesion. Curr Neurol Neurosci Rep. 1:257–262.
- Miller A, Shapiro S, Gershtein R, Kinarty A, Rawashdeh H, Honigman S, Lahat N. 1998. Treatment of multiple sclerosis with co-polymer-1 (Copaxone): implicating mechanisms of TH1 to TH2/TH3 immune-deviation. J Neuroimmunol. 92:113–121.
- Miller S, Karpus W. 2007. Experimental autoimmune encephalomyelitis in the mouse. Curr Protoc Immunol. Chapter Unit-15.1.
- Milo R, Kahana E. 2010. Multiple sclerosis: Geoepidemiology, genetics and the environment. Autoimmun Rev. 9:A387–A394.
- Mosayebi G, Haghmorad D, Namaki S, Ghazavi A, Ekhtiari P, Mirshafiey A. 2010. Therapeutic effect of EDTA in experimental model of multiple sclerosis. Immunopharmacol Immunotoxicol. 32:321–326.
- Nosratabadi R, Rastin M, Sankian M, Haghmorad D, Mahmoudi M. 2016. Hyperforin-loaded gold nanoparticle alleviates experimental autoimmune encephalomyelitis by suppressing TH1 and TH17 cells and up-regulating regulatory T-cells. Nanomedicine. 12:1961–1971.
- Nosratabadi R, Rastin M, Sankian M, Haghmorad D, Tabasi N, Zamani S, Aghaee A, Salehipour Z, Mahmoudi M. 2015. St. John’s Wort and its component hyperforin alleviate experimental autoimmune encephalomyelitis through expansion of regulatory T-cells. J Immunotoxicol. 13:364–374.
- Oreja-Guevara C, Ramos-Cejudo J, Aroeira LS, Chamorro B, Diez-Tejedor E. 2012. TH1/TH2 cytokine profile in relapsing-remitting multiple sclerosis patients treated with Glatiramer acetate or Natalizumab. BMC Neurol. 12:95.
- Papenfuss T, Rogers C, Gienapp I, Yurrita M, McClain M, Damico N, Valo J, Song F, Whitacre C. 2004. Sex differences in experimental autoimmune encephalomyelitis in multiple murine strains. J Neuroimmunol. 150:59–69.
- Park H, Li Z, Yang X, Chang S, Nurieva R, Wang Y, Wang Y, Hood L, Zhu Z, Tian Q, et al. 2005. A distinct lineage of CD4 T-cells regulates tissue inflammation by producing interleukin 17. Nat Immunol. 6:1133–1141.
- Pelfrey C, Rudick R, Cotleur A, Lee J, Tary-Lehmann M, Lehmann P. 2000. Quantification of self-recognition in multiple sclerosis by single-cell analysis of cytokine production. J Immunol. 165:1641–1651.
- Polanczyk M, Hopke C, Vandenbark A, Offner H. 2007. Treg suppressive activity involves estrogen-dependent expression of programmed death-1 (PD-1). Int Immunol. 19:337–343.
- Polanczyk M, Jones R, Subramanian S, Afentoulis M, Rich C, Zakroczymski M, Cooke P, Vandenbark AA, Offner H. 2004. T-lymphocytes do not directly mediate protective effect of estrogen on experimental autoimmune encephalomyelitis. Am J Pathol. 165:2069–2077.
- Rastin M, Mahmoudi M, Hatef M, Sahebari M, Tabasi N, Haghmorad D, Nosratabadi R, Zamani S, Khazaee M, Masoudian M. 2013. T-lymphocyte apoptosis in systemic lupus erythematosus patients. Iran J Basic Med Sci. 16:936–941.
- Rostami A, Ciric B. 2013. Role of TH17 cells in the pathogenesis of CNS inflammatory demyelination. J Neurol Sci. 333:76–87.
- Shin J, Yang S, Jeong S, Park H, Choi Y, Park E. 2013. Activation of ER-β reduces blood-brain barrier breakdown following ischemic injury. Neuroscience. 235:165–173.
- Sinha S, Kaler L, Proctor T, Teuscher C, Vandenbark A, Offner H. 2008. IL-13-mediated gender difference in susceptibility to autoimmune encephalomyelitis. J Immunol. 180:2679–2685.
- Spence R, Hamby M, Umeda E, Itoh N, Du S, Wisdom A, Cao Y, Bondar G, Lam J, Ao Y, et al. 2011. Neuroprotection mediated through estrogen receptor-alpha in astrocytes. Proc Natl Acad Sci USA. 108:8867–8872.
- Spence R, Voskuhl R. 2012. Neuroprotective effects of estrogens and androgens in CNS inflammation and neurodegeneration. Front Neuroendocrinol. 33:105–115.
- Stephens L, Malpass K, Anderton S. 2009. Curing CNS autoimmune disease with myelin-reactive Foxp3+ Treg cells. Eur J Immunol. 39:1108–1117.
- Wang C, Li Y, Proctor T, Vandenbark A, Offner H. 2010. Down-modulation of programmed death 1 alters regulatory T-cells and promotes experimental autoimmune encephalomyelitis. J Neurosci Res. 88:7–15.
- Wang Z, Hong J, Sun W, Xu G, Li N, Chen X, Liu A, Xu L, Sun B, Zhang JZ. 2006. Role of IFN-gamma in induction of Foxp3 and conversion of CD4+ CD25− T-cells to CD4+ Tregs. J Clin Invest. 116:2434–2441.
- Whitacre C, Reingold S, O’Looney P. 1999. A gender gap in autoimmunity. Science. 283:1277–1278.
- Yates M, Li Y, Chlebeck P, Offner H. 2010. GPR30, but not estrogen receptor-α, is crucial in the treatment of experimental autoimmune encephalomyelitis by oral ethinyl estradiol. BMC Immunol. 11:20.
- Zhang X, Lund H, Mia S, Parsa R, Harris R. 2014. Adoptive transfer of cytokine-induced immunomodulatory adult microglia attenuates experimental autoimmune encephalomyelitis in DBA/1 mice. Glia. 62:804–817.
- Zhou X, Bailey-Bucktrout S, Jeker L, Bluestone J. 2009. Plasticity of CD4+ FoxP3+ T-cells. Curr Opin Immunol. 21:281–285.
- Zhu B, Trikudanathan S, Zozulya A, Sandoval-Garcia C, Kennedy J, Atochina O, Norberg T, Castagner B, Seeberger P, Fabry Z, et al. 2011. Immune modulation by Lacto-N-fucopentaose III in experimental autoimmune encephalomyelitis. Clin Immunol. 142:351–361.
- Zozulya AL, Wiendl H. 2008. The role of regulatory T-cells in multiple sclerosis. Nat Clin Pract Neurol. 4:384–398.