
Abstract
In this study, Nile tilapia (Oreochromis niloticus) fingerlings were used as a model to examine acute and chronic toxicity of silver nanoparticles (AgNP). Expression levels of metallothionein (MT) transcripts in fish exposed to 0, 1 or 100 mg AgNP/kg fish were investigated by quantitative real-time RT-PCR. The results showed MT expression levels were significantly decreased 0.3–0.7-fold in the liver and spleen of fish exposed to 1 or 100 mg AgNP/kg after 6–48 h. In contrast, during this period, MT mRNA expression levels were increased 2–3-fold in the head kidney of the fish exposed to either level of AgNP. Investigations of effects of AgNP on the fish immune responses and hematological parameters revealed that phagocytic activity, the amount of red blood cells (RBC) and the percent hematocrit (%Hct) in fish exposed to AgNP were decreased significantly 1 week after exposure, especially those exposed to 100 mg AgNP/kg. Fish immunized with Streptococcus agalactiae vaccine and simultaneously exposed to 100 mg AgNP/kg presented decreased antibody titers during the early phase. Lastly, a challenge test showed that vaccinated fish exposed to AgNP, regardless of concentration, remained protected against S. agalactiae infection, with a lower mortality (10–20%) compared to 70% in control fish. These findings indicated that expression patterns of the MT gene in the liver, spleen and head kidney at different timepoints could be used to assess acute and chronic exposure of Nile tilapia to AgNP. Additionally, changes in innate immune responses and hematological parameters in fish may prove useful for evaluation of AgNP toxicity. Data obtained in this study strongly support the use of Nile tilapia as an animal model to potentially serve as a bio-indicator of environment contamination caused by AgNP.
Introduction
Silver nanoparticles (AgNP) are novel silver agents synthesized at the nano-scale level and are typically of diameters from 1–100 nm (Fabrega et al. Citation2011). Physicochemical properties, including size, shape, surface area, charge and solubility, make AgNP both interesting to – and challenging for – industrial markets worldwide. To date, AgNP have been used increasingly in global markets for their antibacterial properties (Wijnhoven et al. Citation2009). A large number of products containing AgNP have been rapidly put on the market (Wijnhoven et al. Citation2009; Shaw & Handy Citation2011), especially medical devices and engineering materials (Gunasekaran et al. Citation2011; Hadrup & Lam Citation2014). Unintentionally, the liberation into (and subsequent contamination of) the environment by AgNP has been increasing and has become a great concern with regard to their toxicity, particularly in aquatic animals (Benn & Westerhoff Citation2008; Fabrega et al. Citation2011; Pham et al. Citation2012).
Studies have focused on AgNP toxicity in fish. Hepatotoxicity has been observed in adult zebrafish (Danio rerio) exposed to AgNP, as indicated by increases in malondialdehyde (MDA) levels, formation of pyknotic nuclei, decreases in levels/activity of oxyradical-scavenging enzymes, increases in DNA damage and up-regulation of apoptosis-related genes (Choi et al. Citation2010). AgNP-induced toxicity in zebrafish embryos has also been documented (Yeo & Kang Citation2008). Clinical symptoms included an irregularly developed notochord that is short and curved, eye deformities, weak heartbeat and diminished hatching rates. Bilberg et al. (Citation2010) noticed that AgNP affected the Eurasian perch (Perca fluviatilis) respiratory system by disrupting oxygen consumption via the gills, resulting in hypoxemic intolerance. Accordingly, these major concerns indicated that studies assessing the impact of AgNP on living organisms and the environment are urgently needed.
Biomarkers are defined as indicators of biological events and can be used as tools to clarify relationships between exposed units and exogenous substances (Mussali-Galante et al. Citation2013). Chae et al. (Citation2009) and Pham et al. (Citation2012) demonstrated utilization of a group of biomarker genes to monitor the events occurring in Japanese medaka (Oryzias latipes) exposed to AgNP. In those studies, metal-binding proteins (metallothionein, MT) were used as a biomarker to monitor biological events in experimental fish exposed to AgNP. MT expression is typically used as a biomarker of exposure to heavy metals as the protein is ubiquitous, of low molecular weight, cysteine-rich and favorably binds a variety of transition elements (Lap et al. Citation2005; Thirumoorthy et al. Citation2007; Roy et al. Citation2011). Apart from metals, MT inducers include glucocorticoids, endotoxins, acute-phase cytokines, stress and irradiation (Lynes et al. Citation2014). Nevertheless, very little is known regarding effects of AgNP on MT responses at the molecular level; even less so is information with regard to in fish, including Nile tilapia.
The use of animal models to investigate particular events and determine modes of action of toxicity in response to harmful chemicals is the best way to clarify host–toxicant interactions. Fish models provide answers regarding toxicological testing because they can convey important information regarding absorption, metabolism, accumulation and excretion (Doherty et al. Citation2010). The most popular fish species – including zebrafish, Japanese medaka and fathead minnow (Pimephales promelas) (Yousefian & Payam Citation2012), are commonly used in biological research to determine the mechanisms underlying events occurring in higher vertebrates. Nile tilapia (Oreochromis niloticus) is an economically important aquatic animal cultured worldwide. Its rapid growth rate, adaptability to a wide range of environmental conditions and ability to grow at low trophic levels make it an excellent candidate for aquaculture, especially in tropical and subtropical regions, including Thailand (Bahnasawy et al. Citation2009). Nile tilapia are capable of adaptation to various habitats and may be a good representative of aquatic animals for studying the impact of polluting toxicants, like AgNP, on local animal health.
Accordingly, the study here was undertaken to determine the potential effects of AgNP on aquatic animals (i.e. using tilapia as representative fish species). The analyzes used included measures of effects from exposure on expression of the MT gene, as well as on select hematologic and immunologic parameters that could, in turn, reflect on fish innate and adaptive reactions after AgNP exposure. It was hoped this study would provide basic important information on hematological changes and responses associated with MT gene expression that could be used in the future to assess effects of AgNP contamination on various aquatic hosts in order to draw attention to the implications from such contamination of the aquatic environment.
Materials and methods
Silver nanoparticles (AgNP)
AgNP powder (99.5% purity [#576832]) containing polyvinylpyrrolidone (PVP) as a dispersant agent was purchased from Sigma (St. Louis, MO). The AgNP size was declared by the manufacturer to be uniformly of diameters <100 nm.
Experimental design
Nile tilapia fingerlings with weights of ≈ 30 g were obtained from the central area around Bangkok, Thailand. The fish were acclimated in fiberglass tanks containing tap water that was aerated with an air stone supplied by an air generator. Tilapia were fed commercial fish feed twice per day at a level of 5% body weight. Waste and excreta were suctioned out of each tank, and 20% of the water was drained and replaced with clean tap water, daily. After a 7-d acclimatization, 90 fingerling Nile tilapias were separated into three groups (n = 21–30/group; the additional fish/group were held in reserve in case fish in a group died during the postexposure period) following the completely randomized design (CRD). In Group I (control), fish were intraperitoneally (IP) injected with 0.1 ml phosphate-buffered saline (PBS, pH 7.4); in Groups II and III, fish were exposed by the same route to different doses of AgNP (1 or 100 mg/kg, respectively) prepared in PBS. At 6, 12, 24 and 48 h post-injection (hpi) and at the end of the 1st, 2nd and 4th week post-injection (wpi), three fish/group were removed, euthanized by immersion in a solution of 5 mg synthetic eugenol/L (Batter Pharma, Bangkok, Thailand) for 2 min and then had their livers, spleens and anterior kidneys collected for analyses.
Analysis of metallothionein (MT) gene expression
Total RNA extraction and cDNA synthesis
Livers, spleens and anterior kidneys of fish collected at each timepoint noted earlier were stored in TRIzol reagent (Gibco BRL, Grand Island, NY). To extract total RNA, tissues were homogenized using a Fast-Prep® homogenizer (MP Biomedicals, Santa Ana, CA) for 40 s and then underwent phase separation with chloroform as recommended by manufacturer protocol. Total RNA was precipitated with propanol and washed with 75% ethyl alcohol. After the RNA pellet was dried, total RNA was quantified using a NanoDrop 2000 spectrophotometer (Thermo-Scientific, Waltham, MA) and adjusted to a final concentration of 1 μg/μL. To convert mRNA to complementary DNA (cDNA), a Revert Aid First Strand cDNA Synthesis Kit (Fermentas, Waltham, MA) was employed using the company’s protocol.
Quantitative real-time PCR was then conducted using 1 μL first-strand cDNA isolated as described earlier, Brilliant®II SYBR® Green QPCR Master Mix (Stratagene, La Jolla, CA) and specific primers for the Nile tilapia MT gene (MT F/MT R) (). The measure for each gene was laterally normalized to β-actin expression levels using specific primers for the tilapia β-actin gene (β-actin F/β-actin R) (). Primers were designed from nucleotide sequences deposited in the NCBI database (http://www.ncbi.nlm.nih.gov/); sequence accession numbers are indicated in . The real-time PCR conditions were as follows: 1 cycle of 95 °C for 10 min, followed by 40 cycles of 95 °C for 30 s, 55 °C for 30 s, 72 °C for 1 min and finally 1 cycle of 95 °C for 1 min, 55 °C for 30 s and 95 °C for 30 s. Obtained values for threshold cycle (CT) were recorded to further calculate expression levels of the MT gene in each organ tested. Relative expression ratios of the genes of interest were determined using the 2−ΔΔCT method (Livak & Schmittgen Citation2001).
Table 1. Oligonucleotide primers used for quantitative real-time RT-PCR (Thummabancha et al. Citation2016).
Effects of AgNP on tilapia immune system
Nonspecific immune response and hematologic alterations
Experimental animal design
A separate set of 105 tilapia was randomly allocated to three groups (n = 35 fish/group) following the CRD basic design. Group I fish were to be IP injected with 0.1 mL normal saline (0.85% NaCl), while fish in Groups II and III were to be exposed to 1 or 100 mg/kg AgNP (in normal saline), respectively, via the same route. Blood samples from three fish/group were collected from the caudal vein with a 1-mL heparinized syringe at the end of weeks 1, 2, 4, 6 and 8 post-AgNP to permit examination of host phagocytic cell activity, red/white blood cell counts and percent hematocrit levels. The 20 remaining fish from each group were used for the bacterial resistance assays (described further below).
Phagocytic activity
Blood (1 mL) from the caudal vein was diluted with 2 mL RPMI (Sigma) and its cells then separated over 3 mL LymphoprepTM solution (Axis-Shield, Oslo, Norway; ρ = 1.077 g/mL) via centrifugation at 400×g for 30 min. Phagocytic cells that settled between the upper and intermediate phases were carefully removed, transferred to a new tube and washed twice with PBS (i.e. centrifugation at 250×g for 15 min). After the final wash, cells were re-suspended in PBS and the number of phagocytic cells (and viability using trypan blue) evaluated using a hemocytometer; cell levels were then adjusted to 5 × 10⁶ live cells/mL.
For the assay, 200 μL of the phagocytic cells was loaded onto the surface of a 22 × 22-mm2 coverslip (106 cells/grid), and the slip was then incubated for 2 h at room temperature to allow the cells to adhere. After the cells were repeatedly washed with PBS, 2-μm carboxylate-modified polystyrene fluorescent yellow-green latex beads (Sigma) at a concentration of 2 × 10⁷ latex beads/mL were added (200 μL/slip) and the slips incubated 1.5 h at room temperature to allow for phagocytosis of the beads by the cells. After incubation, the coverslip was washed repeatedly with PBS, fixed with methanol and then staining with eosin and methylene blue dye solutions (each for 10 s). After drying, phagocytic cells were examined using a light microscope and phagocytic activity (PA), phagocytic index (PI) and phagocytic efficiency (PE) were calculated (Puangkaew et al. Citation2004; Koenigsknecht & Landreth Citation2004). In each case, a minimum of 300 cells/slide was examined; a total of two slides/fish was examined.
Hematologic parameters
To determine the number of red (RBC) and white blood cells (WBC), 5 μL of the isolated blood/fish was added to 995 μL of Natt and Herrick staining solution, then pipetted into a hemocytometer and examined under a light microscope. Hematocrit (Hct) in each sample was determined by filling a heparinized glass capillary tube with blood (Modulohm A/S, Roedovre, Denmark). At least three-fourths of the height of the capillary tube was filled with blood, and then, the tube was sealed and centrifuged at 13 000×g for 5 min in a microhematocrit centrifuge (Suranaree Medical Equipment, Nakhon Ratchasima, Thailand). The %Hct level in each sample was then measured in a Suranaree-automated hematocrit reader.
Specific immune response
Preparation of formalin-killed antigen Streptococcus agalactiae (FASA)
Streptococcus agalactiae SAAQH001 is a pathogenic bacterium that causes a systemic infection and is a causative agent of streptococcosis for Nile tilapia. The bacteria were provided by the Laboratory of Aquatic Animal Health Management [Department of Aquaculture, Kasetsart University] and cultured in trypticase soy broth (Difco, Detroit, MI) for 18 h at 33 °C. The bacterial suspension was then centrifuged at 800×g for 5 min, washed twice with 0.85% sodium chloride (NaCl) solution and the final pellet re-suspended in 1% formalin (in 0.85% NaCl). The suspension was placed at 4 °C for 24 h and then centrifuged at 800×g for 5 min; the resulting supernatant was removed, and 0.1% formalin (in 0.85% NaCl) was added to re-suspend the pellet. These samples were then held at 4 °C until use. For actual use in assays, the suspension was centrifuged at 800×g for 5 min, the supernatant was removed, and the pellet was washed twice with 0.85% NaCl. The final pellet was re-suspended in 0.85% NaCl and turbidity then adjusted (with 0.85% NaCl) to obtain an optical density (OD) at 560 nm of 0.6 (a value equivalent to a level of bacteria that would yield, if the organism was alive, ≈ 109 colony-forming units (CFU)/mL) in a Spectronic Bio Mate 3 spectrophotometer (Thermo Electron, Cambridge, UK).
Experimental design
Yet another separate set of 176 tilapia were randomly placed into four groups (n = 44 fish/group) following the CRD similar to the above description. The fish in Group I were IP injected with 0.1 mL normal saline. Fish in Group II were vaccinated by IP injection with 0.1 mL FASA only. The fish in Groups III and IV were immunized with FASA and then (within minutes) IP injected with AgNP at, respectively, 1 or 100 mg/kg. Blood samples (1 mL) from three fish/group were collected at the end of the each week (up to 8 week total) from the caudal vein to examine antibody titers. Because it was expected that by the end of Week 3 antibody levels induced in this first period were expected to have declined, on Day 22 of the experiment (start of Week 4), a second immunization with FASA was conducted on fish in Groups II, III and IV; fish in Group I were injected with normal saline at the same time. The 20 remaining fish from each group were used for the bacterial resistance assays (described further below).
Antibody titer assay
The blood withdrawn from the caudal vein of each fish was transferred to a 1.5-mL microfuge tube that was then inclined and incubated for 2 h at room temperature to allow for serum separation. After centrifugation at 600×g for 15 min, serum was isolated, removed and transferred to a new microfuge tube. Antibody titer was determined using U-shaped 96-well plates and twofold serial dilutions of the starting serum sample (using normal saline). Thereafter, 50 μL of a solution containing antigen (FASA, at 108 CFU/mL) was loaded into each well. After incubation at 37 °C for 24 h, the wells were checked for antigen-antibody complex mats; a negative result presented as a white button-like spot at the bottom of the well (Kwon et al. Citation2006). The titer was calculated as the inverse of the final dilution to give rise to the mat product in a well.
Bacterial resistance analysis in unvaccinated tilapia
The 20 remaining (unvaccinated) fish from each group prepared for use in the phagocytosis and hematology analyses were transferred to two 150-L fiberglass tanks containing 100 L fresh water (10 fish/tank). After acclimatization for 2 d, a challenge test was conducted by IP injecting all fish in each group with 0.1 mL live S. agalactiae suspension (109 CFU/mL). Cumulative mortality in each group was then monitored daily until Day 7 post-infection. In this case, the organism was grown as in the FASA preparation protocol, but not killed with formalin.
Bacterial resistance analysis in FASA-vaccinated tilapia
The 20 remaining unused fish that had been vaccinated (twice) with FASA were also challenged with 0.1 mL live S. agalactiae suspension via the same protocol as earlier. Cumulative mortality in each group was then monitored daily until Day 7 post-infection.
Statistical analyses
Relative expression ratios of the MT gene in each organ at different timepoints, PA, PI, PE, hematological parameters, antibody titers and cumulative mortality rates in each treatment group at different timepoints in each experiment described previously were analyzed using a one-way analysis of variance (ANOVA) based on the basic design of the CRD method. A Duncan’s new multiple range test (DMRT) was used to compare differences of means for all observed values at a 95% confidence interval (p < 0.05).
Results
Expression levels of MT gene in tilapia in response to AgNP exposure
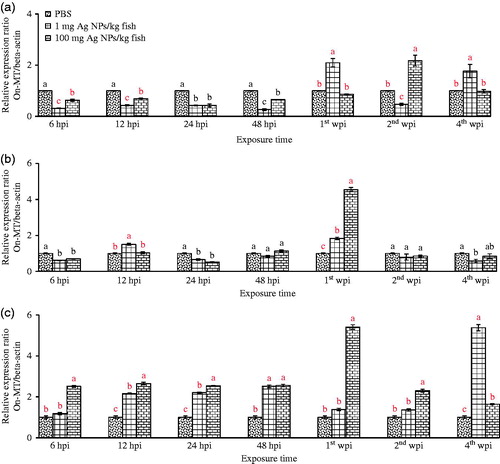
Different expression patterns of the MT gene in each organ were obtained after the fish were exposed to different doses of AgNP (1 or 100 mg/kg) for different durations covering acute and chronic phase responses. Significantly suppressed MT mRNA expression was found in livers in all AgNP-exposed fish at the beginning of the monitoring times at Hours 6 through 48 with fold changes of 0.3–0.7 (p < 0.05) (). In the spleen, the MT gene in all groups exposed to AgNP was significantly down-regulated at Hours 6 and 24 by about 0.5-fold (p < 0.05) (). MT transcripts in the head kidneys in fish exposed to AgNP were significantly elevated in a dose-related manner at Hour 12 with fold changes of 2–3 and were continuously expressed at 24 hpi by similar expression levels of 12 hpi until 4 wpi, with the exception of Week 2 in which only fish that received 100 mg AgNP/kg demonstrated a significant 2.5-fold change to a level higher than those in the control and the 1 mg AgNP/kg treated group (p < 0.05) (). At the end of Week 4, in the head kidney, MT expression was inverted in a dose-related manner in the 1 and 100 mg AgNP/kg treated groups, with relative expression ratios (fold-changes) being 5.5 and 1.5, respectively.
Figure 1. Relative expression ratios of MT gene in Nile tilapia. (a) Liver. (b) spleen. (c) anterior kidney. Values shown are means ± SD. At each given timepoint, bars with different lettering significantly differ from one another at p < 0.05. N = 3 fish/group/timepoint.
Hematological parameters
Results concerning %Hct levels () revealed that at Week 1 post-injection (1st wpi), the 100 mg AgNP/kg-exposed fish had a significant decrease in their %Hct to 19.3% compared to 28.3% in the controls (reduction of ≈ 32%; p < 0.05). At Weeks 2, 4, 6 and 8 post-injection, both AgNP doses had led to significant reductions in these values relative to controls. At Week 8, the 1 and 100 mg AgNP/kg regimens resulted in %Hct values of 19.7 and 22.0% compared with 28% for control fish (p < 0.05). This showed that the effects as time progressed well after the single injection were not necessarily dose-related at least with regard to this endpoint.
Table 2. Hematocrit levels in fish.
For the most part, and over all timepoints post-injection, all AgNP-exposed fish displayed a significant reduction in RBC levels compared with values in controls (). Interestingly, after Week 6 post-injection, values began to normalize to control levels. Toxicity as regards this endpoint seemed to be worst right at Week 1 post-injection, wherein values for RBC levels for the 1 and 100 mg AgNP/kg fish were 0.96 and 0.57 × 10⁶ cells/mm3, respectively, compared to control fish levels (1.68 × 10⁶ cells/mm3; p < 0.05). Again, none of the effects at the earlier timepoints appeared dose-related with regard to this endpoint.
Table 3. Red blood cell counts in fish.
With regard to WBC levels, only at Week 1 post-injection did any AgNP treatment cause a significant effect (). Specifically, among fish that received 100 mg AgNP/kg, cell counts decreased to 10.25 × 10⁶ cells/mm3 compared to a control value of 14.67 × 10⁶ cells/mm3 (p < 0.05). Again, apart from these values differing from those of the 1 mg AgNP/kg fish at this timepoint, there were no dose-related trends with regard to this endpoint.
Table 4. Total white blood cell levels in fish
Immunological responses in chronically AgNP-exposed Nile tilapia
Innate immunity
The data on the activity of phagocytic cells revealed that at the high doses (100 mg AgNP/kg) used here, cells from exposed fish showed an obvious decrease in phagocytic activity (PA) at Week 1 all the way through until the end of the experiment (). During these periods, both AgNP levels resulted in significantly lower PA (ranging from 6–8%) values compared with that from the controls (PA = ≈ 10–11%; p < 0.05). At a low dose (1 mg Ag NP/kg), PA values declined from Week 2 until Week 4 ().
Figure 2. Functionality of isolated phagocytes. (a) Phagocytic activity (PA). (b) Phagocytic index (PI). (c) Phagocytic efficiency (PE). Cells (from all peripheral blood leukocytes) were isolated from tilapia exposed to 1 or 100 mg AgNP/kg at 1st, 2nd, 4th, 6th and 8th wpi. Values shown are means ± SD. At each given timepoint, bars with different lettering significantly differ from one another at p < 0.05. N = 3 fish/group/timepoint.
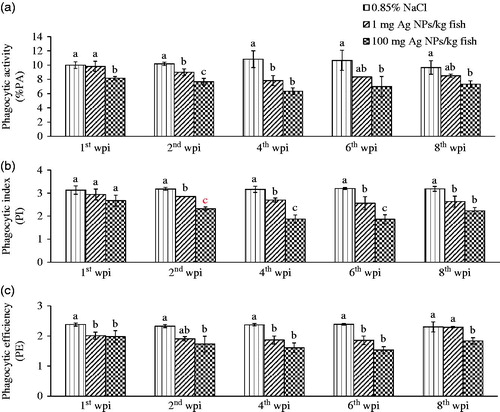
At Week 1, the PI in cells from all AgNP-exposed fish did not significantly differ among the groups. However, over Weeks 2–8, the PI values were significantly decreased in a dose-related manner, especially at the 4th wpi showing an average PI of 3.1 (control), 2.7, and 1.8, respectively (p < 0.05) ().
The PE values for cells from fish exposed to AgNP were dramatically diminished by the end of Week 1 and continuously decreased thereafter until the 6th wpi of the experiment, where cells from all treated fish groups exhibited PE values significantly lower (i.e. ≈ 1.7–1.8) than the mean value of 2.5 for cells from the controls (p < 0.05) ().
Specific immunity
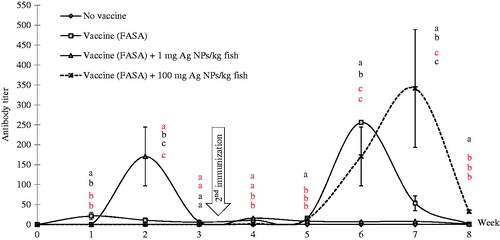
The results for the analyses of antibody titers against FASA revealed that positive control (FASA immunization) fish showed a normal pattern, that is, 1st highest peak was found at Week 1 with a titer of ≈ 21.33 (± 9.24) that later declined to the lowest level at Week 3. Antibody titers reached the second-highest peak at Week 6 after the second immunization was administered (). The titer in the 1 mg AgNP/kg-injected fish was found to exhibit a sharp first peak (mean titer of ≈ 170.67 [±73.90]) at Week 2 that was immediately reduced (mean titer of ≈ 6.67 [± 2.31]) by Week 3. After the second immunization, antibody levels of fish in this group were only slightly changed. When the second immunization was performed, the serum antibodies showed a slight response. Antibodies in fish exposed to 100 mg AgNP/kg could not be detected after the first immunization. However, after the second immunization, serum levels gradually increased every week until reaching a high (a mean titer of ≈ 341.33 [±147.80]) at Week 7; this level significantly differed from values in all the other groups (p < 0.05) ().
Figure 3. Antibody titer levels in tilapia immunized with vaccine (FASA) and exposed to various doses of AgNP. Values shown are means ± SD. At each given timepoint, bars with different lettering significantly differ from one another at p < 0.05. N = 3 fish/group/timepoint.
Bacterial resistance under different exposure conditions
Normal tilapia exposed to various levels of AgNP
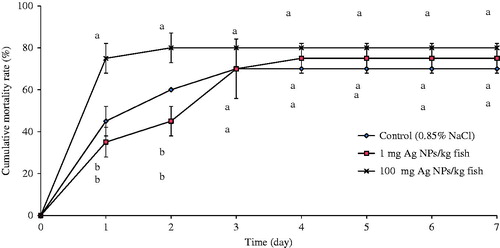
Significant differences in mortality among fish were observed only on Days 1 and 2 post-infection with S. agalactiae. The results revealed that fish exposed to the highest dose of AgNP here (100 mg/kg) had significant mortality (75 [±7]%; ) on Day 1; rates were 45 [±7] and 35 [±7] in control and 1 mg AgNP/kg-exposed fish, respectively. On Day 2, mortality in the control and 1 mg AgNP/kg fish significantly differed from the 100 mg AgNP/kg fish with values of 60 [±1], 45 [±7] and 80 [±7]%, respectively. Thereafter, mortality rates did not significantly differ among any of the groups.
Figure 4. Cumulative mortality (%) in tilapia with/without AgNP exposure and then challenged with S. agalactiae. Fish that not exposed to AgNP served as control for infections. Values shown are means ± SD. At given timepoint, bars with different lettering significantly differ from one another at p < 0.05. N = 3 fish/group/timepoint.
Tilapia immunized with FASA and then exposed to AgNP
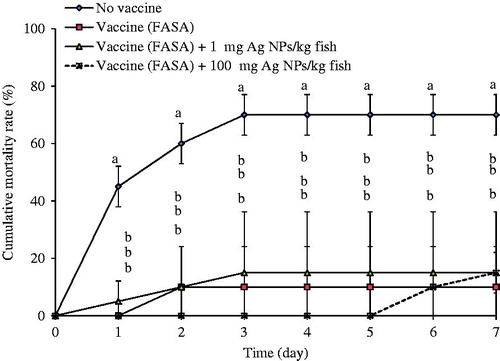
The cumulative mortality data for each group of fish that had undergone earlier FASA immunization revealed that over Days 1–7 post-challenge, FASA-vaccinated control fish and FASA-vaccinated fish exposed to any doses of AgNP had insignificant differences in mortality (all 10–15%) (). However, the control group (0.85% NaCl) that had received no vaccine displayed ≈ 45, 60 and 70% mortality levels at, respectively, Days 1, 2 and over 3–7 post-injection. Unsurprisingly, the differences in mortality between the infected unvaccinated control and all test vaccinated fish were significant from Day 1 onwards until the end of experiment.
Figure 5. Cumulative mortality (%) in FASA-vaccinated tilapia with and without AgNP exposure and then challenged with S. agalactiae. Fish that were not immunized with FASA or then exposed to AgNP served as control for infections. Values shown are means ± SD. At each given timepoint, bars with different lettering significantly differ from one another at p < 0.05. N = 3 fish/group/timepoint.
Discussion
When AgNP are released into aquatic systems, water chemistry directly affects the particles, resulting in changes in their physicochemistry (i.e. solubility, aggregation, surface charge) (Fabrega et al. Citation2011; Shaw & Handy Citation2011). Such changes then impact on the degree of toxicity eventually imparted by the particles to the local aquatic animals. A large number of AgNP products are extensively available worldwide (Gunasekaran et al. Citation2011; Wijnhoven et al. Citation2009; Shaw & Handy Citation2011; Hadrup & Lam Citation2014). Therefore, with increases in manufacturing, there is a concomitant increase is risk for contamination of the local environment. This is especially true for aquatic habitats where local hosts cannot avoid exposures to toxicants via the gills, mucus and skin, and so manifest toxicities.
Because AgNP contamination in water environments may, in turn, affect local aquatic organisms, analyses of the impact of these agents are urgently needed in general. Further, it would be of great help to identify potential bioindicators of impact of any such AgNP contamination. In this vein, determining if a local model – like the easily manageable/accessible Nile tilapia (or other region-specific small fish) – could serve as a good sentinel would allow systems to be developed that could be used for longitudinal monitoring of contamination levels (as well as during acute contamination events) of AgNP in local freshwater systems. To achieve this, the studies here used Nile tilapia to establish their potential utility in assessing toxicity from exposure to AgNP; in particular, immune endpoints (deemed by many agencies as most useful for evaluating low-dose exposure effects in short timeframes) were evaluated.
In a previous study, an acute toxicity test for AgNP in Nile tilapia fry was performed to determine the 50% lethal concentration (LC50). However, the trial failed because fish did not die even after a 96-h exposure to the highest concentration (500 mg/L; data not shown). This indicated that the AgNP was not very toxic to these test animals or that properties of the water might have affected the AgNP. To circumvent this interfering effect, here, intraperitoneal (IP) injection was used as the route of AgNP administration. Interestingly, even when fingerlings were exposed to/injected with high doses of AgNP (100 mg/kg), again none died. However, some fish did exhibit physiological changes, including lethargy, darkened stripes along the body and increased opacity of the eyes, at 1-week post-injection. This suggested to us that high levels of AgNP may cause chronic rather than acute toxicities.
Previously, Sarkar et al. (Citation2015) reported an acute toxicity (LD50) of 1–27 nm AgNP in Nile tilapia prefingerlings (0.53 [± 0.10] g) of ≈ 8 mg/L. The present results were relatively different from those of Sarkar et al. (Citation2015) most likely due to the different: (1) AgNP preparations used, (2) stabilizers/dispersants added, (3) sizes of the AgNP, (4) weights of the fish; and, (5) routes of exposure. While host size/route of exposure are key factors for any difference in outcomes, the studies of Jeong et al. (Citation2014) strongly suggested that one of the most important factors affecting the degree of AgNP toxicity was size. In particular, those studies found that smaller AgNP (10 nm) were more toxic to peripheral blood mononuclear cells than larger (100 nm) particles.
Mechanisms for these toxicities remain in dispute. Several reports have stated that AgNP have the potential to induce toxicity via induction of reactive oxygen species (ROS) (Hussain et al. Citation2005; Wise et al. Citation2010; Foldbjerg et al. Citation2011; Chairuangkitti et al. Citation2013). Chairuangkitti et al. asserted that toxic effects of AgNP on human lung cells were mediated by (1) ROS-dependent pathways leading to cell death and/or (2) ROS-independent pathways leading to cell cycle arrest. ROS generated in cells disturbed mitochondrial membrane permeability, affected membrane potentials and led to cell death via mitochondria-dependent apoptotic pathways (Hussain et al. Citation2005; Hsin et al. Citation2008; Teodoro et al. Citation2011).
Ideally, molecular biomarkers are important tools that are used to monitor potential toxic effects (Lam et al. Citation1998; Lap et al. Citation2005; Thirumoorthy et al. Citation2007). Here, in Nile tilapia used as representative aquatic hosts, metallothionein (MT) gene was monitored as a representative biomarker of potential effects from AgNP. Here, the AgNP-exposed fish revealed up-regulated MT mRNA levels in the head kidney (starting at Hour 12 by 2–3-fold) that was continuously (more-or-less) expressed until Week 4. However, the findings in the liver were very different. Specifically, expression of MT gene in liver was suppressed at Hour 6 until Hour 48 by 0.2–0.7-fold, and then induced at Week 1. These changes in liver MT are akin to those noted by Pham et al. (Citation2012) who saw that the MT gene in the liver AgNP-exposed medaka was initially significantly down-regulated and – after some time – up-regulated. It would be interesting to speculate that the MT gene in fish liver is a “negative effect” biomarker in acute phase responses, while up-regulated MT transcripts may be indicators of host chronic exposure. Overall, the suppressive effects of the AgNP on the MT gene in fish liver here indicated the particles might disturb the sequestering processes fish use to eliminate metals from the liver. This type of change, in turn, would lead to an ongoing additional accumulation of AgNP in the organ until toxic/lethal burdens were likely attained.
The differential effects on MT in the liver versus head kidney also suggested potential differences in AgNP deposition/retention in each site. Platonova et al. (Citation2013) noted accumulation of AgNP in the liver and spleen of rats after injection of AgNP solution. In adult zebrafish exposed to AgNP, accumulation was also noted in the liver (Choi et al. Citation2010). Very recently, severe damage to the liver and spleen was noted in Nile tilapia exposed to AgNP (via peritoneal injection) (Thummabancha et al. Citation2016); this outcome suggested to us that AgNP may also accumulate in these sites in tilapia exposed by intraperitoneal injection.
Hematological parameters are also important measures reflective of fish health status (Cheraghi et al. Citation2013; Imani et al. Citation2015). Shaluei et al. (Citation2013) conducted subacute toxicity studies of AgNP on silver carp and found that RBC and %Hct levels in exposed hosts were significantly lowered after a week. Imani et al., (Citation2015) reported a decrease in %Hct levels in rainbow trout after 8 days of AgNP exposure. Likewise, %Hct and the levels of RBC after AgNP exposure in the tilapia were significantly decreased from Weeks 1–8. Hematotoxic effects of AgNP have been reported not only in lower but also in higher vertebrates (i.e. rodents). Cheraghi et al. (Citation2013) conducted a 15-day oral dosing of rats with AgNP solution and found RBC and %Hct levels were significantly decreased. AgNP are believed to exert these types of toxicity by inducing ROS (Hussain et al. Citation2005; Wise et al. Citation2010; Foldbjerg et al. Citation2011; Chairuangkitti et al. Citation2013) that destroy membrane integrity (Mohanty et al. Citation2014). Cheraghi et al. (Citation2013) also found decreased amount of WBCs in the treated rats.
While a drop in WBC levels alone might be suggestive of potential immunomodulation in an AgNP-exposed host, phagocytic activity is a commonly-used parameter to evaluate immunotoxic potentials of chemicals (Fournier et al. Citation2000). In healthy Nile tilapia, the normal range of phagocytic activity is 15–18% (El-Hawarry Citation2011; Suwannasang et al. Citation2014); here, the activity of control fish cells was less than the normal range – an outcome likely attributable to the weights of fingerlings here being only ≈ 30 g. In the present study, it was clearly shown that phagocytosis by Nile tilapia phagocytes was significantly disturbed in a chronic manner (1–8 weeks). The evaluated parameters (i.e. %PI, PA, PE) were each significantly lowered by exposure to 1 or 100 mg AgNP/kg. This showed that phagocytosis was sensitive to impairment by AgNP even at a low concentration (1 mg/kg) in these potential sentinel hosts.
The effects of AgNP on mouse RAW 264.7 monocytes revealed that particles could induce necrosis and caspase-1 activity (Orłowski et al. Citation2012), events that would impact on any phagocytic measures. Liu et al. (Citation2013) found that phagocytic activity of rat alveolar macrophages exposed to AgNP significantly declined in a concentration-related manner in parallel with decreases in cell viability. Aboud (Citation2010) found that phagocytic activity in Nile tilapia was dramatically decreased in metal-exposed fish. Rault et al. (Citation2013), monitoring effects of various heavy metals (cadmium, lead, mercury, silver) on phagocytic activity in the bivalve Mytilus edulis found that silver ions induced decreased phagocytosis. Those findings, in conjunction with the present ones with Nile tilapia, indicate that both Ag ions and AgNP have a strong capacity to lower phagocytic activity in immune cells of exposed hosts.
Here, specific immune responses in fish exposed to AgNP were also evaluated by monitoring serum antibody titer against an antigen, FASA. Varying levels of antibodies were noted at different times in each group of tilapia immunized with FASA and concurrently treated with AgNP. This indicated antibody production may be impacted on by AgNP. In the current study, surprisingly, vaccinated fish simultaneously induced by 1 mg AgNP/kg had significantly greater antibody titers after the first immunization (at Week 2), while the other groups exhibited lower values. Conversely, after the booster vaccination, titers in the positive control (vaccinated with no AgNP) and in fish treated with 100 mg AgNP/kg were now the most elevated (i.e. at Weeks 6 and 7). These outcomes suggested to us that AgNP may induce specific immune responses of fish might induce differential effects based primarily upon initial dosage. Further investigation is warranted to clarify this matter.de Jong et al. (Citation2013) injected rats with different size AgNP (20 and 100 nm) and found that among a wide variety of immune system alterations that were noted, levels of circulating IgM and IgE (nonspecific forms, antigenic targets not determined) were significantly increased. These elevated levels suggested to the authors that proliferation of B-cells (and T-cells) had increased, the former consistent with an increase in spleen weights that was also noted in these hosts. Based on the antibody study here, though monocytes isolated from tilapia peripheral blood had decreased phagocytic activity, these fish were still able to produce antibodies. It could be then that host B- and T-cells retained potential roles in antigen processing and epitope recognition/B-cell triggering and even that some tissue macrophages may have been able to retain phagocytic/antigen-presenting capacities – dependent on the dose of AgNP faced. Indeed, the current results indicated that at low(er) doses, AgNP was less immunotoxic to Nile tilapia while at higher doses the particles appeared innately immunosuppressive.
Conclusions
Nile tilapia exposed to AgNP clearly exhibit toxic responses as demonstrated by changes in several indices, including in MT gene expression, hematology, and immune parameters (both innate and specific immunity). The current studies also indicate that at low(er) doses, AgNP may be less (immuno-/hemato-) toxic in Nile tilapia while at higher doses the particles appear to be impart nonspecific immunosuppressive and hematotoxic effects. Data obtained in this study strongly support the use of Nile tilapia as an animal model to potentially serve as bioindicator of environment contamination (specifically freshwaters) caused by AgNP.
However, we want to be very clear that these studies were performed using AgNP that were injected. Accordingly, translational studies wherein these fish are exposed solely by placement in AgNP-contaminated waters (to allow for dermal, gill, and/or ingestion exposures) are needed to substantiate the findings here and to confirm the potential utility of the tilapia for field studies.
Disclosure statement
The authors declare no conflicts of interest. The authors alone are responsible for the content of this manuscript.
References
- Aboud O. 2010. Impact of pollution with lead, mercury and cadmium on the immune response of Oreochromis niloticus. NY Sci J. 3:12–16.
- Bahnasawy M, El-Ghobashy A, Abdel-Hakim N. 2009. Culture of the Nile tilapia (Oreochromis niloticus) in a re-circulating water system using different protein levels. Egypt Aquat Biol Fish. 13:1–15.
- Benn T, Westerhoff P. 2008. Nanoparticle silver released into water from commercially available sock fabrics. Environ Sci Technol. 42:4133–4139.
- Bilberg K, Malte H, Wang T, Baatrup E. 2010. Silver nanoparticles and silver nitrate cause respiratory stress in Eurasian perch (Perca fluviatilis). Aquat Toxicol. 96:159–165.
- Chae Y, Pham C, Lee J, Bae E, Yi J, Gu M. 2009. Evaluation of the toxic impact of silver nanoparticles on Japanese medaka (Oryzias latipes). Aquat Toxicol. 94:320–327.
- Chairuangkitti P, Lawanprasert S, Roytrakul S, Aueviriyavit S, Phummiratch D, Kulthong K, Chanvorachote P, Maniratanachote R. 2013. Silver nanoparticles induce toxicity in A549 cells via ROS-dependent and ROS-independent pathways. Toxicol In Vitro. 27:330–338.
- Cheraghi J, Hosseini E, Hoshmandfar R, Sahraei R. 2013. Hematologic parameters study of male and female rats administered different concentrations of silver nanoparticles. Int J Agric Crop Sci. 5:789–796.
- Choi J, Kim S, Ahn J, Youn P, Kang J, Park K, Yi J, Ryu D. 2010. Induction of oxidative stress and apoptosis by silver nanoparticles in the liver of adult zebrafish. Aquat Toxicol. 100:151–159.
- de Jong W, van der Ven L, Sleijffers A, Park M, Jansen E, van Loveren H, Vandebriel R. 2013. Systemic and immunotoxicity of silver nanoparticles in an intravenous 28 days repeated dose toxicity study in rats. Biomaterials. 34:8333–8343.
- Doherty V, Ogunkuade O, Kanife U. 2010. Biomarkers of oxidative stress and heavy metal levels as indicators of environmental pollution in some selected fishes in Lagos, Nigeria. Am Eurasian J Agric Environ Sci. 7:359–365.
- El-Hawarry W. 2011. Biochemical and nonspecific immune parameters of healthy Nile tilapia (Oreochromis niloticus), blue tilapia (Oreochromis aureus) and their inter-specific hybrid (male O. Aureus × female O. Niloticus) maintained in semi-intensive culture system. Online J Animal Feed Res. 2:84–88.
- Fabrega J, Luoma S, Tyler C, Galloway T, Lead J. 2011. Silver nanoparticles: Behavior and effects in the aquatic environment. Environ Intl. 37:517–531.
- Foldbjerg R, Dang D, Autrup H. 2011. Cytotoxicity and genotoxicity of silver nanoparticles in the human lung cancer cell line, A549. Arch Toxicol. 85:743–750.
- Fournier M, Cyr D, Blakley B, Boermans H, Brousseau P. 2000. Phagocytosis as a biomarker of immunotoxicity in wildlife species exposed to environmental xenobiotics. Amer Zool. 40:412–420.
- Gunasekaran T, Nigusse T, Dhanaraju M. 2011. Silver nanoparticles as real topical bullets for wound healing. J Am Coll Clin Wound Spec. 3:82–96.
- Hadrup N, Lam H. 2014. Oral toxicity of silver ions, silver nanoparticles and colloidal silver-a review. Regul Toxicol Pharmacol. 68:1–7.
- Hsin Y, Chen C, Huang S, Shih T, Lai P, Chueh P. 2008. The apoptotic effect of nano-silver is mediated by a ROS- and JNK-dependent mechanism involving mitochondrial pathway in NIH3T3 cells. Toxicol Lett. 179:130–139.
- Hussain S, Hess K, Gearhart J, Geiss K, Schlager J. 2005. In vitro toxicity of nanoparticles in BRL 3A rat liver cells. Toxicol In Vitro. 19:975–983.
- Imani M, Halimi M, Khara H. 2015. Effects of silver nanoparticles (AgNP) on hematological parameters of rainbow trout, Oncorhynchus mykiss. Comp Clin Pathol. 24:491–495.
- Jeong Y, Lim D, Choi J. 2014. Assessment of size-dependent antimicrobial and cytotoxic properties of silver nanoparticles. Adv Mater Sci Eng. 2014:1–6.
- Koenigsknecht J, Landreth G. 2004. Microglial phagocytosis of fibrillar beta-amyloid through a beta1 integrin-dependent mechanism. J Neurosci. 24:9838–9846.
- Kwon S, Nam Y, Kim S, Kim K. 2006. Protection of tilapia (Oreochromis mosambicus) from edwardsiellosis by vaccination with Edwardsiella tarda ghosts. Fish Shellfish Immunol. 20:621–626.
- Lam K, Ko P, Wong J, Chan K. 1998. Metal toxicity and metallothionein gene expression studies in common carp and tilapia. Mar Environ Res. 46:563–566.
- Lap A, Lam V, Chan K, Chan K. 2005. Tilapia metallothionein genes: PCR-cloning and gene expression studies. Biochim Biophys Acta. 1731:191–201.
- Liu H, Yang D, Yang H, Zhang H, Zhang W, Fang Y, Lin Z, Tian L, Lin B, Yan J, et al. 2013. Comparative study of respiratory tract immune toxicity induced by three sterilization nanoparticles: Silver, zinc oxide and titanium dioxide. J Hazard Mater. 248:478–486.
- Livak K, Schmittgen T. 2001. Analysis of relative gene expression data using real-time quantitative PCR and the 2-ΔΔCT method. Methods. 25:402–408.
- Lynes M, Hidalgo J, Manso Y, Devisscher L, Laukens D, Lawrence D. 2014. Metallothionein and stress combine to affect multiple organ systems. Cell Stress Chaperones. 19:605–611.
- Mohanty J, Nagababu E, Rifkind J. 2014. Red blood cell oxidative stress impairs oxygen delivery and induces red blood cell aging. Front Physiol. 5:84. doi: 10.3389/fphys.2014.00084.
- Mussali-Galante P, Tovar-Sánchez E, Valverde M, Rojas Del Castillo E. 2013. Biomarkers of exposure for assessing environmental metal pollution: From molecules to ecosystems. Rev Intl Contam Ambiental. 29:117–140.
- Orłowski P, Krzyżowska M, Winnicka A, Chwalibóg A, Sawosz E. 2012. Toxicity of silver nanoparticles in monocytes and keratinocytes: Potential to induce inflammatory reactions. Centr Eur J Immunol. 37:123–130.
- Pham C, Yi J, Gu M. 2012. Biomarker gene response in male medaka (Oryzias latipes) chronically exposed to silver nanoparticle. Ecotoxicol Environ Saf. 78:239–245.
- Platonova T, Pridvorova S, Zherdev A, Vasilevskaya L, Arianova E, Gmoshinski I, Khotimchenko S, Dzantiev B, Popov V, Tutelyan V. 2013. Identification of silver nanoparticles in the small intestinal mucosa, liver, and spleen of rats by transmission electron microscopy. Bull Exp Biol Med. 155:236–241.
- Puangkaew J, Kiron V, Somamoto T, Okamoto N, Satoh S, Takeuchi T, Watanabe T. 2004. Nonspecific immune response of rainbow trout (Oncorhynchus mykiss Walbaum) in relation to different status of vitamin E and highly unsaturated fatty acids. Fish Shellfish Immunol. 16:25–39.
- Rault P, Fortier M, Pédelucq J, Lacaze E, Brousseau P, Auffret M, Fournier M. 2013. Immunotoxicity of heavy metals (silver, cadmium, mercury, lead) on marine bivalve Mytilus edulis: In vitro exposure of hemocytes. J Xenobiotics. 3:8. doi: 10.4081/xeno.2013.s1.e8.
- Roy U, Chattopadhyay B, Datta S, Mukhopadhyay S. 2011. Metallothionein as a biomarker to assess the effects of pollution on Indian major carp species from wastewater-fed fishponds of east Calcutta wetlands (a Ramsar site). Environ Res Eng Manag. 4:10–17.
- Sarkar B, Jaisai M, Mahanty A, Panda P, Sadique M, Nayak B, Gallardo G, Thakur D, Bhattacharjee S, Dutta J. 2015. Optimization of sublethal dose of silver nanoparticle through evaluating its effect on intestinal physiology of Nile tilapia (Oreochromis niloticus L.). J Environ Sci Health. 50:814–823.
- Shaluei F, Hedayati A, Jahanbakhshi A, Kolangi H, Fotovat M. 2013. Effect of subacute exposure to silver nanoparticle on some hematological and plasma biochemical indices in silver carp (Hypophthalmichthys molitrix). Human Exp Toxicol. 32:1270–1277.
- Shaw B, Handy R. 2011. Physiological effects of nanoparticles on fish: A comparison of nanometals versus metal ions. Environ Int. 37:1083–1097.
- Suwannasang A, Dangwetngam M, Issaro A, Phromkunthong W, Suanyuk N. 2014. Pathological manifestations and immune responses of serotypes Ia and III Streptococcus agalactiae infections in Nile tilapia (Oreochromis niloticus). Songklan J Sci Technol. 36:499–506.
- Teodoro J, Simões A, Duarte F, Rolo A, Murdoch R, Hussain S, Palmeira C. 2011. Assessment of the toxicity of silver nanoparticles in vitro: A mitochondrial perspective. Toxicol In Vitro. 25:664–670.
- Thirumoorthy N, Manisenthil Kumar KT, Shyam Sundar A, Panayappan L, Chatterjee M. 2007. Metallothionein: An overview. World J Gastroenterol. 13:993–996.
- Thummabancha K, Onparn N, Srisapoome P. 2016. Molecular characterization and expression analyses of cDNAs encoding the thioredoxin-interacting protein and selenoprotein P genes and histological changes in Nile tilapia (Oreochromis niloticus) in response to silver nanoparticle exposure. Gene. 577:161–173.
- Wijnhoven S, Peijnenburg W, Herberts C, Hagens W, Oomen A, Heugens E, Roszek B, Bisschops J, Gosens I, van De Meent D, et al. 2009. Nano-silver – a review of available data and knowledge gaps in human and environmental risk assessment. Nanotoxicology. 3:109–138.
- Wise J, Goodale B, Wise S, Craig G, Pongan A, Walter R, Thompson W, Ng A, Aboueissa A, Mitani H, et al. 2010. Silver nanospheres are cytotoxic and genotoxic to fish cells. Aquat Toxicol. 97:34–41.
- Yeo M, Kang M. 2008. Effects of nanometer-sized silver materials on biological toxicity during zebrafish embryogenesis. Bull Korean Chem Soc. 29:1179–1184.
- Yousefian M, Payam B. 2012. Effects of nanochemical particles on some histological parameters of fish. Adv Environ Biol. 6:1209–1215.