
Abstract
The anti-microbial compound triclosan is incorporated into numerous consumer products and is detectable in the urine of 75% of the general United States population. Recent epidemiological studies report positive associations with urinary triclosan levels and allergic disease. Although not sensitizing, earlier studies previously found that repeated topical application of triclosan augments the allergic response to ovalbumin (OVA) though a thymic stromal lymphopoietin (TSLP) pathway in mice. In the present study, early immunological effects following triclosan exposure were further evaluated following topical application in a murine model. These investigations revealed abundant expression of S100A8/A9, which reportedly acts as an endogenous ligand for Toll-like Receptor 4 (TLR4), in skin tissues and in infiltrating leukocytes during topical application of 0.75–3.0% triclosan. Expression of Tlr4 along with Tlr1, Tlr2 and Tlr6 increased in skin tissues over time with triclosan exposure; high levels of TLR4 were expressed on skin-infiltrating leukocytes. In vivo antibody blockade of the TLR4/MD-2 receptor complex impaired local inflammatory responses after four days, as evidenced by decreased Il6, Tnfα, S100a8, S100a9, Tlr1, Tlr2, Tlr4 and Tlr6 expression in the skin and decreased lymph node cellularity and production of IL-4 and IL-13 by lymph node T-cells. After nine days of triclosan exposure with TLR4/MD-2 blockade, impaired T-helper cell type 2 (TH2) cytokine responses were sustained, but other early effects on skin and lymph node cellularity were lost; this suggested alternative ligands/receptors compensated for the loss of TLR4 signaling. Taken together, these data suggest the S100A8/A9-TLR4 pathway plays an early role in augmenting immunomodulatory responses with triclosan exposure and support a role for the innate immune system in chemical adjuvancy.
Introduction
Triclosan is a low molecular weight anti-microbial found in numerous consumer products such as hand soaps, lotions, and toothpaste, and is incorporated into items such as kitchen utensils, clothing, furniture, and medical devices. It is so ubiquitous, 75% of the general United States population have detectable levels in their urine (Calafat et al. Citation2008). Healthcare workers that use triclosan-containing hand soaps in hospitals are found to have increased urinary triclosan levels (MacIsaac et al. Citation2014), suggesting occupational settings are a relevant site of exposure. Over the last five years, epidemiological studies have identified positive correlations between urinary levels of triclosan and sensitization to food, aeroallergens and asthma perturbations (Clayton et al. Citation2011; Savage et al. Citation2012, Citation2014; Bertelsen et al. Citation2013; Spanier et al. Citation2014). Our laboratory has found that topical skin application of triclosan augments allergic responses in a mouse ovalbumin (OVA) asthma model and although it does not act as an allergic sensitizer (Anderson et al. Citation2012, Citation2015), it can induce expression of the cytokine thymic stromal lymphopoietin (TSLP) in the skin tissue that augments IL-4+ IL-13+ T-helper cell type 2 (TH2) immune responses (Marshall et al. Citation2015). It was also recently shown that IgE and IgG1 responses after epicutaneous sensitization to peanut were augmented in mice with co-application of 1% triclosan (Tobar et al. Citation2016). With increasing reports that exposure to anti-microbial chemicals has the potential to induce or augment allergic disease, further studies are needed to help identify the mechanisms by which this occurs to help understand ways to prevent or circumvent these effects.
The present study sought to identify innate immune factors induced in the skin during repeated triclosan exposure that may augment subsequent adaptive allergic responses. The results indicated that repeated topical application of triclosan induced expression of S100A8 (MRP-8; calgranulin A) and S100A9 (MRP-14; calgranulin B). These small calcium-binding proteins fall under the category of alarmins, or damage-associated molecular pattern proteins (DAMP) that are released by activated or damaged cells. They can exist as both homodimers and S100A8/A9 heterodimers also referred to as calprotectin. With increasing concentrations of calcium, their target protein binding sites are revealed, where they can act as pro-inflammatory factors in innate immunity as well as broad-spectrum antimicrobials through sequestration of Zn2+ and Mn2+ (Zackular et al. Citation2015).
Interestingly, some of the functional effects of S100A8/A9 have been demonstrated to involve binding and activating of Toll-like receptor 4 (TLR4)-Myd88 signaling. TLR4 is best known for recognizing lipopolysaccharide (LPS) expressed on the outer membrane of Gram-negative bacteria. It forms a complex with myeloid differentiation protein-2 (MD-2) that helps to facilitate clustering and internalization of the TLR4 receptor (Shimazu et al. Citation1999; Kobayashi et al. Citation2006). This TLR4/MD-2 complex is expressed by multiple cell types including endothelial, epithelial and myeloid cells. Because the TLR4 pathway has been shown to play a role in allergic inflammation (Miller & Modlin Citation2007), the current study focused on identifying a potential role for the TLR4 pathway in augmenting immunomodulatory responses following triclosan exposure.
Materials and methods
Animals
BALB/cAnNTac mice (female, 6–8 week-of-age) were purchased from Taconic (Germantown, NY). This strain has a TH2 bias and is commonly used for investigations of allergic disease (Woolhiser et al. Citation2000). Mice were group-housed in sanitized HEPA-filtered cages containing sterilized hardwood chip bedding and nesting enrichment materials in the AAALAC-accredited NIOSH animal facility in Morgantown, WV. Mice were provided NIH-31 modified irradiated rodent diet (Harlan, Indianapolis, IN) and tap water ad libitum. Tissues were collected from the mice immediately after euthanasia by CO2 overdose. All animal procedures were reviewed and approved by the NIOSH Animal Care and Use Committee.
Animal procedures
Triclosan (Calbiochem; CAS number 3380-34-5) was dissolved in acetone (Sigma, St. Louis, MO) as a percent solution (weight/volume). Concentrations and timepoints used in these studies were based on observations from previous studies (Marshall et al. Citation2015). Triclosan is typically incorporated into consumer products in the range from 0.03 to 1.0%; thus, the present study used a lower dose (0.75%) that falls within this range but does not produce overt skin irritation, as well as a high dose (3%) that produces transient irritation and more significant measurable effects.
Here, 25 μl of solution was pipetted onto the dorsal surface of each ear at 24-h intervals for the durations indicated. Purified azide-free anti-mouse TLR4/MD2 (clone MTS/510; BioLegend, San Diego, CA) or rat IgG2a isotype control antibodies (BioLegend) were diluted in phosphate-buffered saline (PBS, pH 7.4; USP grade) and injected intraperitoneally (200–250 μg/injection) at 2- or 3-day intervals as indicated.
Cell isolation
Lymph nodes
Superficial cervical (auricular) lymph nodes (LN) were collected, homogenized between frosted microscope slides, and viable cell counts performed on a Cellometer according to acridine orange/propidium iodide staining (Nexcelom, Lawrence, MA). The LN cells (5 × 10⁵) were then seeded into 96-well U-bottom plates with soluble anti-CD3 (5 μg/ml) and anti-CD28 (2 μg/ml) in complete RPMI media containing l-glutamine and HEPES (Cellgro, Manassas, VA) and supplemented with 7.5% fetal bovine serum (Hyclone, Logan, UT), 50 μM 1-mercapto-ethanol and penicillin-streptomycin (Sigma, St. Louis, MO). Cells were then incubated at 37 °C for 24 h in a humidified 5% CO2/95% air incubator before well supernatants were harvested and analyzed for cytokine expression using Flowcytomix bead assay kits (formerly eBioscience, San Diego, CA).
Ears
One ear from each mouse was mechanically disrupted on a TissueLyser II in digestion media containing collagenase and DNase (STEMCELL Technologies, Vancouver, Canada). Homogenized tissues were then digested in a shaking 37 °C waterbath (45 min). Tissues were then processed through 70-μm cell strainers and re-suspended in complete RPMI media. After counting, aliquots (2 × 10⁵ cells) were seeded into wells of 96-well U-bottom plates and incubated for 24 h in a 5% CO2–95% air humidified incubator.
Ear protein analyses
One ear per mouse was mechanically disrupted using a TissueLyser II (Qiagen, Valencia, CA) in T-PER protein extraction reagent (Thermo Fisher, Grand Island, NY). The soluble protein fraction was collected and quantified by BCA protein assay (Thermo Fisher).
SDS-Page and Western blotting
For SDS-PAGE, 50 μg protein from each sample and Precision Plus Protein™ All Blue Prestained Protein Standards (Bio-Rad, Hercules, CA) were separated over 15% polyacrylamide gels and detected with ImperialTM protein stain (Bio-Rad). For Western blotting analyses, ear tissue proteins (5 μg/lane) were separated by SDS-PAGE and transferred overnight onto nitro-cellulose membranes. The membranes were then incubated in Tris-buffered saline (TBS) blocking buffer containing 0.05% Tween-20 and 5% dry milk to mitigate nonspecific inter-actions. Thereafter, membranes were incubated with either anti-mouse S100A8 antibody or anti-mouse S100A9 antibody (R&D Systems, Minneapolis, MN) at a manufacturer-recommended concentration of 1 μg/ml blocking buffer. Membranes were then washed in TBS buffer containing 0.05% Tween-20 and incubated with anti-rat horseradish peroxidase (HRP) antibody (R&D Systems; 1:1000 dilution in blocking buffer). Ultimately, the membranes were developed using ECLTM Western blotting detection reagents (GE Healthcare, Pittsburgh, PA) and immunoreactive bands then detected by exposing the membranes to CL-XPosureTM film (Thermo Fisher).
Mass spectrometry
Select protein bands were first excised from SDS-PAGE gels. Spots were de-stained, reduced, alkylated and digested with porcine trypsin (Sigma) according to the method of by Shevchenko et al. (Citation2006). Specifically, digested proteins were subjected to ultra-performance liquid chromatography (UPLC) on a nanoAcquity system (Waters, Milford, MA). Eluent from the nanoUPLC system was directed to the positive nanoelectrospray (+nanoESI) source of a Synapt quadrupole time-of-flight mass spectrometer (qTOF MS). Multiplexed tandem mass spectra were then acquired in “MSe” fashion and data were analyzed using ProteinLynx Global Server v 2.5.1 (Waters, Milford, MA) to search the entire non-redundant SwissProt protein database (www.uniprot.org). The search was constrained by using 20 ppm mass accuracy (m/Δm), carbamidomethyl cysteine as a fixed modification, trypsin as enzyme and a minimum of two peptides to match. Unmatched de novo peptide sequences were scanned against SwissProt using the PAM30MS scoring matrix.
Luminex
For this assay, 25 μg tissue lysate or supernatants of leukocytes isolated from the ear tissue (diluted 1:5) were analyzed for S100A8 and S100A9 expression by a luminex assay according to manufacturer instructions (R&D Systems) on a Luminex 200 system (Millipore, Billerica, MA). Results are presented as mean fluorescence intensity (MFI) for tissue lysates or pg/ml for supernatants.
RT-PCR
Tissues were mechanically disrupted on a TissueLyser II in Buffer RLT (ears) or Qiazol (LN) (Qiagen, Valencia, CA). Total RNA was extracted using Qiagen RNeasy mini-spin column kit with DNase treatment (ears) or a Qiagen miRNeasy kit (LN) on a QIAcube work station. RNA levels and purity were analyzed on a NanoDrop spectrophotomer (Thermo Fisher). The cDNA (1–2 μg) was prepared on an Eppendorf Mastercycler using a High Capacity Reverse Transcription kit (Thermo Fisher). The cDNA was used as template for real-time PCR reactions containing TaqMan PCR Master Mix with gene-specific primers (Thermo Fisher) on a 7500 Real-Time PCR System (Thermo Fisher). Relative fold-gene expression changes (2−ΔΔCT) was determined compared to acetone controls unless otherwise indicated and normalized for expression of housekeeping gene Actb.
Flow cytometry
Cells were re-suspended in staining buffer (PBS +1% bovine serum albumin +0.1% sodium azide) containing Fc receptor blocking antibody anti-mouse CD16/32 (clone 2.4G2; BD Biosciences, San Jose, CA). Cells were next suspended in staining buffer containing fluorochrome-conjugated antibodies recognizing cell surface epitopes in different combinations that included: CD45-Allophycocyanin, CD8-V500 (BD Biosciences), CD45R-Alexa Fluor® 488, MHC II-Alexa Fluor® 700, CD11b-PerCP-Cy5.5 (eBioscience, San Diego, CA), CD4-Brilliant Violet 421®, TLR4-Phycoerythrin and IL-4Rα-Phycoerythrin (BioLegend, San Diego, CA). Cells were then washed in staining buffer and fixed in Cytofix Buffer (BD Biosciences). For intracellular Phospho-STAT6-Phycoerythrin staining, cells were first cultured in compete media for 90 min with or without recombinant interleukin (IL)-4 (5 ng/ml; BD Biosciences) and then immediately fixed in Phos-flow fix buffer (37 °C) for 15 min and permeabilized overnight in Perm Buffer III (−20°C) (BD Biosciences) prior to staining. For each evaluation, 100,000 events were analyzed on an LSR II flow cytometer (BD Biosciences). Compensation controls were prepared with OneComp eBeads (eBioscience). All data analyzes were performed using FlowJo 7.6.5 software (TreeStar Inc., Ashland, OR).
Statistical analyses
One- or two-way analysis of variance (ANOVA) of log-transformed data followed by Fisher’s Least Significant Difference (LSD) or Tukey’s HSD post-hoc tests were performed as indicated using JMP software (SAS Institute, Cary, NC) with an α level of 0.05. All data shown are the means ± SEM.
Results
Repeated topical application of triclosan induces S100A8/A9 expression in skin tissue
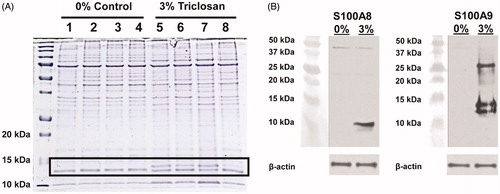
Proteins in the soluble fractions of lysates prepared from ear tissue of mice treated daily for 10 days with acetone control or 3% triclosan and resolved them by SDS-PAGE gel electrophoresis were evaluated for initial investigations into the innate immune factors with repeated exposures. An abundant protein band with an approximate molecular mass of 13 kDa was identified in the skin tissue of triclosan-treated mice (, black rectangle). Tandem mass spectrometric analysis identified this band to be calcium-binding protein S100A9. Two immunoreactive bands were further resolved by Western blot analysis for S100A9, likely reflecting different post-translational modifications (). A third band was also detected at ≈ 27 kDa, the predicted size of intact S100A9 homodimers or heterodimer. As S100A9 can form heterodimers with S100A8, immunoblotting for S100A8 revealed a band of the expected 10 kDa size in triclosan-treated mice. These results demonstrate that repeated topical skin application of triclosan can induce the expression of S100A8/A9 proteins.
Figure 1. Repeated topical application of triclosan induces the expression of S100A8 and S100A9 in skin tissue. (A) Protein standards (first lane) and protein lysates prepared from ear tissues (n = 4 mice) treated with 0% (acetone) control (lanes 1–4) or 3% triclosan (lanes 5–8) once daily for 10 days. (B) Western blot analysis of S100A8 and S100A9 proteins in ear tissue.
Expression kinetics of S100A8/A9 in the skin tissue during repeated triclosan exposure was next evaluated. S100a8 and S100a9 transcripts were measured over the course of 12 days of daily topical application of 0%, 0.75% or 3.0% triclosan. Both S100a8 and S100a9 transcripts were significantly increased by Day 4 (3%) or Day 6 (0.75%) in triclosan-treated mice compared to in 0% acetone controls. Relative levels of transcript continued to increase dose-dependently over time, peaking at levels >1000-fold for the 3% dose [compared to 0% acetone control] by Day 9 (). These effects were limited to the skin as we were not able to detect increases in S100a8 or S100a9 in the blood of mice exposed to triclosan at any time point (data not shown). Luminex® multiplex analysis of soluble proteins extracted from the ear tissue revealed S100A8/A9 protein expression was already significantly increased in the skin after only four days of 3% triclosan exposure () and remained significantly elevated through Day 12.
Figure 2. Expression kinetics of S100A8 and S100A9 in the skin tissue with repeated topical application of triclosan. (A) Relative fold-changes in gene expression in cDNA prepared from ear tissue of mice dosed daily with 0.75% (square) or 3% (triangle) triclosan relative to acetone control (n = 4 mice). (B) Mean fluorescence intensity of S100A8 and S100A9 protein expression in ear tissue of mice dosed daily with 0% (circle), 0.75% (square) or 3% (triangle) triclosan (n = 4–6 mice). (C) Concentrations of soluble proteins in supernatants from leukocytes extracted from ear skin tissue of mice dosed eight consecutive days with 0, 0.75, or 3.0% triclosan and cultured ex vivo for 24 h (n = 3–5 mice). ANOVA with Fisher’s LSD statistical analyses were performed; significant differences relative to 0% indicated as *p < .05, **p < .01, ***p < .001.
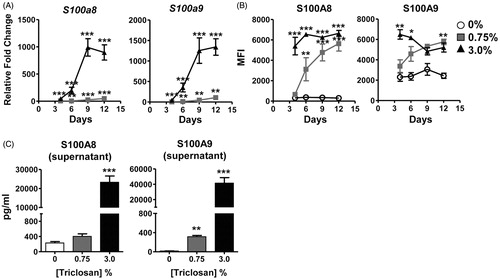
Leukocytes, isolated from skin tissue, were evaluated to determine if infiltrating cells were responsible for the increased expression observed at the early timepoints. Approximately half of the cells recovered were determined to be neutrophils (CD11b+ Ly6g+) after eight days of 3% triclosan exposure (data not shown). After 24 h of ex vivo culture, dose-dependent increases in S100A8 and S100A9 proteins were detected in supernatants (), suggesting infiltrating leukocytes are one of the sources of S100A8/9 in skin tissue during repeated triclosan exposure.
Changes in TLR expression in skin tissue with repeated triclosan exposure
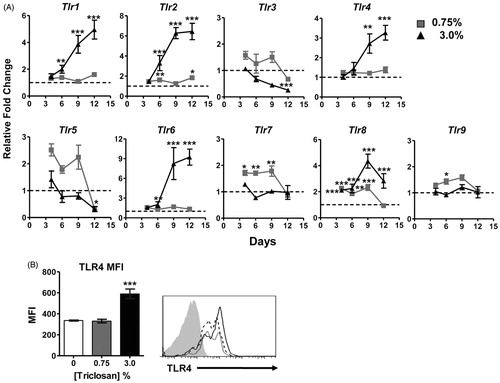
Expression kinetics of TLR in skin tissue were examined as the S100A8/A9 heterodimer has been described to act as an endogenous ligand for TLR4 (). Interestingly, the family of surface receptors that recognize bacterial ligands including Tlr1, Tlr2, Tlr4 and Tlr6 had similar expression kinetics, with significant increases over time with 3% triclosan exposure relative to acetone control. Small but significant increases in Tlr2 expression was also observed at the 0.75% concentration. Although some significant changes in gene expression following triclosan exposure were observed, the expression kinetics were different for the endosomal nucleic-acid sensing family of TLRs (TLR3, TLR7, TLR8, TLR9) suggesting these were differentially regulated in the skin tissue compared to the cell surface family of TLR. TLR4 was also highly expressed on skin-infiltrating CD45+ leukocytes, including neutrophils, with significant increases in expression following exposure to 3% triclosan (). No increases in TLR2 expression on leukocytes were detected and the expression of TLR4 and TLR2 were not increased on cells in the LN or spleen (data not shown).
Figure 3. Changes in TLR expression in the skin and infiltrating leukocytes with repeated topical application of triclosan. (A) Relative fold changes in gene expression in cDNA prepared from ear tissue of mice dosed daily with 0.75% (square) or 3% (triangle) triclosan relative to acetone control (n = 4 mice). (B) Mean fluorescence intensity of TLR4 expression on CD45+ cells isolated from ear tissue of mice dosed eight consecutive days with 0% (white), 0.75% (gray), or 3.0% (black) triclosan (B, left) (n = 3–5 mice). Representative staining histogram of TLR4 expression on CD45+ cells isolated from ear tissue of mice dosed daily for eight consecutive days with triclosan, 0% (gray), 0.75% (dotted), 3.0% (black) and isotype staining control (gray filled) (B, right). Two-way ANOVA with Fisher’s LSD statistical analyses were performed; significant differences relative to 0% indicated as *p < .05, **p < .01, ***p < .001.
TLR4/MD-2 antibody blockade decreases early inflammatory responses in skin with dermal triclosan exposure
Since robust increases in S100A8/A9 and TLR4 expression were identified, it was further investigated whether the TLR4 pathway was mediating immunomodulatory effects with repeated triclosan exposure. A blocking antibody that recognizes TLR4 and associated MD-2 molecule or an isotype control was administered during topical application of 0% or 3% triclosan (). The 3% dose was selected for these evaluations since the majority of changes were identified at this concentration. On Day 5, effects of triclosan and anti-TLR4/MD2 on molecular and cellular responses in the skin and LN were examined. Following four days of repeated triclosan exposure transcript levels of select Tlr and S100a8 and S100a9 were starting to increase, therefore the Day 5 timepoint was selected to evaluate early immunomodulatory effects.
Figure 4. TLR4/MD-2 antibody blockade impairs gene expression changes in skin tissue with repeated topical application of triclosan. (A) Timeline depicting administration of antibodies and topical application of triclosan to the mice. (B) Relative fold-changes in gene expression in cDNA prepared from ear tissue on Day 5 from mice treated with 3% triclosan/isotype control antibody (gray) or 3% triclosan/anti-TLR4/MD-2 (black) relative to acetone control (white) (n = 5 mice). ANOVA with Tukey’s HSD statistical analyses were performed; significant differences indicated as *p < .05, **p < .01, ***p < .001.
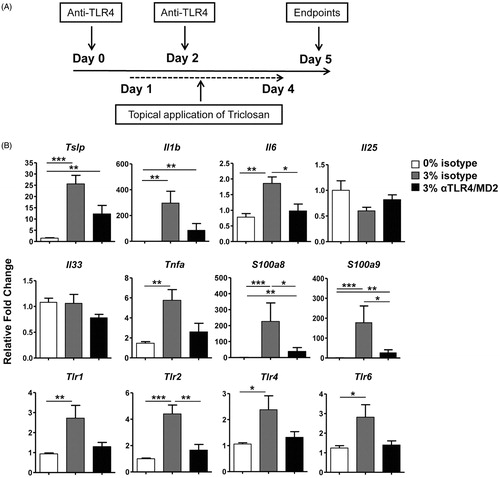
Repeated triclosan application induced significant increases in pro-inflammatory cytokines in the skin, including Tslp, Il1b, Il6 and Tnfa, with no significant effects on Il25 or Il33 relative to control (). Of these, Il6, S100a8, S100a9 and Tlr2 were significantly reduced after TLR4/MD-2 blockade compared to isotype control along with the loss of significant increases in Tnfa expression compared to acetone control. The expression of Tlr1, Tlr4 and Tlr6 were also no longer significantly increased relative to acetone control after TLR4/MD-2 blockade. Taken together, these results suggested that expression of the bacterial-sensing surface TLR family of receptors could be partially regulated through TLR4 signaling in skin tissue and that activation of the TLR4 pathway promoted early pro-inflammatory responses in skin tissue during triclosan exposure.
TLR4/MD-2 antibody blockade decreases early TH2 cytokine responses in LN with dermal triclosan exposure
Local draining LN was also examined to determine whether TLR4/MD-2 antibody blockade impaired localized immune responses induced with repeated triclosan application. A significant decrease in total LN cellularity for triclosan-exposed mice with anti-TLR4/MD-2 treatment compared to isotype control was identified (). Additional phenotyping revealed the significant decreases were not unique to one particular cell type as there were no changes in frequencies of different cell subsets (data not shown) and numbers of CD4 T-cells, CD8 T-cells, B-cells and dendritic cells (DC) were all significantly decreased with TLR4/MD-2 blockade ().
Figure 5. TLR4/MD-2 antibody blockade impairs immune responses in the local LN during repeated topical application of triclosan. Numbers of (A) viable cells and (B) leukocyte subsets collected from the LN of mice Day 5 treated with acetone/isotype (square), 3% triclosan/isotype (triangle) or 3% triclosan/anti-TLR4/MD-2 (circle) (n = 5 mice). (C) Concentrations of cytokines in supernatants from LN cells cultured 24 h ex vivo with anti-CD3/CD28. (D) Relative fold-changes in gene expression in cDNA prepared from ear tissue of mice treated with 3% triclosan/isotype control antibody (gray) or 3% triclosan/anti-TLR4/MD-2 (black) relative to acetone control (white). (E) Mean fluorescence intensity of IL-4Rα expression on LN leukocyte subsets. (F) Intracellular phosphorylated STAT6 expression in LN cells from mice treated with acetone/isotype (square), 3% triclosan/isotype (triangle) or 3% triclosan/anti-TLR4/MD-2 (circle) pulsed with IL-4 (5 ng/ml) (gray) or without (white). ANOVA with Fisher’s LSD statistical analyses were performed; significant differences indicated as *p < .05, **p < .01, ***p < .001.
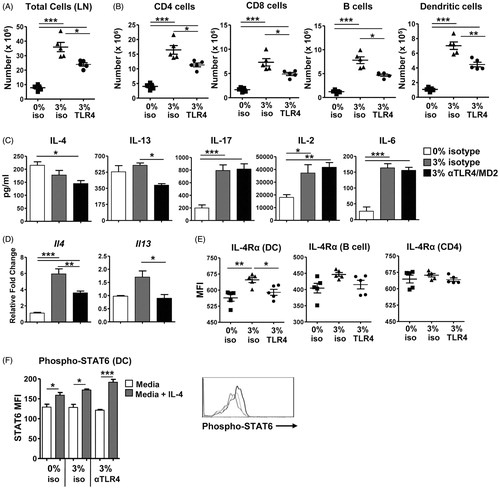
LN T-cells were also stimulated ex-vivo to reveal effects of triclosan and anti-TLR4/MD-2 blockade on T-cell cytokine production. Early significant increases in IL-2, -6 and -17 production following triclosan exposure were not affected by TLR4/MD-2 blockade (). Additional phenotyping revealed low CD67L and CCR7 expression on the T-cells (data not shown), suggesting the population consists of a heterogeneous mixture of primary effectors and effector memory T-cells of unknown antigen specificities. At this Day 5 timepoint, IL-4 and IL-13 were significantly increased at the transcript level with triclosan exposure and interestingly, the levels of IL-4 transcript and IL-13 transcript and protein were significantly decreased with TLR4/MD-2 blockade (). Other cytokines including interferon (IFN)-γ, IL-5, IL-10 and tumor necrosis factor (TNF)-α were also produced by LN T-cells but were not significantly affected by triclosan exposure or TLR4/MD-2 blockade (data not shown).
The phenotype of LN antigen-presenting cells was also examined. No differences in the expression of co-stimulatory markers CD80 and CD86 or MHC II on B-cells and DC were noted with TLR4/MD-2 blockade (data not shown). As the expression levels of IL-4 and IL-13 were significantly decreased, expression of their shared receptor subunit IL-4Rα was also examined. There was a small but significant decrease in IL-4Rα expression on DC with TLR4/MD-2 blockade, but no effect on expression on B-cells or CD4 T-cells was observed (). As shown in , LN cells from triclosan-exposed mice pulsed with IL-4 expressed increased levels of phosphorylated-STAT6 which is activated downstream of IL-4Rα. Levels of phosphorylated STAT6 were equal to that of control cells suggesting that while blocking TLR4 signaling decreased the production of IL-4 and IL-13 in the LN, the cognate receptor signaling pathway was not impaired.
Impaired TH2 cytokine responses are sustained during extended triclosan dosing and TLR4/MD-2 blockade
Next, the effects of extended subchronic triclosan dosing with TLR4/MD-2 blockade were examined to determine whether the effects on the skin and LN could be sustained. Both an acetone control- and triclosan-treated group of mice received anti-TLR4/MD-2 antibody to control for any effects of extending blocking activity of TLR4. Mice were dosed for nine consecutive days with blocking antibody administered every third day (). Blocking TLR4/MD-2 in acetone control mice did not produce any measurable effects. Interestingly, the differences in gene expression in the skin tissue of the triclosan-treated mice that received anti-TLR4/MD-2 compared to isotype control on Day 5 () were no longer detected at Day 10 (Supplementary Figure 1A).
Figure 6. The effects of TLR4/MD-2 antibody blockade on the LN with extended triclosan dosing. (A) Timeline depicting administration of antibodies and topical application of triclosan to the mice. (B) Numbers of viable cells collected from the LN of mice Day 10 treated with acetone/isotype (square), acetone/anti-TLR4 (triangle), 3% triclosan/isotype (circle) or 3% triclosan/anti-TLR4 (inverted triangle) (n = 4–6 mice). (C) Concentrations of cytokines in supernatants from LN cells cultured ex vivo for 24 h with anti-CD3/CD28. Two-way ANOVA with Fisher’s LSD post-hoc statistical analyses were performed; significant differences are indicated as a ≠ b where p < .05 and ***p < .001.
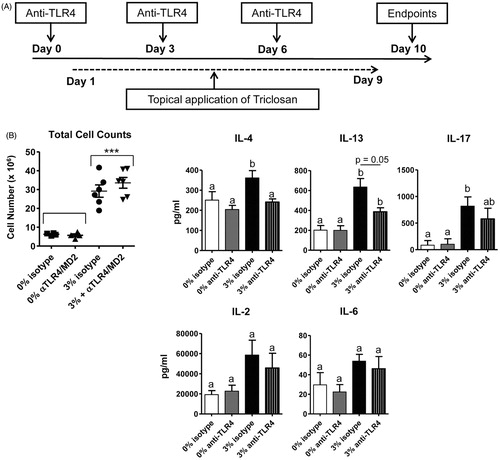
Examination of the LN at Day 10 revealed that the decreased cellularity with anti-TLR4/MD-2 treatment had also rebounded to equal numbers as isotype control in triclosan-exposed mice (), with no significant changes in frequencies or numbers of the LN cell subsets (data not shown). When the LN T-cells were stimulated ex vivo, the concentrations of IL-4, -13 and -17 in the supernatants were significantly elevated relative to acetone control (). Remarkably, the amounts of IL-4 and IL-13 produced by LN T-cells from triclosan-exposed mice still remained decreased after TLR4/MD-2 blockade (). Taken together, although early responses in skin and LN during triclosan exposure were impaired with TLR4/MD-2 blockade, these effects eventually rebound with the exception of impaired TH2 cytokine production that continued to persist.
Discussion
The goal of these studies was to identify innate immune factors induced in skin tissue with repeated triclosan exposure that may contribute to previously identified immunomodulatory responses. Large increases in S100A8/A9 protein expression – most likely due to infiltrating neutrophils along with de novo synthesis in the skin – were identified. S100A8/A9 protein expression increased very early before elevated transcript was measured suggesting infiltrating cells, in addition to local production were potential sources. Although keratinocytes are a known source of S100A8/A9, cells of myeloid lineage can constitutively express it and neutrophils were previously found to be a major cellular infiltrate in the triclosan-exposed mouse ear skin tissue (Marshall et al. Citation2015). Significant increases in S100A8/A9 expression with application of 0.75% triclosan, a concentration within the range found in consumer products (0.03–1.0%) was identified. Our studies previously found that repeated application of 0.75% triclosan did not cause overt irritation to the skin as can occur transiently with 3% triclosan (Marshall et al. Citation2015); yet, despite this, S100A8 and S100A9 expression reached similar levels with exposure to both concentrations. It should be noted that in addition to dermal exposure, there is also the potential for oral exposure. Studies conducted by Fang et al. (Citation2016) estimated using Elizabethan collars that 20% of a triclosan dermal dose was absorbed through oral exposure as a result of grooming.
Generally, S100A8/A9 is expressed at low levels in healthy epidermis but expression can be induced by disruptions of the skin barrier (Eckert et al. Citation2004). It is highly up-regulated in skin tissue after exposure to solar radiation, repeated Vaseline application or tape stripping (Marionnet et al. Citation2003). S100A8/A9 is a well characterized biomarker of inflammation (Ehrchen et al. Citation2009; Schiopu & Cotoi Citation2013); however, transgenic mice over-expressing activin A have high levels of S100A8/A9 in the epidermis in the absence of inflammation (Thorey et al. Citation2001). S100A8/A9 is thought to play an important role in skin diseases including psoriasis and lichen planus but is not associated with other skin conditions such as atopic dermatitis, uticaria, or granuloma annulare (Loser et al. Citation2010). Thus, expression of S100A8/A9 in skin tissue does not appear to be a prerequisite for inflammation – nor is it expressed with all inflammatory skin conditions, suggesting it may be involved in the immunomodulatory activity induced following dermal exposure to certain agents like triclosan that can act as allergic immune adjuvants.
The present study found that impairing TLR-4/MD-2 activity with in vivo administration of blocking antibody suppressed early responses in the skin tissue during triclosan exposure, including decreases in the expression of the cytokines Il-6 and Tnf-α. Induction of IL-6 and TNFα along with increases in cell proliferation have also been observed in human keratinocytes stimulated with S100A8/A9 (Nukui et al. Citation2008). Tlr1, Tlr2, Tlr4 and Tlr6 showed similar expression kinetics with repeated topical application of triclosan, and blocking TLR4 signaling impaired their expression on Day 5 of exposure. These data suggested that regulation of this family of bacteria-sensing surface receptors was closely connected and controlled in part through the TLR4 receptor signaling pathway. The lack of expression changes at sites other than the skin, suggested factors unique to the environment at the site of triclosan application promoted the recruitment of TLR4+ leukocytes and induce expression of TLR4 in the skin tissue.
With the robust increases in S100A8/A9, we postulate this is likely an important endogenous ligand activating the TLR4 pathway. Further, although significant increases in Tlr4 expression at the 0.75% dose were not observed, given that TLRs are constitutively expressed in dermal tissue, the robust increases in S100A8/A9 at this dose would still likely engage the TLR4 signaling pathway. Other endogenous ligands of TLR4 have been described including high mobility group box 1 (HMGB1) (Park et al. Citation2004) and methyl-CpG binding domain protein 2 (mBD2) (Biragyn et al. Citation2002). Thus, we cannot rule out that blocking TLR4 interactions with other ligands may also be producing immunomodulatory effects as well.
It is important to consider that commensal bacteria that inhabit the skin can be stripped away with exposure to antimicrobials. In mice, gram-negative bacteria represent a large portion of the commensal skin population that can be recognized by TLR4, along with populations of gram-positive bacteria that can be recognized by TLR2. Skin commensals can interact with the immune system (Naik et al. Citation2012); as such, alterations of the skin microbiome may produce immunomodulatory effects. Interestingly, allergic contact hypersensitivity (CHS) induced by 2,4,6-trinitro-1-chlorobenzene (TNCB) was shown to be ameliorated in the concomitant absence of TLR2 and TLR4 as well as IL-12Rβ2 and TLR4 but not in the absence of TLR4 alone (Martin et al. Citation2008). To determine a role for interactions with commensal bacteria, TNCB was then applied to the skin of germ-free (GF) mice which showed that CHS was induced in both wild-type GF mice as well as IL-12Rβ2−/− GF mice, but not in double-deficient TLR4−/− IL-12Rβ2−/− GF mice. This suggested an important role for interactions with endogenous ligands like S100A8/A9 in promoting CHS even in the absence of skin commensals.
Here, by Day 10, measurable differences in gene expression in the skin tissue after TLR4/MD-2 blockade compared to isotype control were no longer detected in triclosan-exposed mice. The loss of these effects suggests engagement of alternative and/or redundant receptor pathways are eventually sufficient to mediate the responses induced by repeated triclosan exposure. While some of the extracellular functions of S100A8/A9 are mediated through TLR4, effects have also been described through the engagement of the receptor for advanced glycation end-products (RAGE) which activates the MAP Kinase/NF-κB pathway (Zhong et al. Citation2015). In the skin, although levels of Rage were not affected by TLR4 blockade, relative levels of transcript eventually increased four-fold by Day 12 in triclosan-treated mice (Supplementary Figure 1B). However, a role for RAGE in the responses to triclosan has not yet been identified. Other pathways may also be activated. S100A9-induced airway inflammation in mice for example, was reported to occur independent of both RAGE and TLR4 signaling (Chen et al. Citation2015). Thus, the roles for the S100A8/A9-TLR4 axis in the modulation of immune responses are still not fully understood.
The present study found that engagement of the TLR4/MD-2 receptor helped to augment early inflammatory responses in the skin tissue as well as increases in IL-4 and IL-13 production by T-cells in the LN of triclosan-exposed mice. These findings provide additional insight into the immunomodulatory mechanisms of action following topical exposure to triclosan and suggest that components of the S100A8/A9-TLR4 pathway may be involved in previously-observed immune adjuvancy effects.
Supplementary Figure 1
Download TIFF Image (501.7 KB)Acknowledgements
The authors would like to thank Dr. Antonella Marrocco for her technical assistance and Dr. Michael Kashon for consulting on statistical analyses. The findings and conclusions in this report are those of the authors and do not necessarily represent the views of the National Institute for Occupational Safety and Health, Centers for Disease Control and Prevention.
Disclosure statement
The authors declare no conflicts of interest. The authors alone are responsible for the content of this manuscript.
Additional information
Funding
Related Research Data
References
- Anderson S, Franko J, Kashon M, Anderson K, Hubbs A, Lukomska E, Meade B. 2012. Exposure to triclosan augments the allergic response to ovalbumin in a mouse model of asthma. Toxicol. Sci. 132:96–106.
- Anderson S, Meade B, Long C, Lukomska E, Marshall N. 2015. Investigations of immunotoxicity and allergic potential induced by topical application of triclosan in mice. J Immunotoxicol. 13:165–172.
- Bertelsen R, Longnecker M, Lovik M, Calafat A, Carlsen K, London S, Lodrup Carlsen K. 2013. Triclosan exposure and allergic sensitization in Norwegian children. Allergy. 68:84–91.
- Biragyn A, Ruffini P, Leifer C, Klyushnenkova E, Shakhov A, Chertov O, Shirakawa A, Farber J, Segal D, Oppenheim J, et al. 2002. Toll-like receptor 4-dependent activation of dendritic cells by β-defensin 2. Science. 298:1025–1029.
- Calafat A, Ye X, Wong L, Reidy J, Needham L. 2008. Urinary concentrations of triclosan in the U.S. population: 2003–2004. Environ Health Perspect. 116:303–307.
- Chen B, Miller A, Rebelatto M, Brewah Y, Rowe D, Clarke L, Czapiga M, Rosenthal K, Imamichi T, Chen Y, et al. 2015. S100A9 induced inflammatory responses are mediated by distinct damage associated molecular patterns (DAMP) receptors in vitro and in vivo. PLoS One. 10:e0115828.
- Clayton E, Todd M, Dowd J, Aiello A. 2011. The impact of bisphenol A and triclosan on immune parameters in the U.S. population, NHANES 2003–2006. Environ Health Perspect. 119:390–396.
- Eckert R, Broome A, Ruse M, Robinson N, Ryan D, Lee K. 2004. S100 proteins in the epidermis. J. Invest Dermatol. 123:23–33.
- Ehrchen J, Sunderkotter C, Foell D, Vogl T, Roth J. 2009. The endogenous Toll-like receptor 4 agonist S100A8/S100A9 (calprotectin) as innate amplifier of infection, autoimmunity, and cancer. J Leukoc Biol. 86:557–566.
- Fang J, Vanlandingham M, da Costa G, Beland F. 2016. Absorption and metabolism of triclosan after application to the skin of B6C3F1 mice. Environ Toxicol. 31:609–622.
- Kobayashi M, Saitoh S, Tanimura N, Takahashi K, Kawasaki K, Nishijima M, Fujimoto Y, Fukase K, Akashi-Takamura S, Miyake K. 2006. Regulatory roles for MD-2 and TLR4 in ligand-induced receptor clustering. J Immunol. 176:6211–6218.
- Loser K, Vogl T, Voskort M, Lueken A, Kupas V, Nacken W, Klenner L, Kuhn A, Foell D, Sorokin L, et al. 2010. The toll-like receptor 4 ligands Mrp8 and Mrp14 are crucial in the development of autoreactive CD8+ T-cells. Nat Med. 16:713–717.
- MacIsaac J, Gerona R, Blanc P, Apatira L, Friesen M, Coppolino M, Janssen S. 2014. Healthcare worker exposures to the antibacterial agent triclosan. J Occup Environ Med. 56:834–839.
- Marionnet C, Bernerd F, Dumas A, Verrecchia F, Mollier K, Compan D, Bernard B, Lahfa M, Leclaire J, Medaisko C, et al. 2003. Modulation of gene expression induced in human epidermis by environmental stress in vivo. J Invest Dermatol. 121:1447–1458.
- Marshall N, Lukomska E, Long C, Kashon M, Sharpnack D, Nayak A, Anderson K, Meade B, Anderson S. 2015. Triclosan induces thymic stromal lymphopoietin in skin promoting TH2 allergic responses. Toxicol Sci. 147:127–139.
- Martin S, Dudda J, Bachtanian E, Lembo A, Liller S, Durr C, Heimesaat M, Bereswill S, Fejer G, Vassileva R, et al. 2008. Toll-like receptor and IL-12 signaling control susceptibility to contact hypersensitivity. J Exp Med. 205:2151–2162.
- Miller L, Modlin R. 2007. Toll-like receptors in the skin. Semin Immunopathol. 29:15.
- Naik S, Bouladoux N, Wilhelm C, Molloy M, Salcedo R, Kastenmuller W, Deming C, Quinones M, Koo L, Conlan S, et al. 2012. Compartmentalized control of skin immunity by resident commensals. Science. 337:1115–1119.
- Nukui T, Ehama R, Sakaguchi M, Sonegawa H, Katagiri C, Hibino T, Huh N. 2008. S100A8/A9, a key mediator for positive feedback growth stimulation of normal human keratinocytes. J Cell Biochem. 104:453–464.
- Park J, Svetkauskaite D, He Q, Kim J, Strassheim D, Ishizaka A, Abraham E. 2004. Involvement of toll-like receptors 2 and 4 in cellular activation by high mobility group box 1 protein. J Biol Chem. 279:7370–7377.
- Savage J, Matsui E, Wood R, Keet C. 2012. Urinary levels of triclosan and parabens are associated with aeroallergen and food sensitization. J Allergy Clin Immunol. 130:453–460.
- Savage J, Johns C, Hauser R, Litonjua A. 2014. Urinary triclosan levels and recent asthma exacerbations. Ann Allergy Asthma Immunol. 112:179–181.
- Schiopu A, Cotoi O. 2013. S100A8 and S100A9: DAMPs at the crossroads between innate immunity, traditional risk factors, and cardiovascular disease. Med Inflamm. 2013:828354.
- Shevchenko A, Tomas H, Havlis J, Olsen J, Mann M. 2006. In-gel digestion for mass spectrometric characterization of proteins and proteomes. Nat Protoc. 1:2856–2860.
- Shimazu R, Akashi S, Ogata H, Nagai Y, Fukudome K, Miyake K, Kimoto M. 1999. MD-2, a molecule that confers lipopolysaccharide responsiveness on Toll-like receptor 4. J Exp Med. 189:1777–1782.
- Spanier A, Fausnight T, Camacho T, Braun J. 2014. Associations of triclosan and paraben exposure with allergen sensitization and wheeze in children. Allergy Asthma Proc. 35:475–481.
- Thorey I, Roth J, Regenbogen J, Halle J, Bittner M, Vogl T, Kaesler S, Bugnon P, Reitmaier B, Durka S, et al. 2001. Ca2+-binding proteins S100A8 and S100A9 are encoded by novel injury-regulated genes. J Biol Chem. 276:35818–35825.
- Tobar S, Tordesillas L, Berin M. 2016. Triclosan promotes epicutaneous sensitization to peanut in mice. Clin Transl Allergy. 6:13.
- Woolhiser M, Munson A, Meade B. 2000. Comparison of mouse strains using the local lymph node assay. Toxicology. 146:221–227.
- Zackular J, Chazin W, Skaar E. 2015. Nutritional immunity: S100 proteins at the host-pathogen interface. J Biol Chem. 290:18991–18998.
- Zhong A, Xu W, Zhao J, Xie P, Jia S, Sun J, Galiano R, Mustoe T, Hong S. 2015. S100A8 and S100A9 are induced by decreased hydration in the epidermis and promote fibroblast activation and fibrosis in the dermis. Am J Pathol. 186:109–122.