
Abstract
The present study was designed to investigate any ameliorative effects of bentonite (BN) against immuno-pathological alterations induced by dietary aflatoxin B1 (AFB1) or ochratoxin A (OTA) in broiler chicks. In one experiment, AFB1 (0.1, 0.2 or 0.6 mg/kg feed) was fed alone and par alley with bentonite clay (3.7 or 7.5 g/kg feed) to the broilers. In the second experiment, the broilers were given feed contaminated with OTA (0.15, 0.3 or 1.0 mg/kg feed) alone and in combination with bentonite clay (3.7, 7.5, or 15 g/kg feed). Experimental feedings were continued for 42 days. At various time points along the feeding schedule, immune system organ histologic status, as well as host humoral and cellular immune responses, were evaluated in all groups. The dietary addition of AFB1 and OTA alone significantly reduced immune responses in the birds as assessed by histological changes in the bursa of Fabricius and thymus, antibody responses to SRBC, in-vivo lympho-proliferative responses to Phytohemagglutinin-P (PHA-P) and, phagocytic function in situ. The dietary addition of BN significantly ameliorated the immunotoxicity of 0.1 and 0.2 mg/kg dietary AFB1, however with a level of 0.6 mg AFB1/kg only partial amelioration was seen. The co-treatment of birds exposed to OTA with BN at all levels only partially alleviated deleterious effects on histology and immune responses. Taken together, the results here suggested to us that dietary addition of BN could help ameliorate AFB1-mediated immunotoxicities but could not afford such protection against OTA-induced immune damage.
Introduction
Mycotoxins are the group of secondary metabolites of toxigenic fungi that exert injurious effects to the health of humans and animals (Zain Citation2011). Hot and humid environment favor these mycotoxigenic fungi to invade growing crops in the field as pathogen and/or might grow as saprophyte during storage process (Akande et al. Citation2006). The fungal contamination of cereal crops during pre-harvest and post-harvest stages results in the accumulation of mycotoxins that can be potential risk to the health of the animals and human beings and also cause significant economic impact (Dinis et al. Citation2007).
More than 400 different types of mycotoxins are identified, of which aflatoxins (AF) and ochratoxins (OT) are the most important mycotoxins produced during favorable storage conditions. Aspergillus flavus and A. parasiticus produce AF while A. ochraceus, among several other Aspergilli and Penicillium spps produce OT (Gibson et al. Citation1990). Aflatoxin B1 (AFB1) has been designated as Group 1 carcinogen by the International Agency for Research on Cancer (IARC Citation1993) as it can enhance carcinogenic outcomes in individuals suffering from hepatitis B infection (Abdel-Wahhab et al. Citation2007; Tejada & Rustia Citation2011). In avian hosts, various forms of AF suppress the size of immune system organs and severely affect macrophage functions, activity of T-lymphocytes, and cytokine expression, factors that likely contribute to observations reductions in production of immunoglobulin in the exposed hosts; these changes likely underlie reduced vaccine efficacy and increased persistence of pathogens in AF-exposed hosts (Celik et al. Citation2000; ul-Hassan et al. Citation2012; Verma et al. Citation2004; Yunus et al. Citation2011).
Ochratoxins are natural contaminant of a wide variety of cereals and feed stuffs. Ochra-toxin A (OTA) is one of the three sub-groups of OT. OTA as been classified as the second most important mycotoxin after AFB1 due to toxicities (and associated economic losses) seen in many farm host species (Indresh & Umakantha Citation2013). IARC has denoted OTA as a Group 2B agent, i.e. a possible human carcinogen (IARC Citation1993). In avian species, experimental feeding of OTA at 0.5–2.0 mg/kg resulted in reduction in the size of the bursa of Fabricius, spleen and thymus (Kozaczynski Citation1994; Singh et al. Citation1990). In in vitro studies, OTA negatively influenced interleukin (IL)-2 production and proliferative abilities of B- and T-lymphocytes (Lea et al. Citation1989).
Bio-accumulation of AFB1 and OTA in edible tissues of poultry can result in carryover of each mycotoxin into the human food chain (Khan et al. Citation2013). Bentonite which comes from weathering of volcanic ash is a phyllosilicate and consists mostly of montmorillonite in its impure form (Adeyemo et al. Citation2015). The dietary addition of clay minerals or silicate materials like bentonite is the most widely-used practice to adsorb mycotoxins present in bird feed. The ability of these clays to bind mycotoxins varies depending to a great extent on the chemical properties of the target mycotoxin; Kabak et al. (Citation2006) suggested the use of such clays as mycotoxin-absorbents in the intestine. Binding ability is also impacted by the chemical nature of the clay, i.e. a product of their geographical origin (Magnoli et al. Citation2011). In Pakistan, silicate mineral reserves are most present in the Potohar plateau and Kashmir region. To date, these products have mostly been used for vegetable oil decontamination or to enhance oil transparency, color, and flavor.
In light of the above, the current study was undertaken to investigate potential ameliorative effects of graded dietary concentrations of locally-available bentonite clay (obtained from Potohar plateau region) against AFB1- and OTA-induced immunotoxicologic alterations in the broiler birds.
Materials and methods
Production of AFB1 and OTA
For the production of AFB1, pure cultures of A. flavus (NRRL 6540; CECT 2687) were used for the fermentation of 100 g long-grain Basmati rice (variety 335) in 1000 ml flat wide-bottom (Erlenmeyer) flasks, following the method of Shotwell et al. (Citation1966). After 6 days at 28 °C, AFB1 was extracted using chloroform and quantified according to of Association of Official Analytical Chemists (AOAC), Method #990.33.
OTA was produced by inoculating A. ochraceous (CECT 2948; Culture Collection Center, University De Valencia, Spain) suspension onto broken wheat grains (Trenk et al. Citation1971). After 14 days at 28 °C, OTA was extracted from the toxin-laden fermented wheat using acetonitrile: water (60:40, v/v) and quantified by following the method of Bayman et al. (Citation2002).
The bentonite (BN) used here was procured from the Potohar plateau (Punjab Province, Pakistan). The chemical composition of the material is provided in . The BN was ground with a pestle to obtain a fine powder for experimental use.
Table 1. Chemical composition of bentonite clay (BN).
All other chemicals used herein were obtained from Sigma (St. Louis, MO) unless else-wise indicated.
Preparation of experimental feeds
Basal broiler feed, comprised primarily of corn and soy meal having 22% total protein content and 3100 Kcal/kg metabolizable energy, was prepared without addition of any toxin binder, vitamins, minerals and antibiotics. The feed contains, specifically, 59.2% corn meal, 31.1% soybean meal, 2.0% wheat bran, 3.1% sunflower meal, 0.7% limestone, 0.5% calcium phosphate, 0.1% lysine, 0.2% methionine, 0.1% NaCl, 0.2% vegetable oil, and 2.9% choline chloride. Each batch of basal feed was subjected to mycotoxin analysis before use to ensure that AFB1, OTA, and zearalenone (a fusarium mycotoxin) levels were all at ≪1.0 μg/kg.
Mycotoxin-contaminated experimental feeds were prepared by incorporating known quantities of AFB1 and OTA in the basal feed following the method of Hussain et al. (Citation2010). For this purpose, desired quantities of fermented grains (rice for AFB1, wheat for OTA) with myco-toxigenic fungi were incorporated into the feed. Before incorporation, fermented grains were soaked overnight in a 3-fold quantity of chloroform (CHCl3) for extraction. The mixture was then filtered through cotton cheesecloth and resulting residues were again soaked in CHCl3 and filtered to ensure complete recovery of mycotoxins. The CHCl3 was evaporated under rotary evaporated and concentrated mycotoxins were re-suspended in 100 ml polyethylene glycol (PEG). The PEG suspension was initially sprinkled on 1–2 kg feed; this material was used as the mycotoxin-feed stock. Each stock was further diluted by adding various quantities of basal feed to obtain the desired final contamination level. Before feeding, mycotoxin levels in feed samples were confirmed by analyzing representative samples via HPLC. Average bird consumption levels were monitored on a daily basis by recording amounts of leftover feed in each group, subtracting this from the amount provided, and then dividing by the number of birds accessing the feed in a particular pen.
Birds
The experiments were conducted in accordance with all national legislations concerning protection of animal welfare and followed guidelines established by the University Directorate of Graduate Studies (DGS); the DGS approved all experimental protocols.
A total of 840 broiler chicks (1-day-old) were procured from a local commercial hatchery and were maintained on rice husk litter under standard housing conditions (ambient temperature (33 °C) with a 35–45% relative humidity) for the first week. The chicks were provided ad libitum access to basal broiler feed and water. After two days of acclimatization, the birds were randomly allocated into 28 groups (n = 30/group) for use in two experiments and offered feed contaminated with different doses of AFB1 or OTA, with and without addition of different levels of BN ().
Table 2. Treatment regimens.
In Experiment 1, the chicks were randomly divided into 12 groups (n = 30/group). Control birds were maintained on basal broiler feed; birds in groups A1, A2, and A3 were provided feed contaminated with 0.1, 0.2, or 0.6 mg AFB1/kg feed, respectively. Group B1 and B2 birds were fed basal diet spiked with 3.7 or 7.5 g BN/kg feed, respectively. Birds in groups A1B1, A2B1, and A3B1 were fed diet contaminated with AFB1 (0.1, 0.2, or 0.6 mg/kg feed, respectively) along with 3.7 g BN/kg feed. Similarly, for groups A1B2, A2B2 and A3B2, a second level of BN (7.5 g/kg feed) was concurrently fed with each of the three AFB1 levels.
In Experiment 2, chicks were divided into 16 groups having 30 birds each; three levels of BN and OTA were fed alone or concurrently in different combinations. The control group was offered basal broiler feed; groups O1, O2 and O3 received feed with 0.15, 0.3, or 1.0 mg OTA/kg feed, respectively. Groups B1, B2 and B3 were offered feed supplemented with 3.7, 7.5 and 15 g BN/kg feed, respectively. The groups O1B1, O2B1 and O3B1 were fed three dietary levels of OTA concurrently with the first level of bentonite (i.e. 3.5 g BN/kg feed), while the groups O1B2, O2B2, and O3B2 were fed the same OTA dietary levels in combination with 7.5 g BN/kg feed. Groups O1B3, O2B3, and O3B3 were concurrently fed diet amended with the three dietary OTA levels along with 15 g BN/kg feed.
The doses of OTA and AFB1 were selected based upon previously-established immunotoxic levels of these mycotoxins in the avian model. The BN doses here were based on the level of this binder routinely being used in poultry feed as a safe adsorbent for mycotoxins.
Antibody responses to sheep red blood cells
The antibody response to sheep red blood cells (SRBC) was performed following the method of Delhanty and Solomon (Citation1966). After 12 days on the test diets, a dedicated subset of six birds/group was then injected in the wing vein with a primary dose of 1 ml SRBC (3% suspension in phosphate-buffered saline [PBS, pH 7.4]); a similar booster dose was administered 14 days after the primary injection. For these injections, 3% suspension of washed SRBC that had been obtained from a local abattoir was prepared in PBS. To assess host antibody responses, blood was collected from the wing vein at Days 7 and 14 after the primary and booster injection. All blood samples were processed to generate serum that, in turn, was heat-inactivated (56 °C, 30 min) before being analyzed for levels of total antibody, mercaptoethanol-2 (2-ME)-sensitive (IgG), and ME-resistant (IgM) anti-SRBC antibodies.
For the assays of total anti-SRBC antibody, in brief, after adding 50 μl PBS to each well of a 96-well plate, 50 μl heat-inactivated serum was added to the first column and incubated for 30 min at 37 °C. Two-fold serial dilutions of the samples were then longitudinally prepared in the next 10 columns (final dilution =1:2048). Then, to each well 50 μl of a 2% SRBC suspension was added and the plate was again incubated at 37 °C for 30 min. The plates were then evaluated for the presence of an antibody-antigen button; the point at which no button was present was used to determine the endpoint titer. To calculate ME-sensitive (IgG) responses, 50 μl of 0.01 M 2-ME [in PBS] was used in place of PBS. The difference between total antibody titer and ME-sensitive (IgG) antibody titer was considered the IgM antibody titer. Titer values were reported as log3 of the reciprocal of the highest dilution giving visible agglutination.
In situ carbon clearance assay
The phagocytic activity of host reticuloendothelial system macrophages was evaluated by the method of Cheng and Lamont (Citation1988). In preparation for the assay, Black India ink (Pelikan 4001, Pelikan, Sharjah, UAE) was centrifuged at 3000 x g for 30 min and the supernatant collected. For the study, after 21 days on the test diets, a dedicated subset of six birds/group was then intravenously injected (0.1 ml/kg body weight) into the right wing vein with the collected fraction. Blood samples (200 μl/bird) were collected from the left wing vein before injection (0 min) and then at 3 and 15 min after ink injection. Collected blood samples (0.2 ml/bird) were immediately added to 4 ml aqueous sodium citrate (1%) solution and centrifuged at 50g for 4 min. Thereafter, the optical density (OD) of the supernatant was measured at 640 nm in a Spectro 20D spectrophotometer (LaboMed, Culver City, CA). The relative amount of un-phagocytized carbon particles remaining in the supernatant of each sample was determined as: Percent (%) = 100 × [OD at specific time - OD at time 0]/OD at time 0.
In vivo lymphoproliferative response to Phytohemagglutinin-P (PHA-P)
For this study, after 35 days on the test diets, a dedicated subset of six birds/group was injected in the inter-digital space [between 3rd and 4th digits] of the right foot with 50 μg PHA-P (Sigma, St. Louis, MO) in 0.1 ml PBS (Corrier Citation1990). PBS (0.1 ml) injected between the 3rd and 4th digit of left foot served as control. At 0, 24, 48 and 72 h post injection, thickness of intra-digital skin was measured using a tension micrometer (Global Sources, Shanghai, China). At each point, response was calculated as [skin thickness in right foot - skin thickness in left foot].
Histopathology and morphometric analysis of immune organs
After 42 days on the test diets, six birds/group were euthanized by cervical dislocation. At necropsy, the bursa of Fabricius and thymus were collected from each bird, formalin-fixed and then processed for histopathological and morphometric analysis using the method of Bancroft and Gamble (Citation2007).
Statistical analysis
Data are reported as means ± SD unless otherwise noted. All data obtained in the experiments were analyzed for significant differences using a two-way analysis of variance (ANOVA). Means among the different groups were compared using a Duncan’s multiple range test. An MSTATC statistical software package (Department of Crop and Soil Sciences, Michigan State University, East Lansing, MI) was used for all analyzes. A p values <0.05 was accepted as significant.
Results
Amelioration of Aflatoxicosis (Experiment 1)
Antibody response against SRBC
Antibody titers against SRBC in the broilers are presented in . At day 7 post-primary injection (), a significant decrease in total antibody titers was seen in the group fed higher dietary levels of AFB1 (0.6 mg AFB1/kg feed). Birds offered bentonite alone (3.7 or 7.5 g/kg) had titers that were not significantly different from the controls. In the combination groups, a significant decrease titer was observed in groups offered 0.6 mg AFB1/kg feed concurrently with either level of BN. IgG titers in all experimental birds did not significantly differ; in comparison, the titer of IgM alone was significantly lower only in birds offered 0.6 mg AFB1/kg feed alone [compared to control]. At Day 14 post-primary injection, total antibody titers in birds that had fed on 0.6 mg AFB1/kg feed were significantly lower compared to the controls (); values from all other groups were not significantly different from control levels. The titers of IgG and IgM of all experimental birds did not significantly differ from the control bird values.
Figure 1. (A–D) Antibodies titers against SRBC in broiler chicks given different dietary levels of AFB1 and bentonite clay. Values shown are mean [± SD] titers (log3 of reciprocal of highest dilution giving visible agglutination, n = 6/group) Value significantly different from control at *p < 0.05, or **p < 0.01. Abbreviations: A1 = 0.1 mg AFB1/kg feed, A2 = 0.2 mg AFB1/kg feed A3 = 0.6 mg AFB1/kg feed, B1 = 3.7 g bentonite clay/kg feed, B2 = 7.5 g bentonite clay/kg feed. Bars (left to right, each set): control, A1, A2, A3, B1, B2, A1B1, A2B1, A3B1, A1B2, A2B2, A3B2.
![Figure 1. (A–D) Antibodies titers against SRBC in broiler chicks given different dietary levels of AFB1 and bentonite clay. Values shown are mean [± SD] titers (log3 of reciprocal of highest dilution giving visible agglutination, n = 6/group) Value significantly different from control at *p < 0.05, or **p < 0.01. Abbreviations: A1 = 0.1 mg AFB1/kg feed, A2 = 0.2 mg AFB1/kg feed A3 = 0.6 mg AFB1/kg feed, B1 = 3.7 g bentonite clay/kg feed, B2 = 7.5 g bentonite clay/kg feed. Bars (left to right, each set): control, A1, A2, A3, B1, B2, A1B1, A2B1, A3B1, A1B2, A2B2, A3B2.](/cms/asset/e30d812d-afd1-4435-8482-0000471b0490/iimt_a_1264503_f0001_b.jpg)
At Day 7 post-booster injection, total antibody titers and IgG levels were significantly lower in all groups offered different levels of AFB1 alone compared to control bird values. The birds in group offered BN concurrently with a higher dietary level of AFB1 (0.6 mg AFB1/kg feed) exhibited a significant lowering of titers compared to in control birds (). IgM titers in all the experimental groups did not differ significantly from each other. At Day 14 post-booster injection, a significantly lower total antibody titer was seen in groups offered AFB1 in feed alone and also in groups offered a higher dietary level of AFB1 (i.e. 0.6 mg AFB1/kg feed) in conjunction with either BN supplement level (). IgG titers were significantly lower in birds given 0.6 mg AFB1/kg feed while IgM titers in all groups did not differ significantly from the control group values. Data for antibodies titers having non-significant difference has not been shown.
Carbon clearance assay
In situ carbon clearance in the broilers is presented in . Clearance was significantly delayed in all groups [except B1, B2, A1B2 and A2B2] at 3 min post-injection compared to rates seen in the control birds (). At 15 min post-injection, only group A1B2 (0.1 mg AFB1/kg feed +7.5 g BN/kg feed) birds had a non-significant difference from controls; all other birds had a significant delay in clearance relative to that in the controls (). Carbon clearance was significantly delayed in groups given different levels of AF alone compared to in corresponding groups offered AFB1-contaminated diet along with BN.
Figure 2. (A, B). In-vivo phagocytic potential, of broiler chicks fed different dietary levels of AFB1 and/or bentonite clay. Bars (left to right, each set): control, A1, A2, A3, B1, B2, A1B1, A2B1, A3B1, A1B2, A2B2, A3B2. Values shown are means ± SD (n = 6 chicks/group). Value significantly different from control at *p < 0.05, **p < 0.01, or ***p < 0.001. Abbreviations are as reported in .
Lymphoproliferative response to PHA-P
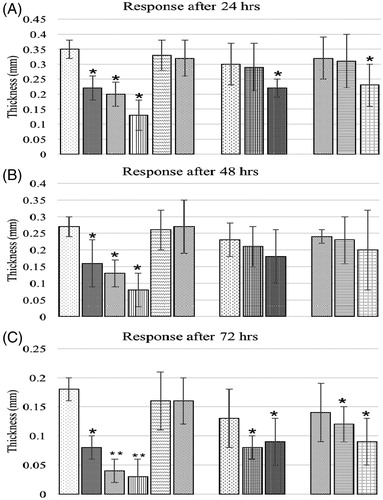
Lymphoproliferative responses due to intradermal PHA-P injection are presented in . At 24 and 48 h post-injection (), groups offered AFB1 alone in the diet had significantly lower responses in terms of skin thickness compared to corresponding values in control birds. Similar responses were also observed in the groups fed 0.6 mg AFB1/kg feed with either level of BN - except groups A3B1 and A3B2; the latter had a non-significant difference at 48 h compared to the control. All other groups had non-significant differences compared to the controls. At 72 h (), only groups offered BN alone or a low level of bentonite had non-significant differences while all other groups had significantly lower responses compared to the control group thickness values.
Figure 3. (A–C) Lymphoproliferative response to PHA-P of chicks fed different dietary levels of AFB1 and/or bentonite clay. Bars (left to right, each set): control, A1, A2, A3, B1, B2, A1B1, A2B1, A3B1, A1B2, A2B2, A3B2. Values shown are means ± SD (n = 6 chicks/group). Value significantly different from control at *p < 0.05 or **p < 0.01. Abbreviations are as reported in .
Histopathology of bursa of Fabricius
Birds in the control group had normal histological patterns in the bursa of Fabricius. Follicular morphology was also well maintained in birds fed different dietary levels of BN alone. Birds concurrently fed BN with the two lowest levels of AFB1 had histological patterns in their bursa of Fabricius that were comparable to that in control birds. A few follicles showed necrotic changes and a presence of macrophages in the medullary region. Empty spaces present in the medullary region were likely due to lymphocytic depletion; however, compared to in group A2 (0.2 mg AFB1/kg feed) birds, there was a comparatively lesser degree of lymphocytic depletion. The superficial pseudo-stratified epithelium was intact. Birds in groups fed 0.6 mg AFB1/kg feed concurrently with BN exhibited a moderate increase in inter-follicular connective tissue. A less dense population of cells in the cortex and medulla was observed [compared with in control bird tissues]. Some areas of lymphocytic depletion were present in the cortex and medullary regions.
Histopathology of thymus
Thymus of the birds exposed to AFB1 alone showed mild lymphoid depletion during the process of maturation. The thymic tissues appeared to have embedded stars (“starry sky” appearance). The medulla was less dense and there were cells between lymphocytes that had lightly-stained cytoplasm and indistinct nuclei (suggestive of reticuloendothelial cells). Hassall’s corpuscles were present and the numbers of vacuoles in the corpuscles were increased. The groups concurrently fed BN along with AF still showed empty spaces in the medullary region (compared to control tissue). Hassall’s corpuscles were of variable sizes and in some cases contained pyknotic nuclei. The levels of cells with pyknotic nuclei in the medulla of organs isolated from birds offered 0.2 mg AFB1/kg feed was higher compared to that in the organs from birds fed the same dietary AFB1 contamination level concurrent with BN. Group A3B1 and A3B2 birds also showed excessive empty spaces and congestion in the medulla (compared to control bird tissue).
Morphometric study Bursa of Fabricius
Morphometric evaluation of the bursa of Fabricius of the broilers is presented in and . The mean diameter of the follicles of groups offered AFB1-amended diet alone and the birds fed 0.2 or 0.6 mg AFB1/kg feed concurrently with either level of BN was significantly lower than that of the control birds. All other groups had non-significant differences in these values compared with the control group. The thickness of inter-follicular connective tissues in control birds was low and significantly different from that in birds offered AFB1 alone; a similar pattern was observed with regard to groups fed 0.6 mg AFB1/kg feed concurrently with different BN levels. All other groups had non-significant differences in thickness compared to the control bird values.
Figure 4. Follicular diameter of bursa of Fabricius of chicks fed different dietary levels of AFB1 and/or bentonite clay. Values shown are means ± SD (n = 6 chicks/group). Value significantly different from control at *p < 0.05 or **p < 0.01. Abbreviations are as reported in .
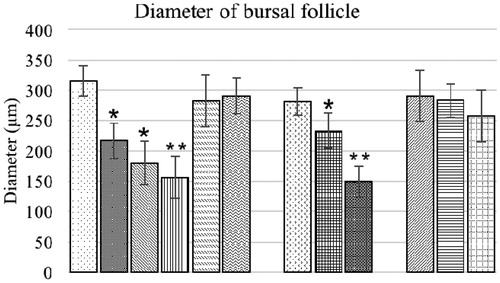
Figure 5. Intermolecular connective tissue of bursa of Fabricius of chicks fed different dietary levels of AFB1 and/or bentonite clay. Values shown are means ± SD (n = 6 chicks/group). Value significantly different from control at *p < 0.05 or **p < 0.01. Abbreviations are as reported in .
Amelioration of ochratoxicosis (Experiment 2)
Antibody response towards SRBC
Antibody titers against SRBC in the broilers are presented in . At Day 7 post-primary injection, total antibody titers were significantly lower (compared to values in controls) in birds fed 1.0 mg OTA/kg feed alone; all other groups had non-significant differences compared with control group values (). IgG and IgM titers in all the treatment birds differed non-significantly from each other at Day 7. At Day 14 post-injection, levels of total antibodies, IgG, and IgM in all the treatment groups differed non-significantly from each other.
Figure 6. (A–C) Antibody titers against SRBC in broiler chicks given different dietary levels of OTA and bentonite clay. Values shown are mean [± SD titers] (log3 of reciprocal of highest dilution giving visible agglutination, n = 6/group) Value significantly different from control at *p < 0.05, or **p < 0.01. Abbreviations: O1 = 0.15 mg OTA/kg feed, O2 = 0.3 mg OTA/kg feed, O3 = 1.0 mg OTA/kg feed, B1 = 3.7 g bentonite clay/kg, B2 = 7.5 g bentonite clay/kg feed, B3 = 15 g bentonite clay/kg feed. Bars (left to right, each set): control, O1, O2, O3, B1, B2, B3, O1B1, O2B1, O3B1, O1B2, O2B2, O3B2, O1B3, O2B3, O3B3.
![Figure 6. (A–C) Antibody titers against SRBC in broiler chicks given different dietary levels of OTA and bentonite clay. Values shown are mean [± SD titers] (log3 of reciprocal of highest dilution giving visible agglutination, n = 6/group) Value significantly different from control at *p < 0.05, or **p < 0.01. Abbreviations: O1 = 0.15 mg OTA/kg feed, O2 = 0.3 mg OTA/kg feed, O3 = 1.0 mg OTA/kg feed, B1 = 3.7 g bentonite clay/kg, B2 = 7.5 g bentonite clay/kg feed, B3 = 15 g bentonite clay/kg feed. Bars (left to right, each set): control, O1, O2, O3, B1, B2, B3, O1B1, O2B1, O3B1, O1B2, O2B2, O3B2, O1B3, O2B3, O3B3.](/cms/asset/4c9da057-b05e-4e6d-9c87-1b9fd00edb1a/iimt_a_1264503_f0006_b.jpg)
At Day 7 after the booster injection, levels of total antibodies in all the groups offered OTA-spiked diet alone (O1, O2, or O3) were significantly lower than control group. The groups offered 1.0 mg OTA/kg feed concurrently with 3.7 or 15 g BN/kg feed had values that were also significantly lower than controls (). All other treatment groups had non-significant differences in titer from the controls. The IgG level in group O3 (1.0 mg OTA/kg feed) birds were significantly lower than the control; all other groups had non-significant differences from the controls. IgM levels differed non-significantly among all the treatment groups at Day 7 after the SRBC booster. At Day 14 post-booster, total antibody titer and IgG levels were significantly lower in groups maintained on OTA-contaminated diet alone (0.3 and 1.0 mg/kg feed) relative to values in control birds. Birds offered 1.0 mg OTA/kg feed concurrently with 3.7 g BN/kg feed had significantly lower total antibody titers than controls at this timepoint (). IgM levels differed non-significantly among all groups at Day 14 post-booster.
Carbon clearance assay
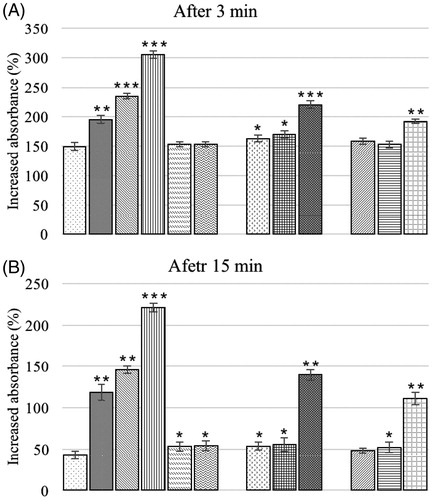
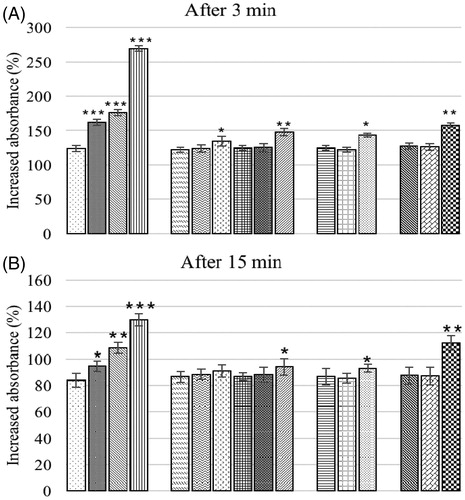
The in vivo phagocytic potential in broiler chicks is presented in . At 3 and 15 min post-injection, clearance of carbon in control birds differed non-significantly from birds offered BN alone at 3.7 or 7.5 g/kg feed and also in the groups fed OTA (0.15 or 0.3 mg/kg feed) concurrent with the three test levels of BN (3.7, 7.5, or 15 g/kg feed). All other treatment groups had a significant delay in clearance when compared to the controls. At 3 and 15 min post-injection, group offered 1.0 mg OTA/kg feed alone had higher value (increased absorbance %) indicating a delayed clearance when compared to all other groups at that particular time point.
Figure 7. (A, B) In vivo phagocytic potential of chicks fed different dietary levels of OTA and/or bentonite clay. Bars (left to right, each set): control, O1, O2, O3, B1, B2, B3, O1B1, O2B1, O3B1, O1B2, O2B2, O3B2, O1B3, O2B3, O3B3. Abbreviations are as reported in . Values shown are means ± SD (n = 6 chicks/group). Value significantly different from control at *p < 0.05, **p < 0.01, or ***p < 0.001.
Lymphoproliferative response to PHA-P
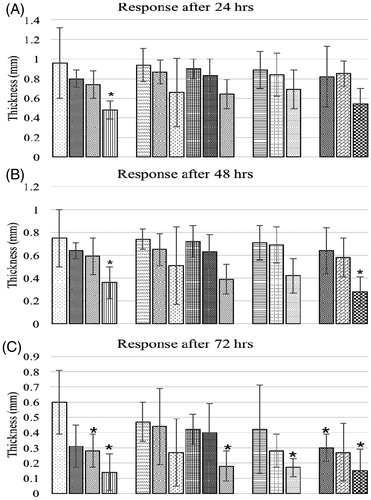
The lymphoproliferative responses to intradermal injection of PHA-P are presented in . Control birds had a significantly higher skin thickness at 24 and 48 h post-injection than did birds offered 1.0 mg OTA/kg feed alone. All other treatment groups had a non-significant response compared to control except the one fed highest dose of OTA and BN at 48 h. At 72 hr post-PHA-P injection, control birds had no significant difference in values versus those seen in birds that had been fed BN alone at 3.7 or 7.5 g/kg feed and of those fed 0.15 mg OTA/kg feed concurrently with 3.7 or 7.5 g BN/kg feed. Similar responses were also seen in birds in group O2B1 (0.3 mg OTA/kg +3.7 g BN/kg feed). All other treatment groups had significantly lower responses versus the controls.
Figure 8. (A–C) Lymphoproliferative response to PHA-P of chicks fed different dietary levels of OTA and/or bentonite clay. Bars (left to right, each set): control, O1, O2, O3, B1, B2, B3, O1B1, O2B1, O3B1, O1B2, O2B2, O3B2, O1B3, O2B3, O3B3. Abbreviations are as reported in . Values shown are means ± SD (n = 6 chicks/group). Value significantly different from control at *p < 0.05.
Histopathology of bursa of Fabricius
Birds in the control group had normal histological patterns in the Bursa of Fabricius. The birds fed different dietary levels of BN alone did not show histological differences from control. However, birds exposed to OTA exhibited pyknotic nuclei, degenerated cells, and empty spaces in the medullary region. There was also an increase in the inter-follicular connective tissue. These changes occurred in a dose-related manner, being more severe in birds fed 1.0 mg OTA/kg feed. Addition of BN to the diet did not ameliorate the changes seen in the birds fed OTA. However, the histologic alterations were less severe in the birds fed lower levels of dietary OTA concurrently with BN, as follicular morphology was well maintained. In a few places, in the birds, the demarcation between cortex and medulla was lost and necrosis among lymphocytes was also noted (leading to increased empty spaces in medulla). Birds exposed to higher OTA levels concurrently with BN exhibited histological patterns similar to that in birds exposed to OTA alone.
Histopathology of thymus
Birds in groups fed OTA alone exhibited lymphocytic depletion, excessive empty spaces, and darkly stained pyknotic nuclei in the thymic medullary region. The diameter of the Hassall’s corpuscles was highly variable and darkly-stained pyknotic nuclei were also seen in the cortical region. Severity of these changes increased with OTA levels. The groups concurrently fed BN with OTA showed cavitation and increased pyknotic nuclei populations in the cortical and medullary regions. Hassall’s corpuscles were of variable sizes and in places the cortex - medulla demarcation was absent.
Morphometric analysis of bursa of Fabricius
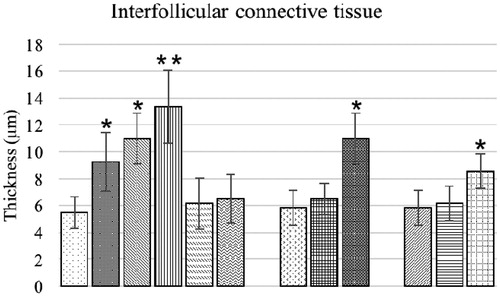
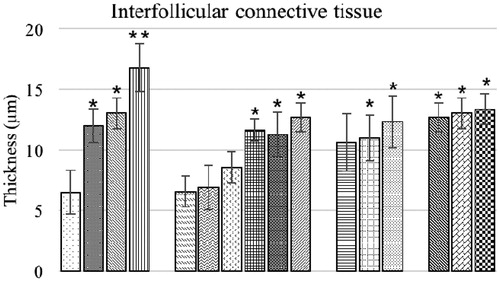
Morphometric evaluation of the bursa of Fabricius of the broilers are presented in and . The mean diameter of bursal follicles and inter-follicular connective tissue thickness in the control birds were not significantly different from in birds fed low levels of OTA and 3.7 and 7.5 g BN/kg feed alone. The birds of combination group O1B2 and O2B2 also exhibited a non-significant difference in mean diameter of bursal follicles from control bird values. All other experimental groups had significantly lower mean diameters and higher inter-follicular connective tissue thicknesses compared to corresponding values in control birds.
Figure 9. Follicular diameter of bursa of Fabricius of broiler chicks fed different dietary levels of OTA and/or bentonite clay. Values shown are means ± SD (n = 6 chicks/group). Value signifi-cantly different from control at *p < 0.05 or **p < 0.01. Abbreviations are as reported in .
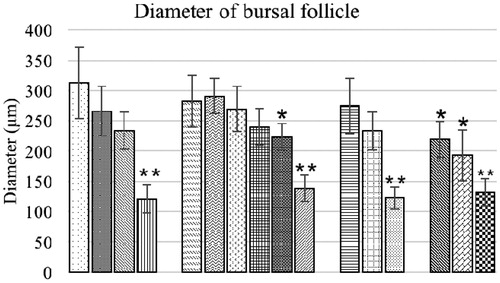
Figure 10. Inter-follicular connective tissue (μm) of bursa of Fabricius of chicks fed different dietary levels of OTA and/or bentonite clay. Values shown are means ± SD (n = 6 chicks/group). Value significantly different from control at *p < 0.05 or **p < 0.01. Abbreviations are as reported in .
Discussion
Deposits of BN are found throughout the world, but they can vary in their composition – this affects their absorptive capacity. In Pakistan, large deposits of natural BN are available in the Potohar plateau. The aim of the current studies was to investigate the potential ameliorative ability of different dietary concentration of locally available natural Potohar BN against histologic alterations/immuno-pathologic effects induced by AFB1 or OTA in broilers. The ameliorative properties are not only influenced by the properties of the adsorbent (total charge, charge distribution, pore size) but also the physical properties of the adsorbate (polarity, solubility, size and shape). For this reason, two dietary concentrations of BN were used against AFB1 because - being polar in nature - AFB1 is easily adsorbed by clays. In contrast, because of the fairly non-polar nature of OTA, three dietary concentrations were used to investigate the binding ability of the test BN.
In Experiment 1, the presence of AFB1 in the bird diet resulted in lymphocytic depletion in bursal follicles and in thymic lobules. At all three levels analyzed here, AFB1 suppressed immunological responses to SRBC and lymphoproliferative responses to PHA-P. A significant reduction in the in vivo phagocytic potential of circulatory macrophages was observed in AFB1-fed chicks. The exposure to AFB1 resulted in decreased size of vital immune system organs; this might be responsible for a reduction in immune competency of the birds as reported by Kubena et al. (Citation1990). Similar findings were also reported by Verma et al. (Citation2004). Chicks offered dietary concentrations of AF from day-old to 4-weeks-of-age revealed a significantly reduced IgG and IgA serum concentrations (Giambrone et al. Citation1985). Gore and Qureshi (Citation1997) and Ghosh et al. (Citation1990) also reported delayed cell mediated immune responses to different mitogens in AFB1-toxicated chicks as perceived by delayed-type hypersensitivity reactions. Li et al. (Citation1999) reported a decrease in phagocytic potential of circulatory macrophages (determined by carbon clearance) in broilers fed fumonisin B1. Similar response was also reported by Dwivedi and Burns (Citation1984) using phenol red clearance test in OTA-exposed birds.
The broiler chicks fed BN alone did not exhibit any significant deviation in histological and immunological parameters from with control group. The observations suggested that dietary BN levels had no deleterious effects on different parameters studied. The layered crystalline structure of bentonite is responsible for its binding ability which is even more enhanced after the addition of water as it swells (Grim & Guven Citation1978). The use of different clays as mycotoxin binding agents did not affect the production performance and immunological parameters of the poultry birds as reported by different authors (Indresh et al. Citation2013; Safaeikatouli et al. Citation2010).
In current study, the effect of concurrent feeding of locally available BN with different levels of AFB1 on the histopathological studies revealed the protective effect at lower dietary AFB1 levels. The groups offered 0.6 mg AFB1/kg in combination with locally available BN exhibited a partial ameliorative response. These findings were consistent with the previous reports of Magnoli et al. (Citation2011). In the broiler birds, no study has yet been conducted on the morphometric assessment of bursa of Fabricius fed AFB1 concurrently with graded dietary concentrations of BN. In addition, effects on the total antibody and IgG titers in response to SRBC, responses to PHA-P and carbon clearance in many combination groups suggested amelioration by the BN. That dietary addition of BN reversed negative effects of AFB1 on immune parameters and these findings were in agreement with earlier reports of Ghahri et al. (Citation2010) and Abd El-Ghany et al. (Citation2013). In the broiler birds, the dietary administration of AFB1 (25–35 μg/kg) contaminated diet concurrently with 0.5% Ugandan bentonite improved the antibody response to Newcastle disease in broiler birds (Mugerwa et al. Citation2013).
Previous reports on dietary addition of alumino-silicates as mycotoxin binding agent revealed their protective effects against AFB1 toxicity (Harvey et al. Citation1989; Schell et al. Citation1993; Thieu et al. Citation2008). The polarity of the AFB1 enhances its binding or adsorption by these silicate materials (Phillips et al. Citation1995) thus rendering them unable to get absorbed into the circulation during their passage through the gastrointestinal tract. The BN samples collected from various geographical areas exhibited a wide range of adsorption capacity during various in vitro and in vivo studies. The difference in adsorption capacity attributed to the properties of smectite clay (Magnoli et al. Citation2008).
Attempts here were also made to study potential ameliorative effects of BN against OTA toxicities in the broiler chicks. Feeding OTA here resulted in immunosuppressive effects including degenerative changes in immune organs and altered number/function of immune cells and antibody responses. The decrease in the antibody production due to exposure of OTA was also reported by ul-Hassan et al. (Citation2012) and Verma et al. (Citation2004). How OTA leads to decreases in IgG is not known, but it might be due to the same mechanism that causes the regression of the immune organs and also the inhibition of the protein synthesis. The exposure to OTA severely affects the activity of B- and T-lymphocytes (Lea et al. Citation1989). The in vivo lympho-proliferative response of the broilers indicated that OTA led to poorer responses to PHA-P. Elaroussi et al. (Citation2006) reported the similar decreased response in broilers fed OTA for 35 Days. The observed decrease in in situ phagocytic activity was also consistent with previous reports of Khatoon et al. (Citation2013) and ul-Hassan et al. (Citation2011a,Citationb,Citationc). Taking together the effects seen here on granulocyte phagocytic function and the known effects on B- and T-lymphocytes, it is likely that OTA led to reduce titers of antibodies against the SRBC as a culmination of multiple effects on the function of key cells involved in processing of this antigen and ultimate generation of antibody against it.
The histology of the Bursa of Fabricius and thymus and morphometric analyses of the bursa revealed that any ameliorative response was absent when OTA was fed concurrently with different dietary levels of BN. Histological alterations seen were almost similar to those in groups fed OTA alone. Mild or no amelioration was seen in response parameters in the OTA + BN groups. Dietary exposure to 2 mg OTA/kg resulted in a reduction of humoral and cellular immune responses and decreased phagocytic activity of macrophages. However, concurrent dietary addition of 0.25% hydrated sodium calcium alumino-silicate (HSCAS) did not protect the birds from negative effects of OTA as observed by their continued suppressed humoral immune response against Newcastle disease virus (Santin et al. Citation2002).
It is important to note for the readers that birds offered 0.37 and 0.75 g BN/kg feed alone did not display significant differences from control group values for the assayed endpoints. In contrast, in some instances, use of 0.75 g BN/kg feed had some deleterious effects. At higher dietary levels, Tauqir et al. (Citation2001) and Khanedar et al. (Citation2012) also reported some deleterious effects of BN because of the reason that the clays being negatively charged particles, non-specifically bind the vitamins, minerals, amino acids and other essential nutrients present in the feed. By this, high dietary levels of BN fed for longer durations might give rise to nutrient deficiency in a host, an outcome well-known to cause immunomodulation in situ.
The studies conducted so far on the dietary addition of alumino-silicate exhibited partial or absence of ameliorative response against OTA, however, the binding ability was present against the deleterious effects of aflatoxin (Kubena et al. Citation1990; Scheideler Citation1993). Besides the binding efficacy of HSCAS against the aflatoxins a limited or absence of ameliorative ability against zearalenone, OTA, and trichothecenes was also reported by Huwig et al. (Citation2001) and Bailey et al. (Citation1998). The possible reason for this lack of effectiveness might be the fairly non-polar nature of OTA. To date, no single adsorbent has been shown effective against most mycotoxins (Sirhan et al. Citation2012).
These were not our first studies to assess potential beneficial effects from BN against mycotoxin toxicities. Using similar dietary contamination levels, our laboratory had evaluated other groups of birds for possible overt toxicities/potential amelioration using BN (Bhatti et al. Citation2016). Those studies found that addition to the feed of AFB1 and OTA alone exerted deleterious effects on serologic, biochemical, and oxidative status parameters in broiler chicks. Those results suggested that dietary incorporation of BN (3.7 and 7.5 g/kg) could ameliorate those adverse effects from 0.1 and 0.2 mg AFB1/kg. However, no protection was observed by dietary addition of BN against OTA-mediated toxicological effects. Thus, the studies here differ from the earlier ones in that feeding AFB1- and OTA-contaminated diets resulted in significant alterations in cellular and humoral immune responses in broiler chicks. While significant amelioration by BN was noted against AFB1-mediated immunotoxicities, again, no such protection was noted in the groups of birds maintained on OTA + BN added diets.
Conclusions
The results collectively suggested that dietary incorporation of BN ameliorated the adverse effects of AFB1 on immune parameters. Based on significant differences from control in the different parameters studied, it might be assumed that the presence of OTA in broilers feed adversely affect the overall health status and concurrent dietary addition of BN at all levels only partially or did not improved the negative effects induced by OTA.
Disclosure statement
The authors declare no conflicts of interest. The authors alone are responsible for the content of this manuscript.
Additional information
Funding
References
- Abd El-Ghany W, Hatem M, Ismail M. 2013. Evaluation of efficacy of feed additives to counteract toxic effects of aflatoxicosis in broiler chickens. Intl J Anim Vet Adv. 5:171–182.
- Abdel-Wahhab M, Omara E, Abdel-Galil M, Hassan N, Nada S, Saeed A, el-Sayed M. 2007. Zizyhus spinachristi extract protects against AFB1-intitiated hepatic carcinogenicity. Afr J Tradit Compl Altern Med. 4:248–256.
- Adeyemo A, Adeoye I, Bello O. 2015. Adsorption of dyes using different types of clay: A review. Appl Water Sci. 20:1–26.
- Akande K, Abubakar M, Adegbola T, Bogoro S. 2006. Nutritional and health implication of mycotoxins in animal feeds: A review. Pak J Nutr. 5:398–403.
- AOAC (Association of Official Analytical Chemists). 2000. Official methods of analysis. Vol. 2, 17th ed. Method #990.33: natural toxins. Gaithersburg, MD: AOAC.
- Bailey R, Kubena L, Harvey R, Buckley S, Rottinghous G. 1998. Efficacy of various inorganic sorbents to reduce the toxicity of aflatoxin and T-2 toxin in broiler chickens. Poult Sci. 77:1623–1630.
- Bancroft J, and Gamble M. (Eds.) 2007. Theory and Practice of Histological Techniques. 5th ed. London: Churchill Livingstone.
- Bayman P, Baker J, Doster M, Michailides T, Mahoney N. 2002. Ochratoxin production by the Aspergillus ochraceus group and Aspergillus alliaceus. Appl Environ Microbiol. 68:2326–2329.
- Bhatti S, Khan M, Saleemi M, Saqib M. 2016. Aflatoxicosis and ochratoxicosis in broiler chicks and their amelioration with locally available bentonite clay. Pak Vet J. 36:68–72.
- Celik I, Oguz H, Demet O, Donmez H, Boydak M, Sur E. 2000. Efficacy of polyvinylpolypyrrolidone in reducing the immunotoxicity of aflatoxin in growing broilers. Br Poult Sci. 41:430–439.
- Cheng S, Lamont S. 1988. Genetic analysis of immunocompetence measures in a White Leghorn chicken line. Poult Sci. 67:989–995.
- Corrier D. 1990. Comparison of phytohemagglutinin-induced cutaneous hypersensitivity reactions in the inter-digital skin of broiler and layer chicks. Avian Dis. 34:369–373.
- Delhanty J, Solomon J. 1966. The nature of antibodies to goat erythrocytes in the developing chicken. Immunology. 11:103–113.
- Dinis A, Lino C, Pena A. 2007. Ochratoxin A in nephropathic patients from two cities of central zone in Portugal. J Pharm Biomed Anal. 44:553–557.
- Dwivedi P, Burns R. 1984. Effect of ochratoxin A on immunoglobulins in broiler chicks. Res Vet Sci. 36:117–121.
- Elaroussi M, Mohamed F, El Barkouky E, Atta A, Abdou A, Hatab M. 2006. Experimental ochratoxicosis in broiler chickens. Avian Pathol. 35:263–269.
- Ghahri H, Habibian R, Fam M. 2010. Effect of sodium bentonite, mannan oligosaccharide and humate on performance and serum biochemical parameters during aflatoxicosis in broiler chickens. Global Vet. 5:129–134.
- Ghosh R, Chauhan H, Roy S. 1990. Immunosuppression in broilers under experimental aflatoxicosis. Br Vet J. 146:457–462.
- Giambrone J, Diener U, Davis N, Panangala V, Hoerr F. 1985. Effects of aflatoxin on young turkeys and broiler chickens. Poult Sci. 64:1678–1684.
- Gibson R, Bailey C, Kubena L, Huff W, Harvey R. 1990. Impact of L-phenylalanine supplementation on the performance of three-week-old broilers fed diets containing ochratoxin A. 1. Effects on body weight, feed conversion, relative organ weight, and mortality. Poult Sci. 69:414–419.
- Gore A, Qureshi M. 1997. Enhancement of humoral and cellular immunity by Vitamin E after embryonic exposure. Poult Sci. 76:984–991.
- Grim R, Guven N, editors. 1978. Bentonites: Geology, mineralogy, properties and uses. Developments in sedimentology. Amsterdam: Elsevier.
- Harvey R, Kubena L, Phillips T, Huff W, Corrier D. 1989. Prevention of aflatoxicosis by addition of hydrated sodium calcium aluminosilicate to the diets of growing barrows. Am J Vet Res. 50:416–420.
- Hussain Z, Khan M, Khan A, Javed I, Saleemi M, Mahmood S, Asi M. 2010. Residues of aflatoxin B1 in broiler meat: Effect of age and dietary aflatoxin B1 levels. Food Chem Toxicol. 48:3304–3307.
- Huwig A, Freimund S, Kappeli O, Dutler H. 2001. Mycotoxin detoxication of animal feed by different adsorbents. Toxicol Lett. 122:179–188.
- IARC (International Agency for Research on Cancer). 1993. Monographs on the evaluation of carcinogenic risks to humans: Some naturally occurring substances, food items and constituents, heterocyclic aromatic amines and mycotoxins. Geneva: International Agency for Research on Cancer. 56:489–521.
- Indresh H, Umakantha B. 2013. Effects of ochratoxin and T-2 toxin combination on performance, biochemical, and immune status of commercial broilers. Vet World. 6:945–949.
- Indresh H, Devegowda G, Ruban S, Shivakumar M. 2013. Effects of high grade bentonite on performance, organ weights, and serum biochemistry during aflatoxicosis in broilers. Vet World. 6:313–317.
- Kabak B, Dobson A, Var I. 2006. Strategies to prevent mycotoxin contamination of food and animal feed: A review. Crit Rev Food Sci Nutr. 46:593–619.
- Khan M, Hameed M, Hussain T, Khan A, Javed I, Ahmad I, Hussain A, Saleemi M, Islam N. 2013. Aflatoxin residues in tissues of healthy and sick broiler birds at market age in Pakistan: A one-year study. Pak Vet J. 33:423–427.
- Khanedar F, Vakili R, Zakizadeh S. 2012. Effects of two kinds of bentonite on the performance, blood biochemical parameters, carcass characteristics, and tibia ash of broiler chicks. Global Vet. 9:720–725.
- Khatoon A, Khan MZ, Khan A, Saleemi M, Javed I. 2013. Amelioration of ochratoxin A-induced immunotoxic effects by silymarin and Vitamin E in White Leghorn cockerels. J Immunotoxicol. 10:25–31.
- Kozaczynski W. 1994. Experimental ochratoxicosis A in chickens. Histopathological and histochemical study. Arch Vet Pol. 34:205–219.
- Kubena L, Harvey R, Phillips T, Corrier D, Huff W. 1990. Diminution of aflatoxicosis in growing chickens by the dietary addition of a hydrated, sodium calcium aluminosilicate. Poult Sci. 69:727–735.
- Lea T, Steien K, Stormer F. 1989. Mechanism of ochratoxin A-induced immunosuppression. Mycopathologia. 107:153–159.
- Li Y, Ledoux D, Bermudez J, Fritsche K, Rottinghaus G. 1999. Effects of fumonisin B1 on selected immune responses in broiler chicks. Poult Sci. 78:1275–1282.
- Magnoli A, Cavagglieri L, Magnoli C, Monge J, Miazzo R, Peralta M, Salvano M, Rosa C, Dalcero A, Chiacchiera S. 2008. Bentonite performance on broiler chickens fed with diets containing natural levels of AFB1. Rev Bras Med Vet. 30:55–60.
- Magnoli A, Texeira M, Rosa C, Miazzo R, Cavaglieri L, Magnoli C, Dalcero A, Chiacchiera S. 2011. Sodium bentonite and monensin under chronic aflatoxicosis in broiler chickens. Poult Sci. 90:352–357.
- Mugerwa S, Zziwa E, Kabirizi J. 2013. Effect of fortifying aflatoxin-contaminated feeds with Ugandan bentonite on performance of broiler birds. Appl Sci Report. 3:106–109.
- Phillips T, Sarr A, Grant P. 1995. Selective chemisorption and detoxification of aflatoxins by phyllosilicate clay. Nat Toxins. 3:204–213.
- Safaeikatouli M, Jafariahangari Y, Baharlouei A. 2010. Effects of dietary inclusion of sodium bentonite on biochemical characteristics of blood serum in broiler chickens. Intl J Agric Biol. 12:877–880.
- Santin E, Paulillo A, Maiorka P, Alessi A, Krabbe E, Maiorka A. 2002. The effects of ochratoxin/alumino-silicate interaction on the tissues and humoral immune response of broilers. Avian Pathol. 31:73–79.
- Scheideler S. 1993. Effects of various types of aluminosilicates and aflatoxin B1 on aflatoxin toxicity, chick performance, and mineral status. Poult Sci. 72:282–288.
- Schell T, Lindemann M, Kornegay E, Blodgett D, Doerr J. 1993. Effectiveness of different types of clay for reducing the detrimental effects of aflatoxin-contaminated diets on performance and serum profiles of weanling pigs. J Anim Sci. 71:1226–1231.
- Shotwell O, Hesseltine C, Stubblefield R, Sorenson W. 1966. Production of aflatoxin on rice. Appl Microbiol. 14:425–428.
- Singh G, Chauhan H, Jha G, Singh K. 1990. Immunosuppression due to chronic ochratoxicosis in broiler chicks. J Comp Pathol. 103:399–410.
- Sirhan A, Tan G, Wong R. 2012. QuEChERS extraction and HPLC-FLD determination of ochratoxin A in cereals and cereal products. Asian J Chem. 24:4551–4554.
- Tauqir N, Sultan J, Nawaz H. 2001. Effect of different levels of bentonite with varying energy levels on the performance of broilers. Intl J Agric Biol. 3:85–88.
- Tejada A, Rustia A. 2011. Risk assessment of contaminants in foods: Mycotoxins and pesticide residues. Proceedings of FFTCeKU Conference, International Seminar on Risk Assessment and Risk Management of Mycotoxins for Food Safety in Asia. Thailand: Kasetsart University.
- Thieu N, Ogle B, Pettersson H. 2008. Efficacy of bentonite clay in ameliorating aflatoxicosis in piglets fed aflatoxin-contaminated diets. Trop Anim Health Prod. 40:649–656.
- Trenk H, Butz M, Chu F. 1971. Production of ochratoxins in different cereal products by Aspergillus ochraceus. Appl Microbiol. 21:1032–1035.
- ul-Hassan Z, Khan M, Khan A, Javed I, Noreen M. 2011a. In vivo and ex vivo phagocytic potential of macrophages from progeny of breeder hens kept on ochratoxin A (OTA)-contaminated diet. J Immunotoxicol. 9:401–408.
- ul-Hassan Z, Khan M, Saleemi M, Khan A, Javed I, Hussain A. 2011b. Immunological status of White Leghorn chicks hatched from eggs inoculated with ochratoxin A (OTA). J Immunotoxicol. 8:204–209.
- ul-Hassan Z, Khan M, Saleemi M, Khan A, Javed I, Noreen M. 2011c. Immunological responses of male White Leghorn chicks kept on ochratoxin A (OTA)-contaminated feed. J Immunotoxicol. 9:301–308.
- ul-Hassan Z, Khan M, Saleemi M, Khan A, Javed I, Noreen M. 2012. Immunological responses of male White Leghorn chicks kept on ochratoxin A (OTA)-contaminated feed. J Immunotoxicol. 9:56–63.
- Verma J, Johri T, Swain B, Ameena S. 2004. Effect of graded levels of aflatoxin, ochratoxin and their combinations on the performance and immune response of broilers. Br Poult Sci. 45:512–518.
- Yunus A, Razzazi-Fazeli E, Bohm J. 2011. Aflatoxin-B1 in affecting broiler's performance, immunity, and gastrointestinal tract: A review of history and contemporary issues. Toxins 3:566–590.
- Zain M. 2011. Impact of mycotoxins on humans and animals. J Saudi Chem Soc. 15:129–144.