
Abstract
Type 1 diabetes (T1D) is a T-cell-mediated autoimmune disorder characterized by destruction of insulin-producing pancreatic β-cells. Whereas epidemiological data implicate environmental factors in the increasing incidence of T1D, their identity remains unknown. Though exposure to bisphenol A (BPA) has been associated with several disorders, no epidemiologic evidence has linked BPA exposure and T1D. The goal of this study was to elucidate diabetogenic potentials of BPA and underlying mechanisms in the context of T-cell immunity, in a multiple low-dose streptozotocin (MLDSTZ)-induced autoimmune mouse T1D model. C57BL/6 mice were orally exposed to 1 or 10 mg BPA/L starting at 4 wk of age; diabetes was induced at 9 wk of age with STZ. T-cell composition, function, and insulitis levels were studied at Days 11 and 50 during diabetes development (i.e. post-first STZ injection). Results showed both BPA doses increased diabetes incidence and affected T-cell immunity. However, mechanisms of diabetogenic action appeared divergent based on dose. Low-dose BPA fits a profile of an agent that exhibits pro-diabetogenic effects via T-cell immunomodulation in the early stages of disease development, i.e. decreases in splenic T-cell subpopulations [especially CD4+ T-cells] along with a trend in elevation of splenic T-cell formation of pro-inflammatory cytokines (IFN-γ, TNF-α, and IL-6). In contrast, high-dose BPA did not affect T-cell populations and led to decreased levels of IFN-γ and TNF-α. Both treatments did not affect insulitis levels at the disease early stage, but aggravated it later on. By the study end, besides decreasing T-cell proliferative capacity, low-dose BPA did not affect other T-cell-related parameters, including cytokine secretion, comparable to the effects of high-dose BPA. In conclusion, this study confirmed BPA as a potential diabetogenic compound with immunomodulatory mechanisms of action – in the context of T-cell immunity – that seemed to be dose dependent in the early immunopathogenesis of a MLDSTZ-induced model of T1D.
Introduction
Type 1 diabetes (T1D) is an autoimmune disease characterized by a complete lack of insulin and subsequent hyperglycemia due to the immune T-cell-mediated attack and destruction of the pancreatic insulin-producing β-cells. The incidence and prevalence of T1D have been steadily rising in developed countries over the past few decades (Dabelea et al. Citation2014). It is known that both genetics and environmental factors contribute to the etiopathogenesis of disease. Although many environmentally related hypotheses, including hygiene, diet, viral infections, and environmental pollutants, have been proposed, the reason for such an increase in T1D is still unknown (Knip and Simell Citation2012). Over the past years, research into the role of environmental pollutants in diabetes development has been expanding (Taylor et al. Citation2013; Bodin et al. Citation2015).
Bisphenol A (BPA) is utilized in polycarbonate plastics and epoxy resins that have broad applications in manufacturing, such as food/beverage plastic containers, inner can linings, dental sealants, medical devices (Shelby Citation2008; Willhite et al. Citation2008). Biomonitoring studies have shown frequent and widespread human exposure (Calafat et al. Citation2005, Citation2008), often related to leaking of BPA into foods and beverages (USFDA Citation2010; WHO Citation2010). Multiple epidemiological studies have indicated associations between BPA exposure and adverse human health effects (Melzer et al. Citation2010; LaKind et al. Citation2012; Spanier et al. Citation2012), including Type 2 diabetes (T2D) and associated conditions (Carwile and Michels Citation2011; Silver et al. Citation2011; Teppala et al. Citation2012; Sowlat et al. Citation2016). Nevertheless, to date, an epidemiological study evaluating the relation between BPA exposure and T1D development has not been performed.
The role of environmental agent-influenced immune dysfunction in diseases has been underestimated (Dietert et al. Citation2010). While various effects of BPA on immune responses have been observed, most of the reported effects have often contradicted one another. In general, BPA exposure in mice has been associated with modulation of TH1/TH2 cytokine and antibody production (Youn et al. Citation2002; Lee et al. Citation2003; Yoshino et al. Citation2003, Citation2004; Alizadeh et al. Citation2006; Goto et al. Citation2007; Yan et al. Citation2008). Concerning relationships between environmental pollutants and T1D in experimental models, recent studies reported aggravation of disease with exposure to p,p′-dichlorodiphenyldichloroethylene (DDE) (Cetkovic-Cvrlje et al. Citation2016), and suppression of T1D with polychlorinated biphenyl 153 (PCB-153) in non-obese diabetic (NOD) mice (Kuiper et al. Citation2016). In considering any BPA association with T1D, a potentiation of disease has been suggested, primarily based on aggravation of insulitis levels. However, neither a significant difference in incidence of T1D in BPA-exposed NOD mice was observed nor were the effects of BPA on T-cells during development of T1D studied (Bodin et al. Citation2013).
Experimental T1D models, like multiple low-dose streptozotocin (MLDSTZ)-induced T1D in C57BL/6 mice (Like and Rossini Citation1976; Muller et al. Citation2002; Cetkovic-Cvrlje and Uckun Citation2005), along with NOD mice (Shoda et al. Citation2005) with their spontaneous disease development, have been accepted as models for studying immunopathogenesis of this autoimmune disorder and the effects of different compounds on its protection/aggravation. MLDSTZ-induced mouse T1D, similar to human, is a T-cell-mediated disease characterized by cytokine imbalance and insulitis [mononuclear cell infiltration of islets]. Several subsets of T-cells, characterized by different immunophenotypes and cytokine profiles, have been implied as major players in T1D immunopathogenesis. Besides cytotoxic T-cells, the T-helper (TH)1/TH2 paradigm – while oversimplified – has provided a conceptual scaffold for understanding the immunopathogenesis of T1D. TH1 responses, cytokines interleukin (IL)-2 and interferon (IFN)-γ, have been considered pathogenic in contrast to protective TH2 responses mediated by IL-4 and IL-10 (Cetkovic-Cvrlje and Uckun Citation2005; Sia Citation2005). More recently, regulatory T (Treg)-cells have been recognized as protective and TH17 as harmful, in development of T1D (Sia Citation2005; Cetkovic-Cvrlje et al. Citation2012).
This study sought to investigate the effects of BPA exposure on T1D development in the context of systemic immunity alterations in a MLDSTZ mouse model. As T1D is a T-cell-dependent and T-cell-mediated disease (Cetkovic-Cvrlje et al. Citation2003, Citation2012; Cetkovic-Cvrlje and Uckun Citation2005), the effects of BPA on T-cells were studied in order to address potential mechanisms of BPA action. It was hypothesized that BPA, if exhibiting diabetogenic properties, would increase the incidence of T1D in MLDSTZ-treated mice through alterations in T-cell composition/function. To test this, spleen cell counts, viability, T-cell subsets (and other immune cell types), and T-cell function (proliferation ability and cytokine formation) were evaluated during BPA exposures of MLDSTZ-treated C57BL/6 mice.
Materials and methods
Mice
C57BL/6 J breeding pairs were purchased from the Jackson Labs (Bar Harbor, ME), and bred at Saint Cloud State University. Mice were housed in BPA-free NexGen Lo-Profile caging systems (Allentown Inc., Allentown, NJ) in temperature (22 °C)- and relative humidity (40–60%)-controlled rooms with a 12-hr light/dark cycle. All mice had ad libitum access to casein-based phytoestrogen-free food (AIN-93 G Rodent Diets, Harlan, Indianapolis, IN) and filtered water. All protocols/procedures were approved by the Saint Cloud State University IACUC prior any experimentation (Protocol ID #5–75).
BPA preparation and administration
BPA (1 and 10 mg; Sigma, St. Louis, MO) was dissolved in 0.01% [v/v] ethanol, mixed in 1 L de-ionized (DI) autoclaved water, and heated to 60 °C. As a control, ethanol was added to autoclaved DI water at a level as in the BPA solutions. Addition of BPA to drinking water at the levels here (1 and 10 mg/L) – as before (Bodin et al. Citation2013) – did not affect drinking habits/water intake. Pilot studies showed an average male 25-g mouse drank ∼4 ml water/d, regardless of BPA addition. Based on daily water intake, 1 and 10 mg BPA/L doses corresponded to ∼160 and 1600 μg BPA/kg/d, respectively. The water was first provided to 4-wk-old male mice in BPA-free glass bottles with rubber sips; levels were checked daily and bottles re-filled accordingly. Water bottles were autoclaved and changed weekly (i.e. filled with fresh BPA/control solutions).
Induction of multiple low doses of streptozotocin (MLDSTZ) model of T1D
For the MLDSTZ model, on five consecutive days, streptozotocin (STZ, Sigma-Aldrich, St. Louis, MO) was injected at 40 mg/kg/d (intraperitoneally [i.p.]) to control and BPA-treated 9-wk-old male mice (Cetkovic-Cvrlje and Uckun Citation2005). Prior to each dosing, STZ was dissolved in 0.05 M citrate buffer (pH 4.5), vortexed, and within 20 min i.p. injected at 6.7 μl/g (ter Veld et al. Citation2008). Activity was then monitored post-injection for any abnormal behavior.
Experimental design
Diabetes incidence studies
Mice (4 wk old) were randomly placed in groups and then subchronically exposed to 1 or 10 mg BPA/L [or vehicle] in drinking water before and after induction of T1D. At 9 wk of age, all mice received the five low-dose STZ injections to induce T1D. Glycemia and body weight measures were taken prior to the BPA exposure, on day of first STZ treatment, on Days 5–7 post-first STZ injection (STZ1), and biweekly from Day 8 to Day 50 post-STZ1 (end of experiment).
Immune parameters studies
To study potential BPA mechanisms of action in MLDSTZ-induced T1D development, low (1 mg/L)- or high-dose (10 mg/L) BPA mice, that had been injected with STZ, were euthanized by CO2 asphyxiation at Days 11 or 50 post-STZ1. At necropsy, spleens were removed and single-cell suspensions prepared according to Cetkovic-Cvrlje et al. (Citation1997) for analyzing cell counts, viability, T-cell proliferation, immunophenotyping, and cytokine profiling.
Blood glucose and body weight measurements
At designated time points, a lateral tail vein puncture was performed and 0.6 μl blood placed onto an Accu-Chek Aviva blood glucose meter strip (Roche Diagnostics, Indianapolis, IN) to determine blood glucose levels. This sampling is considered to have minimal physiologic impact on an animal and requires no anesthesia, allowing for accurate blood glucose measurement (Lee and Goosens Citation2015). Testing was performed biweekly, starting on Day 8 post-STZ1 (as hyperglycemia was observed for first time at that time point), until the experiment end. A mouse was considered diabetic after two consecutive readings of ≥250 mg glucose/dl. Body weights were measured at the times of blood sampling.
Histological evaluation of insulitis
Insulitis reflects mononuclear cell infiltration into pancreatic islets; its level is believed to correlate with β-cell destruction (Cetkovic-Cvrlje et al. Citation1997). Control and BPA-exposed mice were euthanized on Days 11 or 50 post-STZ1, pancreata were harvested, and the tissues fixed in 10% formalin solution and embedded in paraffin. Sections (5 μm) were prepared, stained with hematoxylin and eosin, and then three sections per mouse were examined by light microscopy. All islets present in the sections were graded on a scale from 0 to 4 for insulitis, according to the area of an islet infiltrated by lymphocytes (Cetkovic-Cvrlje et al. Citation1997, Citation2003). The insulitis grading scale was as follows: level 0 = no infiltration; level 1 = ≤ 25%; level 2 = ≥ 25–50%, level 3 = ≥ 50–75%; and level 4 = ≥ 75% intra-islet infiltration. An insulitis index was calculated by dividing the sum of all assigned insulitis scores in a pancreas by the number of examined islets.
T-cell proliferation
Ex vivo proliferation assays were performed according to Cetkovic-Cvrlje et al. (Citation2016). In brief, splenocytes (4 × 10⁶ cells/ml) from BPA-treated and control mice were separately suspended in RPMI-1640 medium containing 1 U penicillin/ml, 100 μg streptomycin/ml and 10% fetal calf serum (FCS) (each Sigma), with or without addition of 3 μg concanavalin A (ConA)/ml (Sigma). The cells were cultured for 72 hr at 37 °C under 5% CO2. Thereafter, proliferation was quantified using an Alamar Blue colorimetric assay (Invitrogen, Grand Island, NY) wherein dye was added to each well at 10% of total culture volume, the cells were incubated at 37 °C a further 5–7 hr, and optical densities were then measured in an ELISA plate reader (GeneMate, Kaysville, UT) at 570 nm.
Immunophenotyping
Splenocytes were also analyzed by flow cytometry (Cetkovic-Cvrlje et al. Citation2016; Kuiper et al. Citation2016; Cetkovic-Cvrlje and Uckun Citation2004). Specifically, individual aliquots of 106 splenocytes obtained from each mouse were suspended in FACS buffer (0.1% NaN3, 1% FCS in phosphate-buffered saline [PBS, pH 7.4]), stained with appropriate antibodies (at manufacturer-recommended levels), incubated in the dark at 4 °C for 30 min, washed, and analyzed in a FACSCalibur flow cytometer (BD Biosciences, San Diego, CA). Fluorochrome types and clones of antibodies (all from BD Biosciences) used for quantification of immune cell markers for CD4 (TH), CD8 (Tc), CD3 (T-cells), CD4/CD25 (Treg), CD45RB220 (B-cells), CD335 (NK cells) and CD11b (macrophages) were as follows: peridinin chlorophyll-a protein (PerCP)-conjugated anti-CD4 (clone RM4–5), fluorescein isothiocyanate (FITC)-conjugated anti-CD8 (clone 53–6.7), allophycocyanin (APC)-conjugated anti-CD25 (clone 3C7), phycoerythrin (PE)-conjugated anti-CD3 (clone 145–2C11), APC-conjugated anti-CD45RB220 (clone RA3–6B2), FITC-conjugated anti-CD335 (clone NKp36), and PerCP-conjugated anti-CDllb (clone M1/70). A minimum of 10,000 events was acquired for each analysis. Immunophenotype analyses were performed using CellQuest Pro software (BD Biosciences). As percentages of CD4+FoxP3+ splenocytes analyzed in pilot experiments were similar and comparable to percentages of CD4+CD25+ cells (Cetkovic-Cvrlje et al. Citation2012; Kuiper et al. Citation2016 and data not shown), CD4+CD25+ double staining was used as an indicator of Treg-cell subpopulation size.
Cytokine analysis
IL-2, IL-4, IL-10, IL-17, IFN-γ, and tumor necrosis factor (TNF)-α levels in the supernatants of 48-hr cultured ConA-stimulated splenocytes (parallel cultures run under conditions described for T-cell proliferation assay) were quantified using a BD Biosciences cytometric bead assay (CBA) mouse TH1/TH2/TH17 kit (Cetkovic-Cvrlje et al. Citation2016; Kuiper et al. Citation2016). Cytokine concentrations were analyzed by FCAP Array software (SoftFlow, New Brighton, MN). The level of sensitivity was 0.1 pg IL-2/ml, 0.03 pg IL-4/ml, 16.8 pg IL-10/ml, 0.8 pg IL-17/ml, 0.5 pg IFN-γ/ml, and 0.9 pg TNF-α/ml.
Statistical analysis
A resource equation method for sample size determination and justification of animal numbers was used. Differences in diabetes incidence among experimental groups were determined by life-table analyses and log-rank test (Mantel–Cox), using the statistical software program SPSS (IBM, Armonk, NY); data are presented as percentage of diabetes-free mice over the entire experimental period. For blood glucose levels and body weights, a one-way analysis of variance (ANOVA) with repeated measures was used. For all other experiments (immunophenotyping, T-cell proliferation, cytokine profiles), a Student’s t-test was performed. A p value <0.05 was considered significant.
Results
Effect of BPA exposure on T1D development
To test whether BPA exposure would affect development of T1D in MLDSTZ model of disease, mice were treated with either low (1 mg/L) or high (10 mg/L) doses of BPA over the period of 4–16 wk of age. At 9 wk of age, both BPA-treated and control group of mice received five daily injections of streptozotocin (STZ) to induce diabetes. At the beginning of the experimental period, there were no significant differences in glucose levels and body weights between control, low-, and high-dose BPA mice (data not shown). Regular biweekly glucose and body weight measurements began on Day 8 (post-first STZ injection [STZ1]) and lasted throughout the BPA exposure, i.e. until Day 50 post-STZ1. During the course of the 12-wk BPA exposure period, there were no mortality and no relevant clinical signs of toxicity observed in either drug-treated group.
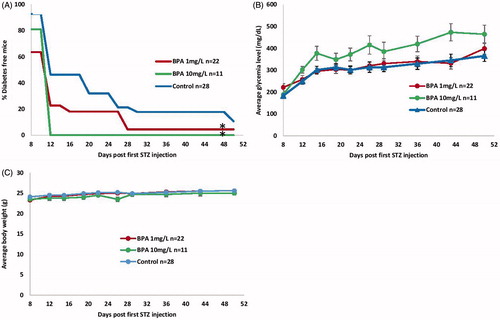
Overall, T1D incidence was significantly increased in both low- and high-dose BPA-exposed mice (p ≈ 0.04 and p ≈ 0.02, respectively) vs. in control mice (). On Day 8 post-STZ1, only 63.6 and 81.0% mice in the high- and low-dose groups were diabetes-free, respectively, compared to 92.8% of the controls. A dramatic decrease in numbers of diabetes-free mice was observed on Day 12 post-STZ1 in the high-dose group (0.0%); this value was 22.7% in low-dose mice and 46.4% in controls. By Day 50, the controls were 11% disease-free, whereas the 1 mg BPA/L group was 4.4% disease-free. Interestingly, though the high-dose BPA group expressed a tendency of increased diabetes incidence compared to low-dose mice, the difference was not significant. In addition, the high-dose group showed a trend toward higher glycemia levels compared to the controls, albeit without attaining statistical relevance (). Apart from all these important changes, body weights of the BPA-exposed mice were not affected by either treatment ().
Figure 1. Diabetes development in MLDSTZ-treated C57BL/6 mice exposed to BPA. Male C57BL/6 mice (4 wk old) received either 1 or 10 mg/L BPA orally via drinking water for up to 16 wk of age; control mice received vehicle-treated water. MLDSTZ was injected at 9 wk of age via five consecutive daily i.p. injections. Glycemia and body weights were determined biweekly from Day 8 to Day 50 post-first STZ injection. A mouse was considered diabetic after two consecutive readings of ≥250 mg glucose/dl. (A) Diabetes incidence; presented as percentage diabetes-free. *p < 0.05 vs. controls. (B) Glycemia (mg/dl). (C) Body weights (g). Data shown are means ± SEM (n = 11–28/group).
BPA effects on insulitis levels
Insulitis levels in pancreatic islets of all groups of mice were studied on Days 11 and 50 post-STZ1. Insulitis indices obtained in control, low-dose and high-dose BPA mice on Day 11 did not differ (data not shown). On Day 50, indices for control, low-dose and high-dose BPA groups were as follows: 1.3 [± 0.2] (n = 15), 2.4 [± 0.4] (n = 12), and 2.3 [± 0.5] (n = 13), respectively. These increases were in both cases significant (p < 0.001) vs. control. The two groups of BPA-treated mice did not differ among themselves in magnitude of islet mononuclear infiltration.
BPA effects on immune parameters
Given the ability of BPA to increase the incidence of autoimmune MLDSTZ, studies were done to discern possible underlying mechanism(s) of BPA action on the immune system during disease development. Considering efficacy of both low and high BPA doses in accelerating T1D development in MLDSTZ-treated mice, the same doses and regimens described in experiments that followed incidence of diabetes were utilized. Here, total splenic cell counts, viability, immunophenotypes (major T-cell subsets/other immune cell types), ex vivo T-cell proliferation, and ex vivo T-cell cytokine formation profiles were evaluated at two time points, i.e. early and late in the course of disease development (Days 11 and 50 post-STZ1).
Day 11
The results showed there were no significant differences in total splenic cell counts between control (119.4 [± 15.1] × 106), low-dose (96.4 [± 18.7] × 106) and high-dose BPA-exposed mice (129.3 [± 17.3] × 106). The viability of splenocytes was similar in all groups: 90.3, 91.3, and 90.5%, respectively, in the three groups. There were no differences in proliferative capacity of mitogen-stimulated splenic T-cells from 10 mg/L BPA-exposed mice (). A significantly higher (p = 0.001) spontaneous proliferation was observed in splenocytes from 1 mg/L BPA-exposed mice; Con A stimulation did not induce higher responses in cells compared to control cells (). Immunophenotypes among spleen immune cells, in terms of percentages, showed a significant decrease in all T-cells (CD3+) (p < 0.005), including CD4+ (p < 0.01) and CD8+ T-cells (p < 0.05), as well as NK cells (p ≈ 0.01), and a significant increase in B-cell levels (p = 0.005) in low-dose BPA mice compared to control mouse values (). When presented as absolute cell counts, a significant reduction (p = 0.01) in splenic CD4+ T-cell levels in the 1 mg/L mice [compared to controls] was observed (). In contrast, there were no differences observed in either percentages or absolute cell counts of immune cells obtained from 10 mg/L treatment group compared to controls (). Analysis of cytokines obtained from ConA-stimulated splenocytes from the low-dose BPA mice showed a trend toward increases in formation/release of pro-inflammatory TNF-α, IL-6, and IFN-γ, and a trend toward decreases in IL-2, IL-4, and IL-17, compared to values for control mouse cells (). Interestingly, high-dose BPA induced a significant decrease in TNF-α (p < 0.001 and p < 0.01 vs. control and low-dose BPA, respectively) and IFN-γ (p < 0.001 vs. control, p < 0.001 vs. low-dose BPA ()).
Figure 2. T-cell proliferation, immunophenotyping, and cytokine analysis of splenocytes isolated from BPA-exposed and MLDSTZ-treated mice on Day 11 post-first STZ injection. Mice were exposed to 1 or 10 mg BPA/L and treated by MLDSTZ [see Figure 1] and then euthanized on Day 11 post-first STZ injection. Splenocytes were isolated and analyzed in (A) T-cell proliferation assays, or by flow cytometry for (B and C) immunophenotyping and (D) cytokine secretion. (A) Splenocytes cultured in absence (unstimulated) or presence (stimulated) of ConA for 72 hr; proliferation was then measured via Alamar Blue assay. (B) Percentages and (C) total numbers (×106) of splenic T-helper (TH), cytotoxic (TC), regulatory (Treg), and total T-cells (T), as well as of B-cells (B), macrophages (MAC), and NK cells (NK). (D) Cytokines were assessed in supernatants of splenocytes cultured for 48 hr in the presence of ConA using a CBA mouse TH1/TH2/TH17 kit by flow cytometer. Data shown are means ± SEM; n = 8–17 (A), 7–17 (B and C), and 7–9 (D)/group. *p < 0.05 vs. controls; **p < 0.05 vs. BPA-treated group.
![Figure 2. T-cell proliferation, immunophenotyping, and cytokine analysis of splenocytes isolated from BPA-exposed and MLDSTZ-treated mice on Day 11 post-first STZ injection. Mice were exposed to 1 or 10 mg BPA/L and treated by MLDSTZ [see Figure 1] and then euthanized on Day 11 post-first STZ injection. Splenocytes were isolated and analyzed in (A) T-cell proliferation assays, or by flow cytometry for (B and C) immunophenotyping and (D) cytokine secretion. (A) Splenocytes cultured in absence (unstimulated) or presence (stimulated) of ConA for 72 hr; proliferation was then measured via Alamar Blue assay. (B) Percentages and (C) total numbers (×106) of splenic T-helper (TH), cytotoxic (TC), regulatory (Treg), and total T-cells (T), as well as of B-cells (B), macrophages (MAC), and NK cells (NK). (D) Cytokines were assessed in supernatants of splenocytes cultured for 48 hr in the presence of ConA using a CBA mouse TH1/TH2/TH17 kit by flow cytometer. Data shown are means ± SEM; n = 8–17 (A), 7–17 (B and C), and 7–9 (D)/group. *p < 0.05 vs. controls; **p < 0.05 vs. BPA-treated group.](/cms/asset/4ce501ef-b82b-4afd-b529-dd41f97f7228/iimt_a_1334722_f0002_c.jpg)
Day 50
Total splenic cell counts as well as viability did not differ among the BPA-exposed and control MLDSTZ-treated mice (data not shown). T-cell proliferation data showed a significant increase in spontaneous proliferation of splenocytes from high-dose BPA group compared to both control (p = 0.001) and low-dose treatment group (p = 0.003) (). In ConA-stimulated T-cell cultures, while a trend of increased proliferation was observed in the high-dose BPA group, a significant suppression of proliferation was found in the low-dose group compared to both control (p < 0.002) and high-dose BPA-exposed group (p < 0.001). In contrast to immunophenotyping results obtained at the early endpoint, there were no differences observed in the percentages, as well as absolute cell counts of analyzed cell types on Day 50 post-STZ1 in low-dose BPA mice, compared to control values (). High-dose-BPA mice also expressed comparable percentages and absolute cell numbers of analyzed cell types to controls. Cytokine analysis revealed that, besides a trend of lowering IL-4 and IL-2 levels that was observed at early time point in the high-dose treatment group as well, all other cytokines levels were comparable to control values (). It is notable there was even a trend toward an increase in pro-inflammatory IFN-γ and IL-6 levels. Levels of the studied cytokines in the low-dose BPA mice were not significantly affected compared to controls; however, a trend toward lower levels of IL-2 and IFN-γ, and increased levels of IL-6, was observed in the low-dose mice.
Figure 3. T-cell proliferation, immunophenotyping, and cytokine analysis of splenocytes isolated from BPA-exposed and MLDSTZ-treated mice on Day 50 post-first STZ injection. Mice were exposed to 1 or 10 mg BPA/L and treated by MLDSTZ [see Figure 1] and then euthanized on Day 50 post-first STZ injection. Splenocytes were isolated and analyzed in (A) T-cell proliferation assays, or by flow cytometry for (B and C) immunophenotyping and (D) cytokine secretion. (A) Splenocytes cultured in absence (unstimulated) or presence (stimulated) of ConA for 72 hr; proliferation was then measured via Alamar Blue assay. (B) Percentages and (C) total numbers (×106) of splenic TH, TC, Treg, and total T-cells (T), as well as B-cells, MAC, and NK cells. (D) Cytokines were assessed in supernatants of splenocytes cultured for 48 hr in the presence of ConA using a CBA mouse TH1/TH2/TH17 kit by flow cytometer. Data shown are means ± SEM; n = 8–17 (A), 11–24 (B and C), and 6–9 (D)/group. *p < 0.05 vs. controls; **p < 0.05 vs. BPA-treated group.
![Figure 3. T-cell proliferation, immunophenotyping, and cytokine analysis of splenocytes isolated from BPA-exposed and MLDSTZ-treated mice on Day 50 post-first STZ injection. Mice were exposed to 1 or 10 mg BPA/L and treated by MLDSTZ [see Figure 1] and then euthanized on Day 50 post-first STZ injection. Splenocytes were isolated and analyzed in (A) T-cell proliferation assays, or by flow cytometry for (B and C) immunophenotyping and (D) cytokine secretion. (A) Splenocytes cultured in absence (unstimulated) or presence (stimulated) of ConA for 72 hr; proliferation was then measured via Alamar Blue assay. (B) Percentages and (C) total numbers (×106) of splenic TH, TC, Treg, and total T-cells (T), as well as B-cells, MAC, and NK cells. (D) Cytokines were assessed in supernatants of splenocytes cultured for 48 hr in the presence of ConA using a CBA mouse TH1/TH2/TH17 kit by flow cytometer. Data shown are means ± SEM; n = 8–17 (A), 11–24 (B and C), and 6–9 (D)/group. *p < 0.05 vs. controls; **p < 0.05 vs. BPA-treated group.](/cms/asset/4f021f76-680a-414a-94f1-1afb65920bf2/iimt_a_1334722_f0003_c.jpg)
Discussion
This study investigated the effects of BPA exposure on development of T1D in a chemically induced experimental (MLDSTZ) mouse model. The results clearly showed that subchronic daily exposure of MLDSTZ-treated C57BL/6 mice to low, as well as high, BPA doses increased the incidence of T1D. In addition, BPA action on the immune system, specifically T-cells, during development of T1D, was indicated by alterations in T-cell subsets, T-cell proliferation, and cytokine profiles. However, low- and high-dose BPA exposures, while both being diabetogenic, expressed different effects on the T-cell composition and function, indicating their divergent mode of action during the disease development.
The results presented herein generally corroborated the diabetogenic potential of BPA observed by Bodin et al. (Citation2013). However, those 2013 results, whereas showing a trend toward augmentation of T1D incidence by continuous oral exposure of young NOD mice to 1 mg/L BPA, failed to confirm statistical significance for the data. In addition, whereas the current data showed potentiation of T1D by exposure to BPA at both concentrations [1 and 10 mg/L], previous studies suggested potentiation of T1D by 1 mg BPA/L and protection by 100 mg BPA/L (Bodin et al. Citation2013). The differences could be attributed to usage of different experimental models of T1D, or that the threshold dose for observing different BPA effect was not reached in our study. The current study also used a MLDSTZ model of T1D in contrast to a genetically predisposed NOD mouse model that spontaneously develops disease that was used previously. MLDSTZ model allows an investigation of the effects of potentially toxic substances (such as BPA) in the environment where insulin-producing β-cells have been partially damaged by STZ. This model has an advantage of mimicking a potential scenario present in humans who had already been exposed to environmental pollutants before or along the exposure to other β-cell-damaging substances, such as drugs, food, other chemicals, or pathogens.
The oral BPA route used in the experimental design here seemed the most relevant way for comparisons to human exposures, as humans obtain BPA mainly through food intake (USFDA Citation2010; WHO Citation2010). Further, the doses of BPA exposure chosen herein 1 and 10 mg/L corresponding to ∼160 and 1600 μg BPA/kg/d, respectively, were comparable to those used in previous animal studies (Youn et al. Citation2002; Yoshino et al. Citation2003, Citation2004; Goto et al. Citation2007; Bodin et al. Citation2013, Citation2014). At the time when the experimental design was planned, a BPA dose of 160 μg/kg/d was three-fold higher than the tolerable daily intake (TDI) of 50 μg BPA/kg defined by the European Food Safety Authority (EFSA) (EFSA Citation2006). Since EFSA recently lowered the TDI to 4 μg/kg/d (EFSA Citation2015), the present doses can be considered “relatively high and questionable” as relevant for human exposure. However, considering that the BPA no-observed-adverse-effect level (NOAEL) for humans is still 5 mg/kg (FDA Citation2008), and that the EFSA report emphasized uncertainties surrounding potential health effects of different BPA exposure levels on different body systems, including immune system (EFSA Citation2015), we believe the BPA dosage used here was relevant. Moreover, the BPA exposure levels here fell in the dose range defined as “low” (2–2700 μg/kg/d) in subchronic studies performed by Delclos et al. (Citation2014) and chronic studies by Heindel et al. (Citation2015) in mice aimed at defining adverse effects of low-dose BPA exposures on different body systems (including immune).
To study mechanisms of BPA diabetogenic action in the etiopathogenesis of T1D, BPA effects on the immune system, and specifically T-cells, were studied here. The results showed that BPA affected the immune system; however, the results also illustrated there might be differing modes of diabetogenic action for low vs. high BPA doses. Specifically, low-dose BPA resulted in decreased percentages and absolute numbers of splenic T-cells, especially CD4+ T-cells, and this was accompanied by a trend toward increased levels of pro-inflammatory cytokines, such as IFN-γ, TNF-α and IL-6 in the spleens of exposed mice early on (i.e. Day 11 post-STZ1) during T1D development. In contrast, high-dose BPA did not affect levels of T-cell subpopulations but did significantly reduce splenocyte IFN-γ and TNF-α production.
The low-dose BPA effects, i.e. a decrease of TH subpopulations and increase in pro-inflammatory cytokines, fit a typical T-cell-dependent pro-diabetogenic compound profile. The high-dose BPA exposure, while exhibiting comparable if not more pronounced effect on diabetes incidence and severity of disease (although not significantly different than those observed in the low-dose group), seemed not to induce diabetogenic action through pro-inflammatory response potentiation, at least not in the early stages of disease development. Interestingly, previous work by Bodin et al. (Citation2013) suggested an increase of insulitis severity through apoptotic death of pancreatic islet cells and residential macrophages, without any systemic immune system influences, as a mechanism of subchronic BPA action in potentiation of T1D development. Unfortunately, since T-cell responses were not simultaneously elucidated in that study, such a one-sided characterization of BPA diabetogenic mechanisms should be reevaluated. Especially considering that even protective BPA dose of 100 mg/L, found by the same authors to inhibit T1D development in NOD mice, exhibited the same mechanism of action and potentiated insulitis severity like the pathogenic BPA dose (Bodin et al. Citation2013).
Not surprisingly, the immune parameter studies obtained at the end of the experimental period (i.e. Day 50 post-STZ1), when nearly all mice exhibited full-blown disease, showed that both low- and high-dose BPA treatments did not affect T-cell numbers even though T-cell proliferation was suppressed in the low-dose BPA mice. Interestingly, in contrast to findings at the early stage of disease development, splenic IFN-γ and TNF-α levels showed a tendency toward becoming increased in the high-dose mice.
It has been shown that hyperglycemia per se can suppress T-cell function; T-cells cultured under high glucose concentrations displayed decreased proliferation (Sakowicz-Burkiewicz et al. Citation2006). Considering higher glycemic values observed in high-dose BPA-treated mice, a hyperglycemic influence might be implied as a cause of “weak” early immune responses, reflected in diminished secretion of cytokines, in comparison with low-dose treatment group. However, taking into account differential immune profiles and immune responses observed in low- vs. high-dose BPA-exposed mice and glycemic effects, one would expect potentiation of those findings with prolonged duration of disease and increased hyperglycemia values toward the end of experiment. In contrast, on Day 50 post-STZ1, when average hyperglycemia was 369 [± 24] and 432 [± 41] mg/dL in the low- and high-dose BPA-exposed groups, respectively, high-dose treatment group exhibited more robust production of select inflammatory cytokines compared to suppressed levels observed at the earlier time point.
Whereas direct and indirect effects of BPA on pancreatic β-cells were not studied here, it is plausible to propose that high-dose BPA could initially affect β-cells, thus augmenting diabetes development via different mechanism. For example, Lin et al. (Citation2013) found that BPA affects insulin secretion and induces apoptosis of pancreatic β-cells. In addition, BPA was found to induce apoptotic cell death of pancreatic islet cells in NOD mice exposed to it either early in life (Bodin et al. Citation2013) or transmaternally (Bodin et al. Citation2014). Interestingly, whereas augmented insulitis levels were observed in these studies (Bodin et al. Citation2013, Citation2014) in BPA-exposed NOD mice at an early stage of T1D development, data here showed increased lymphocytic infiltration in islets of low- and high-dose BPA mice only at the late endpoint, with no differences early on.
In concurrence with what is known about BPA effects on the immune system and T-cells, a large number of studies have reported an augmentation of TH1 responses due to BPA exposure (Youn et al. Citation2002; Yoshino et al. Citation2003, Citation2004; Alizadeh et al. Citation2006; Goto et al. Citation2007). However, an increase in TH2 responses has been also observed (Lee et al. Citation2003; Yan et al. Citation2008). Some reasons for the contradictions among these reports could include the differences among mouse strains, dosage, routes, and solvents used for BPA administration in the experimental protocols. Those studies that are in agreement with the present data about potentiation of TH1-type responses used similar dosages (between 0.015 and 3 mg/kg/d), and an oral route for BPA exposures (Youn et al. Citation2002; Yoshino et al. Citation2003, Citation2004; Goto et al. Citation2007), in contrast to high doses (23–46 mg/kg/d) administered by intraperitoneal and subcutaneous routes in studies that emphasized there were effects that manifest as TH2 responses (Lee et al. Citation2003; Yan et al. Citation2008). Interestingly, in a previous study that examined effects of phthalates and BPA on T1D development, treatment of NOD mice with 1 mg BPA/L (via drinking water; mice exposed in utero from conception [via dams being exposed] and then postnatally until 11 wk of age) gave rise to decreased splenocyte production of IL-4 and IL-10, with a trend toward increases in IFN-γ (Bodin et al. Citation2015). Similarly, the present data showed that in addition to a trend toward increases in IFN-γ, there was a trend toward decreased splenic levels of IL-4 in both low- and high-dose BPA-exposed hosts. One could hypothesize along the lines of previous studies in MLDSTZ models of T1D (Muller et al. Citation2002) that a decrease in protective TH2-type IL-4 might have a substantial role in early phase BPA-induced potentiation of T1D development. This could provide an alternate hypothesis about the impact of BPA-induced T-cell-related immunomodulation on the development of T1D.
The precise mechanisms underlying immunomodulatory effects of BPA in the pathogenesis of autoimmune disorders still remain to be clarified. Among several proposed mechanisms of BPA action on T-cells (reviewed in Kharrazian Citation2014 and Acconcia et al. Citation2015), estrogenic effects from estrogen-mimicking endocrine disruptors like BPA (as well as of estradiol itself (Karpuzoglu-Sahin et al. Citation2001) have been widely studied. Further, any BPA estrogenic activity might activate immune responses that contribute to ultimate development of autoimmune pathologies (Chailurkit et al. Citation2014). It is also known that BPA binding to estrogen receptors induces dysfunction of T-cell signal transduction pathways (Canesi et al. Citation2005); the latter are known to play pivotal roles in prevention of the upregulation of autoreactive T-cells (Wildner and Kaufmann Citation2013).
Conclusions
This study showed for the first time the effects of BPA exposure on T1D development in a STZ-induced mouse model of T1D. The outcomes revealed a strong diabetogenic potential of BPA, as aggravation of T1D development in low- and high-dose BPA groups of subchronically exposed STZ-treated C57BL/6 mice was observed. Augmentation of T1D by low-dose BPA in the early stage of disease development might be attributed to a significant decrease in T-cells, especially CD4+ TH cells, along with a trend toward increased expression of pro-inflammatory cytokines like IFN-γ, IL-6, and TNF-α. In comparison, high-dose BPA exposure was not accompanied by perturbations in T-cell levels, but there still was a significant impact on pro-inflammatory cytokine levels. These divergent outcomes suggest distinct mechanisms of diabetogenic action dependent on BPA dose. Though data from the mouse model here are not directly extrapolatable to humans, this study indicates a need for greater awareness about potential effects of BPA on human T1D. Further, while Taylor et al. (Citation2013) and Bodin et al. (Citation2015) emphasized that little or no data of direct relevance of environmental pollutants on T1D were available, in contrast to relationships between BPA and T2D, we believe the present study adds to the knowledge about relationships between BPA and T1D.
Acknowledgements
This study was supported by SCSU Office of Research and Sponsored Programs Student Research Grants to ST and KAB. The authors thank the undergraduate research students in the SCSU Immunology Laboratory, especially Erin Ebinger, Ashley Bisping, Amanda Byers, Elizabeth Blomker, Gayani Gamage, Kavitha Gobalan, Alicen Gorecki, Utku Hasbay, Cameron Johnson, Alesha McPhail, Matt Miller, Gabriella Pung, Shana Rogan, Taylor Schmit, Gabriel Tudor, and Justin Thorson, for their dedication and efforts toward completion of this project.
Disclosure statement
The authors declare no conflicts of interest. The authors alone are responsible for the content of this manuscript.
Additional information
Funding
References
- Acconcia F, Pallottini V, Marino M. 2015. Molecular mechanisms of action of BPA. Dose-Response. 13:1–9.
- Alizadeh M, Ota F, Hosoi K, Kato M, Sakai T, Satter M. 2006. Altered allergic cytokine and antibody response in mice treated with bisphenol A. J Med Invest. 53:70–80.
- Bodin J, Bølling A, Becher R, Kuper F, Løvik M, Nygaard U. 2014. Transmaternal bisphenol A exposure accelerates diabetes Type 1 development in NOD mice . Toxicol Sci. 137:311–323.
- Bodin J, Bølling A, Samuelsen M, Becher R, Løvik M, Nygaard U. 2013. Long-term bisphenol A exposure accelerates insulitis development in diabetes-prone NOD mice. Immunopharmacol Immunotoxicol. 35:349–358.
- Bodin J, Stene L, Nygaard U. 2015. Can exposure to environmental chemicals increase the risk of diabetes Type 1 development? Biomed Res Int. 2015:208947.
- Calafat A, Kuklenyik Z, Reidy J, Caudill S, Ekong J, Needham L. 2005. Urinary concentrations of bisphenol A and 4-nonylphenol in a human reference population. Environ Health Perspect. 113:391–395.
- Calafat A, Ye X, Wong L, Reidy J, Needham L. 2008. Exposure of the U.S. population to bisphenol A and 4-tertiary-octylphenol: 2003–2004. Environ Health Perspect. 116:39–44.
- Canesi L, Betti M, Lorusso L, Ciacci C, Gallo G. 2005. 'In vivo' effects of bisphenol A in Mytilus hemocytes: Modulation of kinase-mediated signalling pathways . Aquat Toxicol. 71:73–84.
- Carwile J, Michels K. 2011. Urinary bisphenol A and obesity: NHANES 2003–2006. Environ Res. 111:825–830.
- [USFDA] Center for Food Safety and Applied Nutrition. 2010. Exposure to bisphenol A for infants, toddlers and adults from the consumption of infant formula, toddler food and adult (Canned) food; [accessed 2017 Mar 8]. http://www.regulations.gov/#!documentDetail;D = FDA- 2010- N- 0100- 0009;oldLink = false.
- Cetkovic-Cvrlje M, Dragt A, Vassiley A, Liu X, Uckun F. 2003. Targeting JAK3 with JANEX-1 for prevention of autoimmune Type 1 diabetes in NOD mice. Clin Immunol. 106:213–225.
- Cetkovic-Cvrlje M, Gerling I, Muir A, Atkinson M, Elliot J, Leiter E. 1997. Retardation or acceleration of diabetes in NOD/Lt mice mediated by intra-thymic administration of candidate β-cell antigens. Diabetes. 46:1975–1982.
- Cetkovic-Cvrlje M, Olson M, Ghate K. 2012. Targeting Janus tyrosine kinase 3 (JAK3) with an inhibitor induces secretion of TGF-β by CD4+ T-cells. Cell Mol Immunol. 9:350–360.
- Cetkovic-Cvrlje M, Olson M, Schindler B, Gong H. 2016. Exposure to DDT metabolite p,p′-DDE increases autoimmune Type 1 diabetes incidence in NOD mouse model. J Immuno Toxicol. 13:108–118.
- Cetkovic-Cvrlje M, Uckun F. 2004. Dual targeting of Bruton’s tyrosine kinase and JAK3 with rationally designed inhibitors prevents graft-vs.-host disease (GVHD) in a murine allogeneic bone marrow transplantation model. Br J Haematol. 126:821–827.
- Cetkovic-Cvrlje M, Uckun F. 2005. Effect of targeted disruption of signal transducer and activator of transcription (Stat)4 and Stat6 genes on the autoimmune diabetes development induced by multiple low doses of streptozotocin. Clin Immunol. 114:299–306.
- Chailurkit L, Aekplakorn W, Ongphiphadhanakul B. 2014. The relationship between circulating estradiol and thyroid autoimmunity in males. Eur J Endocrinol. 170:63–67.
- Dabelea D, Mayer-Davis E, Saydah S, Imperatore G, Linder B, Divers J, Bell R, Badaru A, Talton J, Crume T, et al. 2014. Prevalence of Type 1 and Type 2 diabetes among children and adolescents from 2001 to 2009. JAMA 311:1778–1786.
- Delclos K, Camacho L, Lewis S, Vanlandingham M, Latendresse J, Olson G, Davis J, Patton R, Gamboa da Costa G, Woodling K, et al. 2014. Toxicity evaluation of bisphenol A administered by gavage to Sprague Dawley rats from gestation day 6 through postnatal day 90. Toxicol Sci. 139:174–197.
- Dietert R, DeWitt J, Germolec D, Zelikoff J. 2010. Breaking patterns of environmentally influenced disease for health risk reduction: Immune perspectives. Environ Health Perspect. 118:1091–1099.
- [EFSA] European Food Safety Authority. 2006. Opinion of scientific panel on food additives, flavorings, processing aids and materials in contact with food; on request from commission related to 2,2-bis(4-hydroxyphenyl)propane (bisphenol A). EFSA J. 428:13–75.
- EFSA. 2015. Scientific opinion on bisphenol A (2015); [accessed 2017 Mar 8]. http://www.efsa.europa.eu/sites/default/files/corporate_publications/files/factsheetbpa150121.pdf.
- [FDA] Food and Drug Administration. 2008. Draft assessment of bisphenol A for use in food contact applications. Silver Spring (MD): US Food and Drug Administration.
- Goto M, Takano-Ishikawa Y, Ono H, Yoshida M, Yamaki K, Shinmoto H. 2007. Orally-administered bisphenol A disturbed antigen-specific immune responses in naïve condition. Biosci Biotechnol Biochem. 7:2136–2143.
- Heindel J, Newbold R, Bucher J, Camacho L, Delclos K, Sherry M, Vanlandingham M, Mona I. 2015. NIEHS/FDA CLARITY-BPA research program update. Reprod Toxicol. 58:33–44.
- Karpuzoglu-Sahin E, Hissong B, Ansar Ahmed S. 2001. IFNγ levels are upregulated by 17-β-estradiol and diethylstilbestrol. J Reprod Immunol. 52:113–127.
- Kharrazian D. 2014. The potential roles of bisphenol A (BPA) pathogenesis in autoimmunity. Autoimmune Dis. 2014:743616.
- Knip M, Simell O. 2012. Environmental triggers of Type 1 diabetes. Cold Spring Harb Perspect Med. 2:a007690.
- Kuiper J, Moran M, Cetkovic-Cvrlje M. 2016. Exposure to polychlorinated biphenyl-153 decreases incidence of autoimmune Type 1 diabetes in non-obese diabetic mice. J Immunotoxicol. 13:850–860.
- LaKind J, Goodman M, Naiman D. 2012. Use of NHANES data to link chemical exposures to chronic diseases: A cautionary tale. PLoS One. 7:e51086.
- Lee G, Goosens K. 2015. Sampling blood from the lateral tail vein of rat. J Vis Exp. 99:e52766.
- Lee M, Chung S, Kang B, Park J, Lee C, Hwang S, Kim T. 2003. Enhanced interleukin-4 production in CD4+ T-cells and elevated immunoglobulin E levels in antigen-primed mice by bisphenol A and nonylphenol, endocrine disruptors: Involvement of nuclear factor-AT and Ca2+. Immunology. 109:76–86.
- Like A, Rossini A. 1976. Streptozotocin-induced pancreatic insulitis: New model of diabetes mellitus. Science. 193:415.
- Lin Y, Sun X, Qiu L, Huang Q, Fang C, Ye T, Wei J. 2013. Exposure to bisphenol A induces dysfunction of insulin secretion and apoptosis through the damage of mitochondria in rat insulinoma (INS-1) cells. Cell Death Dis. 4:e460.
- Melzer D, Rice N, Lewis C, Henley W, Galloway T. 2010. Association of urinary bisphenol A concentration with heart disease: Evidence from NHANES 2003/06. PLoS One. 5:e8673.
- Muller A, Schott-Ohly P, Dohle C, Gleichmann H. 2002. Differential regulation of TH1-type and TH2-type cytokine profiles in pancreatic islets of C57BL/6 and BALB/c mice by multiple low doses of streptozotocin. Immunobiology. 205:35–50.
- Sakowicz-Burkiewicz M, Kocbuch K, Grden M, Szutowicz A, Pawelczyk T. 2006. Diabetes-induced decrease of adenosine kinase expression impairs the proliferation potential of diabetic rat T-lymphocytes. Immunology. 118:402–412.
- Shelby M. 2008. NTP-CERHR monograph on the potential human reproductive and developmental effects of bisphenol A. NTP CERHR MON. 22:1–64.
- Shoda L, Young D, Ramanujan S, Whiting C, Atkinson M, Bluestone J, Eisenbarth G, Mathis D, Rossini A, Campbell S, et al. 2005. A comprehensive review of interventions in the NOD mouse and implications for translation. Immunity. 23:115–126.
- Sia C. 2005. Imbalance in TH cell polarization and its relevance in Type 1 diabetes mellitus. Rev Diabet Stud. 2:182–186.
- Silver M, ONeill. M, Sowers M, Park S. 2011. Urinary bisphenol A and Type-2 diabetes in U.S. adults: Data from NHANES 2003-2008. PLoS One. 6:e26868.
- Sowlat M, Lotfi S, Yunesian M, Ahmadkhaniha R, Rastkari N. 2016. The association between bisphenol A exposure and Type-2 diabetes: A world systematic review. Environ Sci Pollut Res Int. 23:21125–21140.
- Spanier A, Kahn R, Kunselman A, Hornung R, Xu Y, Calafat A, Lanphear B. 2012. Pre-natal exposure to bisphenol A and child wheeze from birth to 3-years-of-age. Environ Health Perspect. 120:916–920.
- Taylor K, Novak R, Anderson H, Birnbaum L, Blystone C, DeVito M, Jacobs D, Kohrle J, Lee D, Rylander L, et al. 2013. Evaluation of the association between persistent organic pollutants (POPs) and diabetes in epidemiological studies: A national toxicology program workshop review. Environ Health Perspect. 121:774–783.
- Teppala S, Madhavan S, Shankar A. 2012. Bisphenol A and metabolic syndrome: Results from NHANES. Int J Endocrinol. 2012:598180.
- ter Veld M, Zawadzka E, van den Berg J, van den Saag P, Rietjens I, Murk A. 2008. Food-associated estrogenic compounds induce estrogen receptor-mediated luciferase gene expression in transgenic male mice. Chem Biol Interact. 174:126–133.
- [WHO] World Health Organization. 2010. Joint FAO/WHO expert meeting to review toxicological and health aspects of bisphenol A: Summary report. Ottawa, CA: World Health Organization [accessed 2017 Mar 8]. http://www.who.int/foodsafety/chem/chemicals/BPASummary2010.pdf.
- Wildner G, Kaufmann U. 2013. What causes relapses of autoimmune diseases? The etiological role of autoreactive T-cells. Autoimmun Rev. 12:1070–1075.
- Willhite C, Ball G, McLellan C. 2008. Derivation of a bisphenol A oral reference dose (RfD) and drinking-water equivalent concentration. J Toxicol Environ Health. 11:69–146.
- Yan H, Takamoto M. Sugane 2008. Exposure to bisphenol A prenatally or in adulthood promotes Th2 cytokine production associated with reduction of CD4CD25 regulatory T cells. Environ Health Perspect. 116:514–519.
- Yoshino S, Yamaki K, Li X, Sai T, Yanagisawa R, Takano H, Taneda S, Hayashi H, Mori Y. 2004. Prenatal exposure to bisphenol A up-regulates immune responses, including T-helper 1 and T-helper 2 responses, in mice. Immunology. 112:489–495.
- Yoshino S, Yamaki K, Yanagisawa R, Takano H, Hayashi H, Mori Y. 2003. Effects of bisphenol A on antigen-specific antibody production, proliferative responses of lymphoid cells, and TH1 and TH2 immune responses in mice. Br J Pharmacol. 138:1271–1276.
- Youn J, Park H, Lee J, Jung I, Choi K, Kim K, Cho K. 2002. Evaluation of the immune response following exposure of mice to bisphenol A: Induction of Th1 cytokine and prolactin by BPA exposure in the mouse spleen cells. Arch Pharm Res. 25:946–953.