
Abstract
With the rapid development of synthetic alternatives to mineral fibers, their possible effects on the environment and human health have become recognized as important issues worldwide. This study investigated effects of four fibrous materials, i.e. nanofibrillar/nanocrystalline celluloses (NCF and CNC), single-walled carbon nanotubes (CNTs), and crocidolite asbestos (ASB), on pulmonary inflammation and immune responses found in the lungs, as well as the effects on spleen and peripheral blood immune cell subsets. BALB/c mice were given NCF, CNC, CNT, and ASB on Day 1 by oropharyngeal aspiration. At 14 days post-exposure, the animals were evaluated. Total cell number, mononuclear phagocytes, polymorphonuclear leukocytes, lymphocytes, and LDH levels were significantly increased in ASB and CNT-exposed mice. Expression of cytokines and chemokines in bronchoalveolar lavage (BAL) was quite different in mice exposed to four particle types, as well as expression of antigen presentation-related surface proteins on BAL cells. The results revealed that pulmonary exposure to fibrous materials led to discrete local immune cell polarization patterns with a TH2-like response caused by ASB and TH1-like immune reaction to NCF, while CNT and CNC caused non-classical or non-uniform responses. These alterations in immune response following pulmonary exposure should be taken into account when testing the applicability of new nanosized materials with fibrous morphology.
Introduction
A variety of new synthetic organic and inorganic filamentous materials have been developed in recent years with the intention to replace some of the existing industrially used mineral fibers, including asbestos (ASB). A long and tragic history of sustained and sometimes uncontrolled exposure to ASB and other mineral fibers in occupational and natural settings has evidently proved that fibrous airborne materials may cause pulmonary inflammation, fibrosis, and cancer, having a significant impact on both individuals and the whole communities. Structure–activity relationship paradigm for long and thin particles has come from verified studies with aspect ratio being a major indicator of the pathogenicity (Stanton et al. Citation1981; Bonneau et al. Citation1986; Foa and Basilico Citation1999; Lippmann Citation2014). However, there are additional concerns regarding the potential toxicity based on the fiber origin, chemistry, structure, biopersistence, and other characteristics that render the particle hazardous.
Fibrous nanocellulose has a great potential for applications in different fields due to its unique properties such as mechanical strength, plasticity, viscosity, and film-forming features. For example, nanocellulose is used to enhance the fiber–fiber bond strength in paper and paper-board manufacturing and as a composite for reinforcing plastics. At present, three types of nanocellulose – cellulose nanocrystals (CNCs), cellulose nanofibrills (NCF), and bacterial nano-cellulose – are produced, with NCF considered to be more suitable for biomedicine application because of its low rigidity and amorphous cellulose structure.
Although knowledge of potential health effects of nanocellulose is limited, serious concerns exist regarding the health implication of nanoparticles in general (Xia et al. Citation2009). In murine lungs, CNC elicited oxidative stress, cell damage, and a pronounced inflammatory response in a dose-dependent manner (Yanamala et al. Citation2014). When comparing two different isoforms in vitro, NCF has been shown to be more toxic to human lung epithelial cells than CNC, but the inflammatory response by itself was stronger in CNC-treated cells compared to NCF-treated cells (Menas et al. Citation2017). Still, owing to the “eco-friendliness”, biocompatibility, and biodegradability, the use of natural fibers, i.e. cellulose-based, is being encouraged, despite the evidence of increased biopersistence and low clearance of nanocellulose in vivo (Tatrai et al. Citation1995; Cullen et al. Citation2002).
Bioaccumulation of fibrous materials in the lungs can not only elicit inflammatory and immune responses, but also directly or indirectly affect the structure or function of the immune system. It has been shown that pulmonary exposure to all types of ASB, including chrysotile, crocidolite, amosite, and tremolite, causes adverse health effects associated with immunosuppression, such as lung cancer and mesothelioma (Muhle and Pott Citation2000). Similarly, carbon nanotubes (CNTs), another type of high aspect-ratio fiber, have been shown to alter the immune microenvironment in the lungs (Dumortier Citation2013; Park et al. Citation2016) and are considered as a potential tumor promoter upon pulmonary exposure (Sargent et al. Citation2009, Citation2014; Shvedova et al. Citation2013).
The study reported here examined immunological responses upon pulmonary exposure to several fibrous materials – crocidolite ASB, cellulose nanoparticles with crystalline and fibrillary morphologies, and single-walled CNTs, with an emphasis on local and systemic immunotoxicity in the acute response phase.
Materials and methods
Particle preparation and characterization
Four different particles were prepared as previously described (Shvedova et al. Citation2013, Citation2014; Menas et al. Citation2017). In brief, acid-treated single-walled CNTs (Unidym Inc., Houston, TX), UICC standard crocidolite ASB, CNC, and NCF (USDA Forest Products Laboratory, Madison, WI) received as solid samples were suspended in deionized water and sterilized by autoclaving. Suspended particles were dispersed by brief sonication (30 s) with a probe sonicator (Vibra Cell Sonics, 130 W, 20 kHz, 65% amplitude). Atomic force microscopy (AFM) analysis of CNC and NCF was conducted in tapping mode using a multimode scanning probe microscope (Veeco Instruments Inc., Waltham, MA). An ACL probe (AppNano, Mountain View, CA) was utilized at a frequency between 160–225 kHz, 1.5–1.8 V amplitude set point, and 100–300 mV drive amplitude. The images were processed using Gwyddion (Brno, Czech Republic). CNT and ASB were deposited on polycarbonate filters and viewed under a field emission scanning electron microscope (SEM) (model S-4800; Hitachi, Tokyo, Japan). Endotoxin levels in all samples were below the detection limit (0.01 EU/ml) as assessed by a Limulus amebocyte lysate (LAL) chromogenic endpoint assay kit (Hycult Biotech, Inc., Plymouth Meeting, PA).
Animals
Specific pathogen-free BALB/c mice (female, 7–8-week-old) were obtained from Jackson Laboratories (Bar Harbor, ME) and weighing 20.0 ± 1.8 g on exposure day. All animals were housed in individual cages, receiving HEPA-filtered air, and supplied with nutritionally adequate pelleted irradiated NIH-31 modified 6% mouse food (Envigo RMS, Inc., Indianapolis, IN) and water ad libitum. Animals were acclimated in the animal facility for at least 1 week. All experimental procedures were conducted in accordance with the Guide for the Care and Use of Laboratory Animals and approved by the National Institute for Occupational Safety and Health (NIOSH) Institutional Animal Care and Use Committee.
Particle administration
Mice were randomly allocated into seven groups (n = 6/group), and then either particles or Ca2+, Mg2+-free phosphate-buffered saline (PBS, pH 7.4) was administered by pharyngeal aspiration. A dose of 40 µg/mouse was chosen for CNT and ASB, since it has been shown to produce significant interstitial fibrosis without overwhelming the lung clearance mechanism upon pulmonary administration in mice (Mercer et al. Citation2008; Shvedova et al. Citation2008; Rydman et al. Citation2015). While bolus pharyngeal aspiration may not be fully adequate to represent inhalation exposure in human, this technique is well accepted in toxicology research allowing to assess broad range of the outcomes of pulmonary exposures. In addition, compared to intratracheal administration, pharyngeal aspiration is less invasive technique, providing better distribution and deposition of the particles in the lung including the low respiratory tract compartments that corresponds well to the results reported in inhalation studies (Rao et al. Citation2003; Shvedova et al. Citation2008; Castranova et al. Citation2013). The 40 µg CNT dose currently employed in this study was found to be occupationally-relevant through an extrapolation of in vivo rodent assessments to corresponding human equivalent exposures (Erdely et al. Citation2013; NIOSH Citation2013; Siegrist et al. Citation2014). Two doses, 40 and 80 µg per mouse, were used for CNC and NCF to range-find the response due to the current lack of reliable information on toxic effects and insufficient nanocellulose inhalation exposure assessment data. In brief, after anesthesia with a mixture of ketamine and xylazine (Phoenix, St. Joseph, MO) (41.65 and 1.65 mg/kg subcutaneously in the abdominal area), the mouse was placed on a board in a near-vertical position and the animal’s tongue was extended with lined forceps. For each mouse, a 50-μl suspension was placed posterior in the throat and the tongue was held until the suspension was aspirated into the lungs.
At 14 days post-exposure, mice were euthanized via intraperitoneal injection of sodium phenobarbital (>100 mg/kg), weighed, and exsanguinated. This timepoint was chosen due to previously-reported decreases in acute nonspecific responses to crocidolite, nanocellulose, and CNT introduced into the lungs, the appearance of particular patterns of reactions, i.e. fibrosis, sensitization, and chronic inflammation (Shvedova et al. Citation2008; Yanamala et al. Citation2014; Rydman et al. Citation2015), and to identify the early adaptive immune response. At necropsy, mice had their blood (through posterior vena cava) recovered into EDTA-treated tubes for evaluation of hematologic parameters, their lungs lavaged, and their spleen isolated for analyses in the various assays outlined below.
Hematological analysis
Levels of white blood cells (WBCs), neutrophils (NEUTs), lymphocytes (LMPHs), monocytes (MONOs), eosinophils (EOs), basophils (BASOs), and red blood corpuscles (RBCs), as well as of red blood cell distribution (RDW), hemoglobin (HGB), hematocrit (HCT), mean corpuscular volume (MCV), blood platelets (PLT), platelet distribution width (PDW), mean platelet volume (MPV), platelet larger cell ratio (P-LCR), mean corpuscular hemoglobin (MCH), and reticulocyte (RET) counts were determined in peripheral EDTA-treated blood using a ProCyte-Dx Hematology Analyzer (IDEXX Laboratories, Westbrook, ME).
Bronchoalveolar lavage
The trachea was cannulated with a blunt 22-G needle and bronchoalveolar lavage (BAL) was done using cold sterile Ca2+, Mg2+-free PBS at a volume of 0.7 ml for first lavage (kept separate) and 0.8 ml for each subsequent lavage. A total of ≈5 ml pooled lavage fluid (BALF)/mouse was collected into a sterile centrifuge tube. Cell pellets from the first and subsequent lavages were combined and pooled BAL cells were washed in Ca2+, Mg2+-free PBS by alternate centrifugation (300×g, 10 min, 4 °C) and resuspension. Cell-free first fraction BALF aliquots were frozen until further processed.
Total protein and LDH measurements
Total protein levels in acellular first BALF samples were measured using a modified Bradford assay (BioRad, Hercules, CA). After protein dye reagent was added and the solution incubated at room temperature for 5 min, sample absorbance (595 nm) was evaluated in a Synergy H1 hybrid multimode microplate reader (BioTek Instruments, Winooski, VT). Total protein present was calculated by extrapolation from a standard curve generated with bovine serum albumin standard. Levels of LDH (marker of damage) were also measured using a commercially available kit (Pointe Scientific, Lincoln Park, MI) by monitoring the reduction of NAD+ in the presence of lactate at 340 nm in a spectrophotometer/plate readers.
BAL cell counting and differentials
The degree of inflammatory response induced by the particles was estimated from total cell counts, and specifically those for mononuclear phagocytes (MNPs), polymorphonuclear leukocytes (PMNs), and LMPHs recruited into the mouse airways. Counts were performed with an electronic cell counter equipped with a cell sizing attachment (Coulter model Multisizer 3; Coulter Electronics, Hialeah, FL). MNP, PMN, and LMPHs were identified by characteristic cell/nuclei shapes in stained cytospin preparations (Hema-3, Fisher Scientific, Pittsburgh, PA), and differential counts were performed. A minimum of 300 cells/slide was counted.
Cytokine/chemokine measurement
Levels of 23 different cytokines and chemokines in each BALF sample were assessed using Bio-Plex Pro Mouse Cytokine 23-plex Assay (Bio-Rad, Hercules, CA). An aliquot (50 μl) of BAL cell-free first fraction/mouse was used for these analyses. Bio-Plex Manager 6.1 software (Bio-Rad, Tokyo, Japan) was employed to determine the concentration of each analyte based on representative standard curves. Four replicates of each sample were used. Data are presented as means (pg/ml)±SEM. The limit of detection for each cytokine was in a 0.5–14.6 pg/ml range.
Cluster analysis of cytokine data
Hierarchical cluster analysis (HCA) was performed on BALF cytokines data from mice exposed to two forms (fibrous and crystalline) of nanocellulose materials, e.g. NCF and CNC, and to two inorganic fibrous materials, ASB and SWCNT. The measured cytokine concentrations were first converted to fold change compared to their levels in control samples and were then log2-transformed. Some of cytokine measurements were below detection limits. Cytokines having measurement values below detection limits were removed from final analyses. Hierarchical agglomerative (bottom up) clustering analysis using R was applied to group control and the samples corresponding to 40 µg/mouse concentration of CNC/NCF/CNT or ASB particle exposures based on their cytokine expression profiles in BALF induced at 14-day post exposure. A detailed cluster analysis of samples exposed to CNC, NCF, CNT, and ASB, after removing missing cytokine measurements, was performed using “Euclidean” distance similarity between the different samples and by employing ward.D2 linkage distance between the members of the clusters. By combining cytokine and sample clustering, heat maps were created with colors corresponding to the relative abundance levels of the cytokines. The heat-map and clusters of similar cytokines profiles and samples corresponding to various nanoparticles studied were produced with package pheatmap built for R statistical package version 3.1.3 (Vienna, Austria).
Obtaining splenocyte single cell suspensions
At necropsy, spleens from exposed or non-exposed mice were aseptically harvested into 5 ml sterile PBS in a culture dish. Each spleen was ground with a slide and the resulting suspension filtered through a cell strainer. Isolated splenocytes were centrifuged at 300×g for 10 min (4 °C). Any red blood cells present were lysed with buffer (155 mM NH4Cl in 10 mM Tris–HCl buffer [pH 7.5]), after incubating for 3 min at 25 °C. After lysis, remaining splenocytes were washed and the pellets re-suspended in 3 ml FACS buffer (Rockland Immunochemicals Inc., Limerick, PA) for further analysis.
BAL cell and splenocyte phenotyping
As with the splenocytes, isolated BAL cells from all experimental groups were re-suspended in FACS buffer. An Fc-block antibody was added to each tube to reduce nonspecific binding and then individual aliquots of cells were labeled with antibodies directly conjugated with fluorescein isothiocyanate (FITC), allophycocyanin (APC), or phycoerythrin (PE) for 30 min at 4 °C according to manufacturer instructions. The antibodies used were directed against CD80 (B7-1), MHC Class II (I-A/I-E), CD3e (for T-cells), CD19 (for B-cells), DX5 (for NK-cells), CD4-PE, CD8a-FITC, CD40-APC (all eBioscience, San Diego, CA), CD11b-PE and CD11c-APC (BD Bioscience, San Jose, CA), or CD86-APC (B7-2, BioLegend, Inc., San Diego, CA). After labeling, cells were washed twice with FACS buffer and then analyzed in an Amnis Flow-Sight (EMD Millipore Corporation, Billerica, MA) imaging flow cytometer and accompanying IDEAS 6.2 software. A minimum of 5000 events/sample was acquired.
Statistical analysis
Treatment-related differences in various outcomes were evaluated using a two-way analysis of variance (ANOVA), followed by a pair-wise comparison using the Student–Newman–Keuls test. Results are presented as means ± SEM. p Values <0.05 were accepted as significant (Statistical package SigmaPlot 12.5, Systat Software Inc., San Jose, CA).
Results
Particle characterization
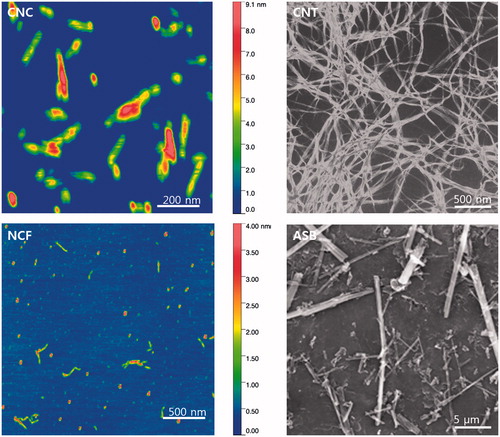
The AFM-based lengths of CNC and NCF particles were 158 [±97] and 142 [±14] nm and widths were 37 [±7] nm and 56 [±14] nm, respectively. SEM images showed that CNT formed agglomerates with 1–3 µm length and ∼65 nm width while the crocidolite ASB fibers had a mean length of 7.7 [±1.4] µm and width of 0.4 [±0.1] µm ().
Figure 1. Representative atomic force microscopy images of crystalline nanocellulose (CNC) and fibrillary nanocellulose (NCF). Scanning electron micrographs of single-walled carbon nanotubes (CNT) and crocidolite asbestos (ASB).
Effects on BAL cell number
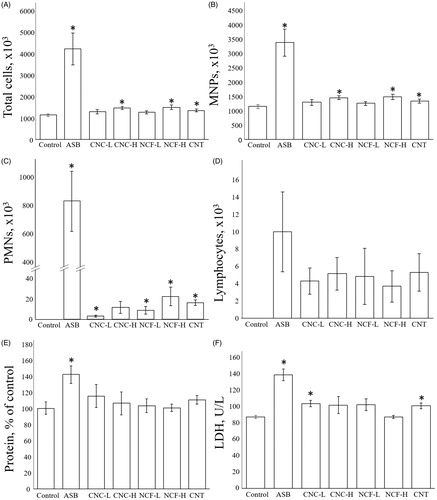
Microscopic evaluation of BAL slides revealed all four administered fiber types remained in the lungs at 14 days after pharyngeal aspiration. Only ASB could not be completely engulfed by phagocytes, unlike the other three particle types (). At 14 days after aspiration, total cell number and the numbers of MNPs were significantly increased due to the ASB and CNT exposures, as well as in higher dose of CNC and NCF-treated groups, compared to controls. The increase was highest in ASB-treated mice, i.e. up to four-fold (). Both PMN and LMPHs were almost non-detectable in the BALF of control mice, whereas they were clearly present in all treated mice, especially in the ASB-exposed hosts (). No significant increase in the number of EOs related to exposure was observed, except in ASB-treated mice (data not shown).
Figure 2. Representative images of the BAL fluid cells from mice at Day 14 post-exposure to ASB, NCF, or CNT. All stained with hematoxylin–eosin. Arrows point to the respective particles visible inside the cells. CNC are not seen under the conventional light microscopy.
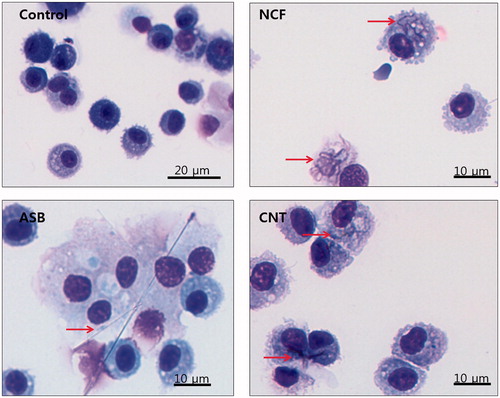
Figure 3. Pulmonary damage at Day 14 post-exposure to CNC, NCF, CNT, and ASB. Numbers of (A) total cells, (B) mononuclear phagocytes (MNP), (C) polymorphonuclear leukocytes (PMN), and (D) lymphocytes. (E) Total protein content in BALF of mice exposed to ASB, CNC, NCF, or CNT (as % of control level). (F) BALF LDH activity for mice exposed to ASB, CNC, NCF, or CNT (as U/l). *p < 0.05 vs. control.
Effects on total protein and LDH activity in BALF
The amount of total protein in BALF was significantly increased only in ASB-treated mice (1.4-fold vs. control, p < 0.05; ). LDH activity was significantly enhanced in mice treated with ASB, i.e. 140 U/l (p < 0.05 vs. control) or with the lower dose of CNC and CNT: i.e. 102 and 98 U/l, respectively (p < 0.05 vs. control) ().
Effects on BALF cytokine/chemokine levels
Concentrations of different cytokines and chemokines in BAL fluids of mice exposed to CNC, NCF, CNT, and ASB are shown in Supplementary Table 1. Asbestos-exposed mice had the most marked changes compared to control, and the lower doses of both nanocellulose materials caused less pronounced effects than the higher doses. There were no significant changes in the levels of eotaxin, interferon (IFN)-γ, or tumor necrosis factor (TNF)-α in all groups. Levels of interleukin (IL)-12p40 were significantly increased in all treated groups compared to controls, with ASB and NCF-H having the highest levels. IL-12p70 levels were decreased in the BALF of the ASB and CNT group but elevated in that from the NCF-H hosts (each p < 0.05 vs. control). BALF IL-9 levels were decreased in the ASB and CNT groups (both p < 0.05 vs. control). CNT exposure led to a significant decrease in BALF IL-13 levels and ASB caused a decrease in BALF IL-3 – as well as an increase in IL-4, IL-5, and IL-6 – levels (each p < 0.05 vs. control). G-CSF levels were preferentially increased in BALF from ASB and CNC-H mice, whereas GM-CSF was decreased in the BALF from ASB and CNT mice, but elevated in that from NCF-H hosts (each p < 0.05 vs. control). BALF IL-1α levels were increased with the higher doses of CNC and NCF. Both IL-1β and MCP-1 levels were significantly higher in BALF from ASB and NCF-treated mice compared to the levels in all other groups. BALF KC and MIP-1α levels were elevated in all groups except the low-dose CNC mice (p < 0.05 vs. control). BALF MIP-1β levels were increased in the ASB and NCF-H mice (each p < 0.05 vs. control), while levels of IL-10 and RANTES were increased in the higher NCF doses compared to all other groups (p < 0.05 vs. control). Lastly, BALF IL-17a levels were significantly decreased in the ASB group (p < 0.05 vs. control).
Hierarchical cluster analysis of cytokine responses
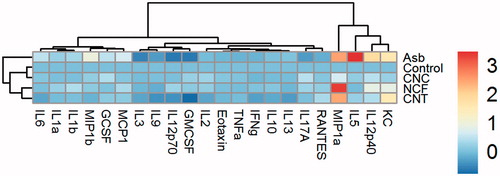
HCA was applied to the BALF cytokine data (Supplementary Table 1) to highlight similarities/differences in inflammatory responses in mice due to the various nanomaterial exposures. Dendrograms at Day 14 post-aspiration of 40 µg/mouse of CNC, NCF, CNT, or ASB are shown (). The dendrogram on top indicates the Euclidean distance of the ASB-exposed sample (a positive fibrous control) from any of the clusters/treatments at Day 14 was quite large, clearly suggesting the cytokine responses after exposure CNC, NCF, and CNT differed from that induced by ASB. Further, all other treatments in the dendrogram formed two major clusters separating CNC from NCF and CNT particles. While both NCF and CNT formed a single cluster, CNC grouped with control or unexposed sample.
Figure 4. Hierarchical cluster analysis of cytokine profiles in the BAL fluid of mice at Day 14 post-exposure to CNC, NCF, CNT, or ASB materials. Samples corresponding to different treatments at 40 µg/mouse concentration and several cytokines measured in BALF were reordered based on (dis-)similarities according to dendrogram on the top and left, respectively. Each branch in dendrogram shows similarity between samples, i.e. shorter the branch, the more similar. The heat-map colors represent log2-transformed fold-change values for cytokines relative to minimum/maximum of all values. A key showing the range of values at each post exposure timepoint is also shown in the figure.
Effects on BAL cell and splenocyte phenotypes
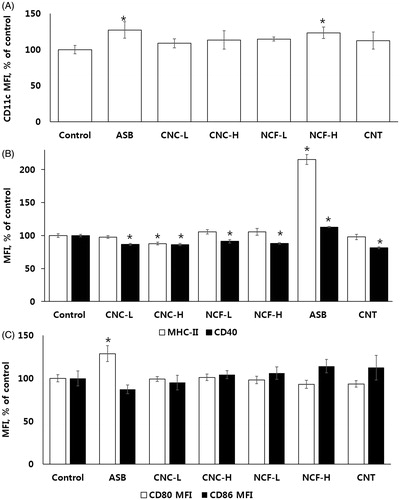
PMN and MNP populations were distinguished by area/SSC parameters (Supplementary Figure 1). CD11b, CD11c, MHC-II, CD40, CD80, and CD86 expression on BAL cell surfaces as a percentage of the cell population, expressing the marker of interest and/or mean fluorescence intensity (MFI) are presented in and . Gating strategy, along with representative over-laid histograms, are found in Supplementary Figures 3–5. All treated mice displayed alterations in immune cell composition at Day 14 post-exposure; the most drastically changed profile was due to ASB. In ASB, NCF and CNT-treated mice CD11bpos/CD11cneg MNP population significantly increased while CD11bpos/CD11cpos and the number of CD11bneg/CD11cpos-expressing cells decreased. CD11c expression (MFI) was increased in ASB and NCF-H groups. MHC-IIhi/CD40pos cells in BAL increased significantly after exposure to NCF-H and ASB. MHC-II and CD40 MFI increased in ASB group while in all other groups CD40 MFI actually decreased compared to control (each p < 0.05). CD80pos/CD86pos cell populations were elevated in CNC-H, NCF, and ASB-treated mice and CD80 MFI was significantly increased in the ASB group (p < 0.05).
Figure 5. Patterns of expression of select surface markers on BAL cells. (A) Cell populations showing CD11b and CD11c expression in MNP as percentage of the total cells. Arrows point at representative images of cells belonging to the respective populations to demonstrate expression and localization of above-mentioned markers. (B) % BAL MNP expressing MHC-IIHi/CD40Pos. To the right are representative images of MHC-IIHi/CD40Pos cells to demonstrate expression and localization of the markers. (C) Cell populations showing CD80 and CD86 expression in BAL MNP as percentage of total cells. Arrows point at representative images of cells belonging to respective populations to demonstrate expression/localization of the surface markers. In all cases, a minimum of 5000 cells/sample were counted. Arrows point at the representative images of the cells belonging to the respective populations to demonstrate the expression and localization of the abovementioned surface markers.
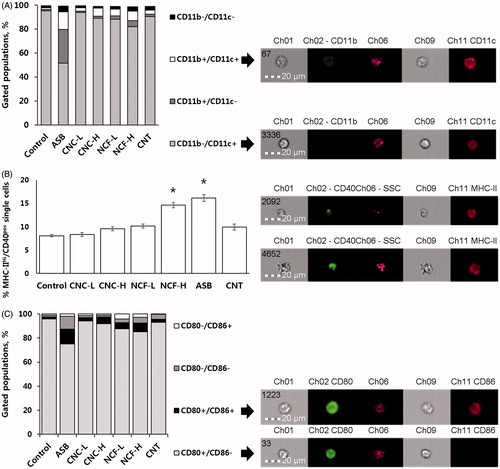
Figure 6. Median fluorescence intensity (MFI) of the selected surface markers on BAL MNP cells. (A) CD11c. (B) MHC-II and CD40. (C) CD80 and CD86. *p < 0.05 vs. control.
MHC-II, CD40, CD80, and CD86 (for antigen-presenting cells (APCs)), CD4, CD8, CD3e (for T-cells), CD19 (for B-cells), and DX5 (for NK-cells) expression on splenic cells as a percentage of the cell population, expressing the marker of interest and/or MFI are presented in Supplementary Figures 5 and 6. Compared to controls, the composition of T-cells in the spleen shifted toward CD8 T-cells in the ASB and CNT-treated mice (Supplementary Figure 7). A portion of the T-cells itself tended to decrease in the spleens of CNT- and NCF-H-treated mice.
Hematological analysis
Among all the treatment groups, compared with control mice only ASB exposure led to a significant rise in the percentages of EOs in the blood. In other particle-treated groups, except for CNT, this was significantly decreased (Supplementary Table 2). There were no statistically significant differences in the other parameters across all groups.
Discussion
There is steady progress in the development of new fibrous materials and innovative uses for older ones. Flexibility, tensile strength, controllable structure, conductivity, and chemical and/or physical resilience are always of great interest for a plethora of applications. Mechanical, electrical, and other properties of non-fibrous materials might be enhanced with the use of different natural and artificial filaments. Despite the explicit evidence for toxicity, ASB is still mined in Russia (55%), China (20%), Brazil (15.6%), and Kazakhstan (10.8%) and products containing ASB are still being traded on a world scale (U.S. Geological Survey Citation2017). The development of safer materials that can replace ASB has been continuously studied and natural fiber applications, such as fibrous nanocellulose, are becoming widely promoted (Mondal Citation2017).
Fiber toxicity is driven by high aspect ratio with high strength and long retention times, and there is always concern for the induction of ASB-like pathogenicity for each emerging material or application. In the case of nanoscale fibers, additional variables are added that might complicate the established pathogenicity mechanisms due to uncertain biological fate and biocompatibility (Allegri et al. Citation2016; Lopes et al. Citation2017). The goal of the current study was to determine whether fibrillary nanocellulose, despite having the same chemical composition as the crystalline form, elicits different local and systemic subacute immune responses upon pulmonary exposure in a mouse model of bolus pharyngeal aspiration, and second, if the response would be closer to the one produced by micro-sized crocidolite fibers or CNTs.
The present study assessed inflammatory responses in murine lungs 14 days after exposure to a test particle. Inflammation is accompanied by recruitment of immune cells into the damaged sites as a protective response induced normally in the host for the elimination of foreign bodies and necrotic cells and tissue repair, and phagocytes stimulate surrounding immune cells by secreting chemokines at early stage after entering of foreign bodies. Typically, the peak inflammatory response to aspirated fibrous particulates, including CNT and nanocellulose, is observed on Days 1–7 while decreasing after the first week post-exposure (Mercer et al. Citation2008; Shvedova et al. Citation2008; Yanamala et al. Citation2014). Indeed, by Day 14, LDH and total protein levels were significantly elevated only in ASB-treated mice. Total MNP and PMN cell numbers were still significantly increased in ASB (more than three-fold), high dose CNC, high dose NCF, and CNT – treated groups compared to controls. Microscopic analysis of the BAL cells revealed that NCF and CNT were taken up by alveolar macrophages, whereas ASB seemed to penetrate through phagocytes’ membranes accompanied by the extension of the cytoplasm, as seen in BAL microscopy and Amnis FlowSight pictures (Supplemental Figure 8). Elevated EO levels have been shown to accompany ASB-related pathology in humans (Kalomenidis and Light Citation2004; Ilavska et al. Citation2005) and mice (Rydman et al. Citation2015), which was also observed in the present study, as ASB had higher EO counts in BAL and blood. Inflammatory cytokine levels were disparate among various groups, with IL-1β concentration higher in ASB and NCF hosts, while IL-6 was only increased in ASB-treated mice, together with elevated IL-4 and IL-5, suggesting a lingering stimulation of inflammation. Chemoattractant (e.g. KC, MCP-1, MIP-1α/β) levels were increased (relative to untreated mice) in all treated groups except for the CNC-L, and were generally in line with the results of differential cell counts.
The current study also characterized cell populations in BAL after host exposure to the test substances. Antigen-presenting cells are key in adaptive immunity as they express surface markers that are accessory molecules to provide information on antigens to T-cells. Here, CD11b/CD11c, CD80/CD86, and MHC-II/CD40 expressions were selected to distinguish among cell subtypes and to permit assessment of APC pool maturation status and activity. Alveolar macrophages were the most plentiful APC present in the BAL, with a CD11bneg/CD11cpos and CD80pos/CD86neg profile that has been previously shown to be a unique phenotypic feature in mice, dogs, and humans (Guth et al. Citation2009). A minor portion had a CD11bpos/CD11cpos and/or CD80pos/CD86pos phenotype, indicative of parenchymal dendritic cells (DCs) that sometimes are recruited to the alveolar space. Only about 8% of all BAL cells had an MHC-IIhi/CD40pos profile that reflects rather low antigen-presenting activity of resident immune cells (Holt et al. Citation2008).
All treated mice displayed alterations in immune cell composition at Day 14 post-exposure; the profile changed most drastically was due to ASB. This was also significantly altered in NCF and CNT-treated mice with significant increases in CD11bpos/CD11cneg and CD11bpos/CD11cpos MNP populations and the number of CD11bneg/CD11cpos-expressing cells decreasing. Simultaneously, CD11c expression (MFI) was increased in ASB and NCF-H groups. These changes could be explained by an influx of CD11bpos PMN, MONOs, and immature macrophages to the airway lumen and alveolar space. Since CD11bpos/CD11cpos do not usually circulate in blood, one can assume either increases in alveolar macrophage expression of CD11b or migration of some DC subset into the airway, or acquiring of CD11c by MONOs precursors migrating from the bloodstream on the spot (Bilyk and Holt Citation1995; Guth et al. Citation2009). Recently, identification and selective blockade of inflammatory CD11bpos macrophages in the airways have been proposed for the treatment of acute lung exacerbations (Duan et al. Citation2016). Therefore, one might also consider related treatment strategies for human fibrous particulate exposure.
The levels of MHC-IIhi/CD40pos cells in BAL increased significantly only after exposure to NCF-H and ASB, but the number of MHC-II and CD40 surface molecules on cells increased only in ASB mice (up to 200% of control for MHC-II); the latter was also noted for splenocyte MHC-II-expressing populations. In other groups, a negative correlation was observed, i.e. CD40 expression dropped below the control levels and CNC-H also down-regulated the amount of cell surface MHC Class II molecules. Low CD40 expression is associated with diminished ability of APC to be fully activated which can hamper innate immune reactions but also allows for a more tolerogenic microenvironment. CD80 and CD86 have been established as APC maturation markers during an immune response (Wang et al. Citation2013). In DC, CD86 is expressed at early maturation, and CD80 expression rises in mature DC. Significant elevations in CD80pos/CD86pos cells in CNC-H and both NCF and ASB groups, along with the above-noted CD11bpos/CD11cpos expression, reflect boosted antigen-presenting processes. At the same time, taken together with differences in expression of MHC Class II and CD40, this suggests different activation patterns.
Asbestos-treated animals at Day 14 post-exposure displayed inflammatory cellular and humoral responses that are considered characteristic points of a T-helper (TH)-2-type immune polarization state associated with recruitment of EOs, supported by significant increases in IL-4 and IL-5 along with attenuated IL-17A and IL-12p70 release (Glimcher and Murphy Citation2000). In the spleen, B-cell populations were reduced, an outcome that could be explained by a migration triggered by a persistent local pulmonary TH2 stimulation/IL-4 and IL-5 secretion. CD11chi DC is required for both TH1 and TH2 immunity (Kool et al. Citation2012) and IL-4 secretion might promote MHC-II and CD86 expression on macrophages. Furthermore, in the ASB mice, flow cytometry revealed a distinct population of granulocytes expressing low amounts of CD80 co-stimulatory molecules that might influence TH2 cell differentiation (Bellou and Finn Citation2005; Wong et al. Citation2005). This could suggest a possible role for granulocytes as specialized APC in crocidolite ASB exposure settings, as has been described before for PMN and EOs (Akuthota et al. Citation2010; Abi Abdallah et al. Citation2011).
Crystalline nanocellulose has been shown to induce oxidative stress and inflammatory responses in mice 24 h after an exposure (Yanamala et al. Citation2014), but no data exist concerning later timepoints. In the current study, at 14 days after an exposure, BALF cytokines and cellular compositions were dose-dependently altered, but with no indications of specific local or systemic immune cell polarization patterns. Although expression of BAL APC activation markers was increased, as were some chemokines (e.g. KC, MIP-1α) in the high-dose groups, CNC showed low toxicity and the data suggested a gradual time-dependent alleviation of inflammation.
Compared to CNC, the NCF used in this study has been found to be more cytotoxic to human A549 cells (24 or 72 h post exposure) (Menas et al. Citation2017) and in mice (24 h post-exposure) (Yanamala et al. Citation2014). Other studies of different NCF types reported low cytotoxicity but robust inflammatory cytokine/chemokine production in dermal fibroblasts, lung MRC-5 cells, and THP-1 macrophages (Bhattacharya et al. Citation2017; Lopes et al. Citation2017). The present data indicate that by Day 14, NCF-treated mice exhibited an immune microenvironment favoring differentiation of T-cells toward a TH1-phenotype (more obviously seen in high-dose exposure group), as revealed by increased APC activation, maturation, and enhanced secretion of IL-12p70, MCP-1, MIP-1α, and GM-CSF (Colantonio et al. Citation2002; Zhang et al. Citation2014). Increases in IL-10, an important modulator of lung inflammation (Shanley et al. Citation2000), that were also observed most likely represent a response aimed at down-regulation of the pro-inflammatory changes. Both nanocellulose samples did not elicit significant changes in the spleen or blood.
Mice exposed to 40 µg single-walled CNTs displayed signs of non-uniform immune responses, somewhat similar to that observed with ASB, albeit on a smaller scale. BALF LDH levels were increased, along with PMN and macrophage numbers, outcomes that could mean a lingering response to the material. CNT did not cause significant surface marker composition changes, except for downregulation of CD40, despite high biopersistence. This might be related to the impaired immune surveillance by phagocytes and higher parenchyma penetration, shown in previous studies (Mercer et al. Citation2008; Huizar et al. Citation2011).
It is important to note that alveolar macrophages are not thought to suppress T-cell activation and provide little antigen presentation (Lambrecht Citation2006) when compared to pulmonary DC (Stumbles et al. Citation1998). Alveolar macrophages have a long turnover rate in mice (Maus et al. Citation2006), but their depletion – which can happen in ASB exposure, can enhance APC function by lung parenchymal DC and their migration that, in turn, can lead to re-activation of the T-cells (Holt et al. Citation1993; Jakubzick et al. Citation2006). It is assumed antigen presentation-related changes following host exposure to fibrous materials depend on material properties and biopersistence; however, one must also consider impacts on the ability of phagocytes to recognize/process the particle. With ASB, impairment of phagocytic function, a constant recruitment of PMN, and local cellular damage lead to increased secretion of host-derived antigens that drive TH2-like polarization (Pfau et al. Citation2014). Local inflammatory responses can influence systemic immune response (Terashima et al. Citation1997; Mukae et al. Citation2001), but only significant shifts in the CD8/CD4 splenocyte ratios in the spleens of ASB- and CNT-exposed animals were observed here.
Based on their physical and chemical properties, nanoscale particles can cause tissue damage and impairment of intracellular organelles, in part, through induction of inflammatory responses/cytokines (Nel et al. Citation2009). Stefaniak et al. (Citation2014) noted increases in reactive oxygen species (ROS) formation in the presence of CNC and NCF even under cell-free conditions. The current results indicated that at 14 days post-exposure, all treated mice presented with some kind of cellular alterations, with these being dose-dependent in the CNC- and NCF-exposed hosts. Cluster analysis of cytokines in the BALF provided a clear demarcation between CNC and NCF, suggesting a differential pattern of cytokine pathways was inducible between crystalline and fibrous forms of cellulose nanomaterials. Moreover, clustering of NCF with CNT particles, while unequivocally separated from CNC, suggested that cytokine responses to NCF materials could have similarities with those induced by fibrous carbonaceous nanomaterials. Overall, these results – together with the immune cell phenotyping data – indicate functional/morphological (dis)-similarities between fibrous and crystalline cellulose based nano-materials could be determined based on their cellular and cytokine/chemokine responses.
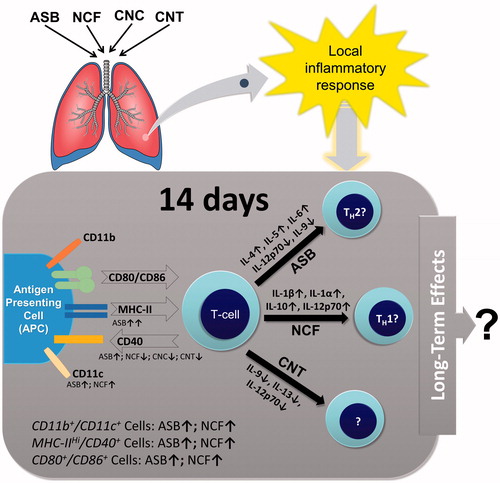
Based on the findings here, we suggest that after an acute phase, distinctive immune response patterns emerge in hosts exposed to different fibrous materials (). This clearly requires further assessment of immune cell migration in response to persistence of fibers in the lungs, a measure not evaluated here. Likewise, care should be taken in generalizing our conclusions, as this study included a single timepoint and utilized bolus exposures. Considering epitheliocytes can also participate in antigen-presenting activity and produce soluble cytokines (Rossi et al. Citation1990; Corbiere et al. Citation2011), prospective studies should incorporate more detailed investigation of non-immune cells. Other analyses employing additional timepoints and varying doses would also allow for clearer elucidation of effects to be made. Future investigations should also include a general enlargement of the analyzed marker panels. It might be also feasible to evaluate the functional role of Treg LMPHs.
Figure 7. Proposed local pulmonary immune response alterations in mice 14 days post-exposure to ASB, CNC, NCF, and CNT via pharyngeal aspiration.
Conclusions
While evaluating local (pulmonary) and systemic (splenic) APC phenotypic markers, it was found that all particulates tested herein had an effect on local APC maturity and phenotype with involvement of different surface molecules. Pulmonary exposure to fibrous materials led to discrete local immune cell polarization patterns at 14 days post-exposure. The immune response induced by crocidolite ASB is indicative of a chronic inflammation and possible TH2-type polarization of the T-cells, while experimental data following exposure to NCF show TH1-like response. Overall, ASB induced not only a distinct pattern of immunotoxicity, but also a much stronger response. Asbestos was the only material not properly handled by the immune system. Nanocellulose agents did not, as evidenced here, behave as “asbestos-like” materials; the same can be said for the studied SWCNT, while other CNTs, in particular the long and rigid multi-walled CNTs, may very well be ASB-like (Kuempel et al. Citation2017). When searching for the alternatives to existing fibrous materials, one should consider alterations in immune responses due to particle morphology after its introduction into the lungs.
Anna_Shvedova_et_al_supplemental_content.zip
Download Zip (817.3 KB)Disclosure statement
The authors report no conflicts of interest. The authors alone are responsible for the content of this manuscript.
The findings and conclusions in this report are those of the authors and do not necessary represent the view of the National Institute for Occupational Safety and Health policy.
Additional information
Funding
Related Research Data
References
- Abi Abdallah D, Egan C, Butcher B, Denkers E. 2011. Mouse neutrophils are professional antigen-presenting cells programmed to instruct TH1 and TH17 T-cell differentiation. Int Immunol. 23:317–326.
- Akuthota P, Wang H, Weller P. 2010. Eosinophils as antigen-presenting cells in allergic upper airway disease. Curr Opin Allergy Clin Immunol. 10:14–19.
- Allegri M, Bianchi M, Chiu M, Varet J, Costa A, Ortelli S, Blosi M, Bussolati O, Poland C, Bergamaschi E. 2016. Shape-related toxicity of titanium dioxide nanofibres. PLoS One. 11:e0151365.
- Bellou A, Finn P. 2005. Co-stimulation: Critical pathways in the immunologic regulation of asthma. Curr Allergy Asthma Rep. 5:149–154.
- Bhattacharya K, Kilic G, Costa PM, Fadeel B. 2017. Cytotoxicity screening and cytokine profiling of nineteen nanomaterials enables hazard ranking and grouping based on inflammogenic potential. Nanotoxicology. 11:809–826.
- Bilyk N, Holt P. 1995. Cytokine modulation of the immunosuppressive phenotype of pulmonary alveolar macrophage populations. Immunology. 86:231–237.
- Bonneau L, Malard C, Pezerat H. 1986. Studies on surface properties of asbestos. II. Role of dimensional characteristics and surface properties of mineral fibers in the induction of pleural tumors. Environ Res. 41:268–275.
- Castranova V, Schulte P, Zumwalde R. 2013. Occupational nanosafety considerations for carbon nanotubes and carbon nanofibers. Acc Chem Res. 46:642–649.
- Colantonio L, Recalde H, Sinigaglia F, D’Ambrosio D. 2002. Modulation of chemokine receptor expression and chemotactic responsiveness during differentiation of human naive T-cells into TH1 or TH2 cells. Eur J Immunol. 32:1264–1273.
- Corbiere V, Dirix V, Norrenberg S, Cappello M, Remmelink M, Mascart F. 2011. Phenotypic characteristics of human Type II alveolar epithelial cells suitable for antigen presentation to T-lymphocytes. Respir Res. 24:12–15.
- Cullen R, Miller B, Clark S, Davis J. 2002. Tumorigenicity of cellulose fibers injected into the rat peritoneal cavity. Inhal Toxicol. 14:685–703.
- Duan M, Steinfort D, Smallwood D, Hew M, Chen W, Ernst M, Irving L, Anderson G, Hibbs M. 2016. CD11b immunophenotyping identifies inflammatory profiles in the mouse and human lungs. Mucosal Immunol. 9:550–563.
- Dumortier H. 2013. When carbon nanotubes encounter the immune system: Desirable and undesirable effects. Adv Drug Deliv Rev. 65:2120–2126.
- Erdely A, Dahm M, Chen B, Zeidler-Erdely P, Fernback J, Birch M, Evans D, Kashon M, Deddens J, Hulderman T, et al. 2013. Carbon nanotube dosimetry: From workplace exposure assessment to inhalation toxicology. Part Fibre Toxicol. 10:53.
- Foa V, Basilico S. 1999. Chemical and physical characteristics and toxicology of man-made mineral fibers. Med Lav. 90:10–52.
- Glimcher L, Murphy K. 2000. Lineage commitment in the immune system: The T helper lymphocyte grows up. Genes Dev. 14:1693–1711.
- Guth A, Janssen W, Bosio C, Crouch E, Henson P, Dow S. 2009. Lung environment determines unique phenotype of alveolar macrophages. Am J Physiol. 296:L936–L946.
- Holt P, Oliver J, Bilyk N, McMenamin C, McMenamin P, Kraal G, Thepen T. 1993. Down-regulation of the antigen presenting cell function(s) of pulmonary dendritic cells in vivo by resident alveolar macrophages. J Exp Med. 177:397–407.
- Holt P, Strickland D, Wikstrom M, Jahnsen F. 2008. Regulation of immunological homeostasis in the respiratory tract. Nat Rev Immunol. 8:142–152.
- Huizar I, Malur A, Midgette Y, Kukoly C, Chen P, Ke P, Podila R, Rao A, Wingard C, Dobbs L, et al. 2011. Novel murine model of chronic granulomatous lung inflammation elicited by carbon nanotubes. Am J Respir Cell Mol Biol. 45:858–866.
- Ilavska S, Jahnova E, Tulinska J, Horvathova M, Dusinska M, Wsolova L, Kyrtopoulos S, Fuortes L. 2005. Immunological monitoring in workers occupationally exposed to asbestos. Toxicology. 206:299–308.
- Jakubzick C, Tacke F, Llodra J, van Rooijen N, Randolph G. 2006. Modulation of dendritic cell trafficking to and from the airways. J Immunol. 176:3578–3584.
- Kalomenidis I, Light R. 2004. Pathogenesis of the eosinophilic pleural effusions. Curr Opin Pulm Med. 10:289–293.
- Kool M, Hammad H, Lambrecht B. 2012. Cellular networks controlling TH2 polarization in allergy and immunity. F1000 Biol Rep. 4:6.
- Kuempel E, Jaurand M, Møller P, Morimoto Y, Kobayashi N, Pinkerton K, Sargent L, Vermeulen R, Fubini B, Kaneet A. 2017. Evaluating the mechanistic evidence and key data gaps in assessing the potential carcinogenicity of carbon nanotubes and nanofibers in humans. Crit Rev Toxicol. 47:1–58.
- Lambrecht B. 2006. Alveolar macrophage in the driver's seat. Immunity. 24:366–368.
- Lippmann M. 2014. Toxicological and epidemiological studies on effects of airborne fibers: Coherence and public [corrected] health implications. Crit Rev Toxicol. 44:643–695.
- Lopes V, Sanchez-Martinez C, Stromme M, Ferraz N. 2017. In vitro biological responses to nanofibrillated cellulose by human dermal, lung and immune cells: Surface chemistry aspect. Part Fibre Toxicol. 14:1.
- Maus U, Janzen S, Wall G, Srivastava M, Blackwell T, Christman J, Seeger W, Welte T, Lohmeyer J. 2006. Resident alveolar macrophages are replaced by recruited monocytes in response to endotoxin-induced lung inflammation. Am J Respir Cell Mol Biol. 35:227–235.
- Menas A, Yanamala N, Farcas M, Russo M, Friend S, Fournier P, Star A, Iavicoli I, Shurin G, Vogel U, et al. 2017. Fibrillar vs crystalline nanocellulose pulmonary epithelial cell responses: Cytotoxicity or inflammation? Chemosphere. 171:671–680.
- Mercer R, Scabilloni J, Wang L, Kisin E, Murray A, Schwegler-Berry D, Shvedova A, Castranova V. 2008. Alteration of deposition pattern and pulmonary response as a result of improved dispersion of aspirated single-walled carbon nanotubes in a mouse model. Am J Physiol. 294:L87–L97.
- Mondal S. 2017. Preparation, properties and applications of nanocellulosic materials. Carbohydr Polym. 163:301–316.
- Muhle H, Pott F. 2000. Asbestos as reference material for fibre-induced cancer. Int Arch Occup Environ Health. 73:S53–S59.
- Mukae H, Vincent R, Quinlan K, English D, Hards J, Hogg J, van Eeden S. 2001. The effect of repeated exposure to particulate air pollution (PM10) on the bone marrow. Am J Respir Crit Care Med. 163:201–209.
- Nel A, Madler L, Velegol D, Xia T, Hoek E, Somasundaran P, Klaessig F, Castranova V, Thompson M. 2009. Understanding biophysicochemical interactions at the nano-bio interface. Nat Mater. 8:543–557.
- NIOSH. 2013. Current Intelligence Bulletin 65: occupational exposure to carbon nanotubes and nanofibers. Cincinnati (OH): US Department of Health and Human Services Centers for Disease Control and Prevention, National Institute for Occupational Safety and Health. Publication #2013-145. http://www.cdc.gov/niosh/docs/2013-145/pdfs/2013-145.pdf.
- Park E, Hong Y, Lee B, Yoon C, Jeong U, Kim Y. 2016. Single-walled carbon nanotubes disturbed the immune and metabolic regulation function 13-weeks after a single intratracheal instillation. Environ Res. 148:184–195.
- Pfau J, Serve K, Noonan C. 2014. Autoimmunity and asbestos exposure. Autoimmune Dis. 2014:782045.
- Rao G, Tinkle S, Weissman D, Antonini J, Kashon M, Salmen R, Battelli L, Willard P, Hoover M, Hubbs A. 2003. Efficacy of a technique for exposing the mouse lung to particles aspirated from the pharynx. J Toxicol Environ Health. 15:1441–1452.
- Rossi G, Sacco O, Balbi B, Oddera S, Mattioni T, Corte G, Ravazzoni C, Allegra L. 1990. Human ciliated bronchial epithelial cells: Expression of the HLA-DR antigens and of the HLA-DR α gene, modulation of the HLA-DR antigens by IFNγ and antigen-presenting function in the mixed leukocyte reaction. Am J Respir Cell Mol Biol. 3:431–439.
- Rydman E, Ilves M, Vanhala E, Vippola M, Lehto M, Kinaret P, Pylkkanen L, Happo M, Hirvonen M, Greco D, et al. 2015. A single aspiration of rod-like carbon nanotubes induces asbestos-like pulmonary inflammation mediated in part by the IL-1 receptor. Toxicol Sci. 147:140–155.
- Sargent L, Porter D, Staska L, Hubbs A, Lowry D, Battelli L, Siegrist K, Kashon M, Mercer R, Bauer A, et al. 2014. Promotion of lung adenocarcinoma following inhalation exposure to multi-walled carbon nanotubes. Part Fibre Toxicol. 11:3.
- Sargent L, Shvedova A, Hubbs A, Salisbury J, Benkovic S, Kashon M, Lowry D, Murray A, Kisin E, Friend S, et al. 2009. Induction of aneuploidy by single-walled carbon nanotubes. Environ Mol Mutagen. 50:708–717.
- Shanley T, Vasi N, Denenberg A. 2000. Regulation of chemokine expression by IL-10 in lung inflammation. Cytokine. 12:1054–1064.
- Shvedova A, Kisin E, Murray A, Johnson V, Gorelik O, Arepalli S, Hubbs A, Mercer R, Keohavong P, Sussman N, et al. 2008. Inhalation vs. aspiration of single-walled carbon nanotubes in C57BL/6 mice: Inflammation, fibrosis, oxidative stress, and mutagenesis. Am J Physiol. 295:L552–L565.
- Shvedova A, Tkach A, Kisin E, Khaliullin T, Stanley S, Gutkin D, Star A, Chen Y, Shurin G, Kagan V, et al. 2013. Carbon nanotubes enhance metastatic growth of lung carcinoma via up-regulation of myeloid-derived suppressor cells. Small. 9:1691–1695.
- Shvedova A, Yanamala N, Kisin E, Tkach A, Murray A, Hubbs A, Chirila M, Keohavong P, Sycheva L, Kagan V, et al. 2014. Long-term effects of carbon containing engineered nano-materials and asbestos in the lung: One-year post-exposure comparisons. Am J Physiol. 306:L170–L182.
- Siegrist K, Reynolds S, Kashon M, Lowry D, Dong C, Hubbs A, Young S, Salisbury J, Porter D, Benkovic S, et al. 2014. Genotoxicity of multi-walled carbon nanotubes at occupationally relevant doses. Part Fibre Toxicol. 11:6.
- Stanton M, Layard M, Tegeris A, Miller E, May M, Morgan E, Smith A. 1981. Relation of particle dimension to carcinogenicity in amphibole asbestoses and other fibrous minerals. J Natl Cancer Inst. 67:965–975.
- Stefaniak A, Seehra M, Fix N, Leonard S. 2014. Lung biodurability and free radical production of cellulose nanomaterials. Inhal Toxicol. 26:733–749.
- Stumbles P, Thomas J, Pimm C, Lee P, Venaille T, Proksch S, Holt P. 1998. Resting respiratory tract dendritic cells preferentially stimulate T-helper cell type 2 (TH2) responses and require obligatory cytokine signals for induction of TH1 immunity. J Exp Med. 188:2019–2031.
- Tatrai E, Adamis Z, Bohm U, Meretey K, Ungvary G. 1995. Role of cellulose in wood dust-induced fibrosing alveo-bronchiolitis in rat. J Appl Toxicol. 15:45–48.
- Terashima T, Wiggs B, English D, Hogg J, van Eeden S. 1997. Phagocytosis of small carbon particles (PM10) by alveolar macrophages stimulates the release of polymorphonuclear leukocytes from bone marrow. Am J Respir Crit Care Med. 155:1441–1447.
- The National Institute for Occupational Safety and Health (NIOSH). 2013. Occupational exposure to carbon nanotubes and nanofibers. Curr Intel Bull. 65:1–156.
- U.S. Geological Survey. 2017. Mineral commodity summaries 2017. U.S. Geological Survey; 202 p. https://doi.org/10.3133/70180197.
- Wang C, Yu X, Cao Q, Wang Y, Zheng G, Tan T, Zhao H, Zhao Y, Wang Y, Harris D. 2013. Characterization of murine macrophages from bone marrow, spleen and peritoneum. BMC Immunol. 14:6.
- Wong C, Lun S, Ko F, Ip W, Hui D, Lam C. 2005. Increased expression of plasma and cell surface co-stimulatory molecules CTLA-4, CD28 and CD86 in adult patients with allergic asthma. Clin Exp Immunol. 141:122–129.
- Xia T, Li N, Nel A. 2009. Potential health impact of nanoparticles. Annu Rev Public Health. 30:137–150.
- Yanamala N, Farcas M, Hatfield M, Kisin E, Kagan V, Geraci C, Shvedova A. 2014. In vivo evaluation of the pulmonary toxicity of cellulose nanocrystals: A renewable and sustainable nanomaterial of the future. ACS Sustain Chem Eng. 2:1691–1698.
- Zhang Y, Zhang Y, Gu W, Sun B. 2014. TH1/TH2 cell differentiation and molecular signals. Adv Exp Med Biol. 841:15–44.