
Abstract
Poly- and perfluoroalkyl substances (PFAS) are chemically and thermally stable, hydrophobic, lipophobic compounds used in stain repellants and water and oil surfactants, and associated with immunosuppression and peroxisome proliferator activity. Perfluoro-n-decanoic acid (PFDA, (CF3(CF2)8COOH), a fluorinated straight chain fatty acid compound, is reported to induce thymic atrophy and reversible bone marrow hypocellularity in rodent models. The objective of this study was to assess potential immunotoxicity of PFDA, due to its structural similarity to other immunosuppressive PFASs. Female Harlan Sprague–Dawley rats were exposed to 0–2.0 mg PFDA/kg by oral gavage daily for 28 d. Female B6C3F1/N mice were exposed once/week to 0–5.0 mg PFDA/kg by gavage for 4 weeks. Animals were evaluated for effects on immune cell populations in spleen and bone marrow, and innate, humoral-, and cell-mediated immunity. Mice were also evaluated for resistance to Influenza virus. Treatment-related hepatocyte necrosis and hepatomegaly were observed in rats treated with 0.5 mg PFDA/kg/d. In mice, hepatomegaly (26–89%) was observed following exposure to ≥0.625 mg PFDA/kg/week, while splenic atrophy (20%) was observed at 5.0 mg PFDA/kg/week. At 5.0 mg PFDA/kg/week, total spleen cells, and Ig + and NK + cells were decreased (17.6–27%). At ≥ 1.25 mg PFDA/kg/week the numbers of splenic CD3+, CD4+, CD8+, and Mac3+ cells were decreased (10.5–39%). No changes were observed in leukocyte subpopulations in PFDA-exposed rats. Phagocytosis by fixed-tissue macrophages was decreased in liver (specific activity, 24–39%) at ≥0.25 mg PFDA/kg/d in rats. PFDA-induced effects on humoral- and cell-mediated immunity, host resistance, and bone marrow progenitor cells were limited. These data suggest that exposure to PFDA may induce adverse effects in rat liver in a manner consistent with the PFAS class, and may also alter the balance of immune cell populations in lymphoid tissues in mice.
Introduction
Poly- and perfluoroalkyl substances (PFAS) are chemically and thermally stable, hydrophobic, lipophobic compounds used in many consumer products, including stain repellents, water and oil surfactants, non-stick coatings, and aqueous firefighting foams. PFAS are environmentally persistent, and have been detected in a variety of media and biota, including public water supplies, human serum and breast milk, and wildlife. Due to public health and environmental concerns, two common PFAS, perfluorooctanoic acid (PFOA) and perfluorooctane sulfonic acid (PFOS), were removed from production, and regulatory initiatives were developed to eliminate emissions and product content (Buck et al. Citation2011; Chang et al. Citation2016).
Exposure of laboratory animals to PFOA and PFOS has resulted in hepatomegaly, hepatic peroxisome proliferation, atrophy and alteration of cell populations in lymphoid organs (Yang et al. Citation2000; Qazi et al. Citation2009; Son et al. Citation2009; DeWitt et al. Citation2012; Dong et al. Citation2012), suppression of the T-cell-dependent IgM antibody response (TDAR), alterations in inflammatory cytokine signaling (Peden-Adams et al. Citation2008; Zheng et al. Citation2009, Citation2011; Dong et al. Citation2011; DeWitt et al. Citation2012), and reduction in thyroid hormone levels (Curran et al. Citation2008). PFOS reduced the host resistance to influenza A virus and natural killer cell activity in B6C3F1 mice (Guruge et al. Citation2009). Carbon chain length has been shown to be a key factor in PFAS effects. Long-chain (≥ 6 carbon) PFAS have a longer half-life and are more potent activators of the peroxisome proliferator-activated receptor (PPAR)-α pathway (Buck et al. Citation2011). There was also a positive correlation between carbon chain length and hepatomegaly (Kudo et al. Citation2006), total and renal clearance (Kudo et al. Citation2001; Ohmori et al. Citation2003), hydrophobicity (Goecke-Flora and Reo Citation1996), and induction of PPARα (Wolf, Takacs, et al. Citation2008), peroxisomal fatty acyl CoA-oxidase, hepatic phosphocholine (Goecke-Flora and Reo Citation1996), and peroxisomal β-oxidation (Kudo et al. Citation2006). Following a systematic review of the literature on the immune effects of PFOA and PFOS, the National Toxicology Program Office of Health Assessment and Translation (OHAT) concluded that there was a moderate level of evidence that PFOA and PFOS suppress the anti-vaccine antibody response, and are presumed to be an immune hazard to humans (OHAT Citation2016).
Perfluoro-n-decanoic acid (PFDA, [CF3(CF2)8COOH]) is a 10-carbon straight-chain fatty acid that is structurally similar to PFASs that have been established to be immunosuppressive, e.g. PFOA and PFOS. Although evidence is limited, rodent studies indicate that PFDA may affect the immune system, as indicated by thymic atrophy, reversible bone marrow hypocellularity, and alterations in thyroid hormone levels (George and Anderson Citation1986; Kelling et al. Citation1987; Harris et al. Citation1989; Nelson et al. Citation1992). Published reports have documented the occurrence of PFDA in human blood (Olsen et al. Citation2011; Denys et al. Citation2014) and breast milk (Fujii et al. Citation2012; Motas Guzman et al. Citation2016), and the correlation of PFDA levels with thyroid hormone homeostasis (Berg et al. Citation2016; Kim et al. Citation2016). The objective of this study was to evaluate potential adverse effects of PFDA to the immune system in female Harlan Sprague–Dawley rats and B6C3F1/N mice. Due to reported bone marrow hypocellularity, an evaluation of bone marrow cell populations was included in the standard testing battery for cell- and humoral-mediated, and innate immunity (Luster et al. Citation1988).
Materials and methods
Test substance
Perfluoro-n-decanoic acid (PFDA, C10HF19O2, CAS #335-76-2, Lot #01820LE, 97.8% pure, Sigma, St. Louis, MO) was obtained through an NTP analytical chemistry contract at Battelle (Columbus, OH). Dosing solutions were prepared weekly in deionized water containing 2% Tween 80 (pH ∼7) (vehicle), and stored at 2–5 °C and protected from light.
Animals and exposures
Specific pathogen-free Harlan Sprague–Dawley (HSD; female, 6–8-week-of-age) rats were obtained from Harlan Laboratories, Inc. (Envigo, Indianapolis, IN) and pathogen-free B6C3F1/N mice (female, 4–6 week-of-age) were obtained from Taconic Biosciences, Inc. (Germantown, NY). All animals were maintained on a 12-h light/dark cycle at 18–26 °C in an AAALAC-accredited facility. All experiments were conducted at Virginia Commonwealth University under an approved Animal Care and Use Committee protocol. The animals received NTP-2000 diet (Ziegler Brothers, Inc., Gardners, PA) and tap water ad libitum. At 7–9 week-of-age for rats (140–195 g) and 8–10-week-of-age for mice (18–22 g), the animals were randomized to treatment groups by electronic program, identified by tattoo, and placed on their assigned treatment (n = 8/group). Due to requirements for evaluation of immunological and toxicological endpoints, 11 separate cohorts of rats and 11 separate cohorts of mice were required to complete the study. Toxicokinetic studies indicated that PFDA has a long half-life (6–8 week) in male and female rats (Ohmori et al. Citation2003). In the absence of gender-based differences in compound metabolism, female rats and mice were used as they are the default for immunotoxicity evaluation in the NTP, due to the increased sensitivity of female rodents, and for comparison across other immunotoxicity studies (Luster et al. Citation1992; EPA Citation2013; Boverhoff et al. Citation2014).
Rats were exposed to PFDA by oral gavage at 0 (vehicle control), 0.125, 0.25, 0.5, 1, or 2 mg PFDA/kg/d, in a volume of 5 ml/kg of body weight, for 28 d. To avoid acute toxicity, the mice were exposed to PFDA by oral gavage once each week (days 1, 8, 15, and 22) at doses of 0, 0.3125, 0.625, 1.25, 2.5, and 5 mg/kg. Published literature has demonstrated immunomodulatory effects, acute toxicity, and weight loss in F344 rats at single, high doses of PFDA (20–50 mg PFDA/kg) (George and Anderson Citation1986; Harris et al. Citation1989; Nelson et al. Citation1992). Preliminary toxicokinetic (TK) studies estimated that the half-life of PFDA in female HSD rats was 32 d, following a single gavage administration of 2 mg PFDA/kg, with no signs of acute toxicity (unpublished data). Published TK evaluations of PFOA and perfluoronanoic acid (PFNA) indicate longer half-lives in mice compared to rats (Rodriguez et al. Citation2009; Tatum-Gibbs et al. Citation2011), and modeling of PFOA in mice suggests non-linear kinetics at daily doses of 5 mg PFOA/kg or higher compared with lower doses (Lou et al. Citation2009). Serum/plasma concentration of PFDA has been measured by the Centers for Disease Control to assess human exposure to PFASs (CDC Citation2014), with broad variation among the specific compounds. PFOS was measured in human serum at levels of 3–66 ng/ml and in human liver at 26 ng/g, while PFDA was observed in human plasma at levels of 0.1–2.0 ng/ml and in human liver at 0.85 ng/g (Kannan et al. Citation2004; Karrman et al. Citation2010; Okada et al. Citation2013; CDC Citation2014). Based on the long half-life of PFDA and the doses administered, the plasma levels of PFDA were likely much higher in this study compared to average human exposure.
The positive controls for the immune function assays were rabbit anti-asialo GM1 antibody (AAGM1, Wako BioProducts, Richmond, VA), maleic vinyl ether (MVE; Hercules Inc., Wilmington, DE), azathioprine (AZA, Sigma, St. Louis, MO) and cyclophosphamide (CPS; Sigma, St. Louis, MO). AAGM1, 1.0 ml (rats) or 0.2 ml (mice) of a 10% (v/v) solution in sterile physiological saline administered by intraperitoneal (IP) injection 24 hr prior to necropsy, was the control for natural killer (NK) cell activity and DNA synthesis. MVE, 50 mg MVE/kg, in phosphate-buffered saline (PBS, pH 7.4), administered in a single intravenous (IV) injection 24 hr prior to necropsy, was the control for mononuclear phagocytic system (MPS) activity. AZA, 200 mg AZA/kg, in 0.5% methylcellulose, administered orally (per os, PO) once daily on Days 24–28, was the control for the influenza virus host resistance assay. CPS, 25 mg CPS/kg in PBS administered IP (0.1 ml/20 g) once daily during the last 6 d of the exposure period, was the control for the sheep red blood cell (SRBC) and keyhole limpet hemocyanin (KLH) enzyme-linked immunosorbent assays (ELISA). CPS, given at a dose of 50 mg CPS/kg in PBS by IP injection once daily during the last 4 d of exposure, was the control for all other assays.
Toxicology studies
Body and organ weights
Animals were weighed prior to initiation of the study, and on Day 1, 8, 15, 22, and 29. On Day 29, animals were euthanized by CO2 inhalation/asphyxiation. Organ weights were obtained for the liver, spleen, lungs, thymus, and kidneys.
Hematology parameters
A panel of hematologic parameters was analyzed in blood using a Hemavet 1500FS (Drew Scientific, Waterbury, CT). Parameters evaluated included: erythrocyte and leukocyte numbers, leukocyte differentials, hemoglobin, hematocrit, mean corpuscular volume (MCV), mean corpuscular hemoglobin (MCH), mean corpuscular hemoglobin concentration (MCHC), and platelet number. Reticulocytes were evaluated using Retic-COUNT stain and FACScan flow cytometer (Becton Dickinson, San Jose, CA), according to the manufacturer’s directions.
Histopathology
At necropsy, the liver, spleen, lungs, thymus, kidneys, adrenals, bone marrow (femur), gastrointestinal (GI) tract with Peyer’s patches, and mesenteric, submandibular, and popliteal lymph nodes (LN) were collected, fixed in 10% neutral buffered formalin, sectioned at 4–6 µm, and stained with hematoxylin and eosin for histopathological evaluation in the rat study. The lymphoid organs were evaluated using enhanced histopathology (EH) guidelines (Elmore Citation2006a, Citation2006b, Citation2006c, Citation2006d, Citation2006e); non-lymphoid organs were evaluated by traditional histopathology. All evaluations were conducted in accordance with the NTP Immunotoxicity Study Pathology Specifications (https://ntptools.niehs.nih.gov/policiesAndProcedures/NTP%20Immunotoxicity%20Specification%20Document%202016.pdf). Mice were not evaluated for histologic lesions.
Immunology studies
Spleen cell immunophenotyping
Single-cell suspensions of splenocytes were analyzed by flow cytometry to quantify various cell populations, as previously described (White et al. Citation2005; Auttachoat et al. Citation2009). The populations evaluated were: B-lymphocytes (B-cells, CD45+ rats, Ig+ mice), total T-lymphocytes (T-cells, CD5+ rats, CD3+ mice), T-cell subsets (CD4+CD5+ and CD8+CD5+ rats, CD4+CD8−, and CD4-CD8+ mice), NK cells (NK+CD8+ rats, NK1.1+CD3− mice), and macrophages (His36+ rats, Mac-3+ mice). Isotype-matched irrelevant antibodies were used as controls. Cells were counted on a Becton Dickinson FACScan Flow Cytometer (BD Biosciences Immunocytometry Systems, San Jose, CA). Non-viable cells and red blood cells (RBC) were eliminated using a gate-setting that excluded propidium iodide (PI) fluorescence and a forward scatter threshold above RBC size. For each sample, 5000 PI-negative events were counted. All data were analyzed with CellQuest software v. 3.2.1 (Becton Dickinson, San Jose, CA).
T-dependent antibody responses to SRBC and KLH
The spleen IgM antibody-forming cell (AFC) response to SRBC was enumerated using a modified hemolytic plaque assay (Jerne et al. Citation1963; White et al. Citation2010), as previously described. Both mice and rats were immunized with SRBC on Day 25. In a separate assay, serum IgM antibody titers to SRBC in rats were evaluated using ELISA as previously described (Temple et al. Citation1993) following immunization on Day 23. Serum anti-KLH IgM antibody levels were evaluated, by ELISA, in rats immunized with 2 mg KLH by IV injection on study Day 23. Serum samples were diluted 1:32 (1:2 for positive control samples), and incubated 60 min at room temperature in Immulon-2 microtiter plates (Thermo-Fisher Scientific, Grand Island, NY) adsorbed with KLH and blocked with 1% (w/v) non-fat instant powdered milk prepared in PBS. Horseradish peroxidase-conjugated goat anti-mouse IgM antibody (100 μl of 1:1000 dilution, Southern Biotech, Birmingham, AL) was added to each well and the plates then incubated 60 min. Thereafter, 2,2′-azino-bis(3-ethylbenzothiazoline-6-sulfonic acid) (ABTS) substrate was added to each well and the plates incubated a further 45 min. Absorbance (405 nm) in each well was then measured using a Thermomax microplate reader (Molecular Devices, Sunnyvale, CA). For all ELISA assays, each sample was analyzed using 10 serial-2-fold dilutions, multipoint analysis, and SoftMax (Molecular Devices Corp, San Jose, CA) software.
Mixed-leukocyte response (MLR) to DBA/2 mouse spleen cells
A one-way MLR was conducted as previously described (Guo et al. Citation2000), using [3H]-thymidine (Perkin Elmer, Waltham, MA) incorporation into proliferating cells as the assay endpoint. Samples were counted using a PerkinElmer 1450 Micro-beta Trilux Liquid Scintillation and Luminescence Counter (PerkinElmer, Turku, Finland).
Anti-CD3+ mediated spleen cell proliferation
T-cell proliferation following stimulation with anti-CD3+ antibody was evaluated as previously described (Smith et al. Citation2010; White et al. Citation2013). Samples were counted using the 1450 Microbeta system. Incorporation of [3H]-thymidine into proliferating cells was used as the endpoint of the assay.
Delayed-type hypersensitivity (DTH) response to Candida albicans
The DTH response to C. albicans was conducted using a modification of the method by Smith and White (Citation2010). Mice were immunized with formalin-fixed C. albicans (AlerChek, Portland, ME) by subcutaneous (SC) injection in the right flank on Day 21 (2 × 10⁷ organisms for rats, 1 × 10⁷ for mice) and challenged with the C. albicans antigen chitosan in the right footpad on Day 29 (0.1 mg for rats, 0.04 mg for mice). Footpad swelling was measured prior to challenge and 24 [± 2] h post-challenge. Footpad swelling was calculated as [(post-measurement–pre-measurement)]. A challenge only group that received the chitosan injection on Day 29 without prior immunization with C. albicans was included to control for non-specific footpad swelling.
NK cell activity
NK cell activity was assessed as previously described (Wilson et al. Citation2001; Auttachoat et al. Citation2009), using [51Cr] (Na[51Cr]O4: Perkin Elmer, Turku, Finland)-labeled YAC-1 cells as the target for NK-mediated cytotoxicity. Effector:target (E:T) ratios of 200:1, 100:1, 50:1, 25:1, 12.5:1, and 6.25:1 were used. Following a 4-h incubation, 100 μl of supernatant from each well was counted using a Wallac 1480 Wizard 3” γ-counter (Perkin Elmer, Shelton, CT).
Mononuclear phagocyte system (MPS) activity
MPS functional activity was evaluated by measuring vascular clearance and uptake of [51Cr]-labeled SRBC ([51Cr]-SRBC) by fixed macrophages in the liver, spleen, lung, thymus, and kidney as described in White et al. (Citation1985). Rats were injected IV with [51Cr]-SRBC on Day 29, and tail vein blood was collected at multiple timepoints over a 30-min period (60 min for positive controls) and counted in a γ-counter to determine the [51Cr]-SRBC vascular half-life. Sixty minute post-injection, rats were euthanized, exsanguinated, and their liver, spleen, lungs, thymus, and kidneys removed, weighed, and counted to determine organ uptake of the SRBC.
Bone marrow DNA synthesis, colony formation, and differentials
Bone marrow was obtained by flushing the medullary cavities of the left femur with RPMI containing 2% fetal bovine serum (FBS: ThermoFischer Scientific, Waltham, MA). Single nucleated cell suspensions were prepared and adjusted to the desired concentration for each assay. All bone marrow assays were conducted as described in Smith et al. (Citation2013). The endpoints evaluated were: DNA synthesis, colony-forming units (CFU) and burst-forming units (BFU), and immunophenotype. DNA synthesis was assessed via incorporation of [3H]-thymidine into proliferating cells. Samples were counted using the PerkinElmer 1450 counter, and data expressed as CPM/6 × 105 cells. DNA synthesis was the only bone marrow parameter assessed in mice. Commercial MethoCult kits (STEMCELL Technologies, Vancouver, British Columbia, Canada) were used according to instructions to assess colony formation. CFU and BFU evaluated were: CFU-E and BFU-E following culture for 2–5 d at 37 °C with 3U erythropoietin/ml (STEMCELL Technologies, Cambridge, MA), CFU-GM following culture for 12–13 d at 37 °C with 20 ng granulocyte-macrophage colony-stimulating factor (CSF-GM)/ml (R&D systems, Minneapolis, MN), and CFU-M following culture for 12–13 d at 37 °C with 40 ng macrophage CSF (CSF-M)/ml (R&D Systems, Minneapolis, MN). Single cell suspensions of bone marrow cells were analyzed by flow cytometry to quantify various cell populations, as described in Smith et al. (Citation2013), and in the spleen cell immunophenotyping section above. Bone marrow populations evaluated were B-cell lineage (CD45RA+), T-cell lineage (CD3+), erythroid lineage (CD71+), and granulocytes/monocytes (CD11b/c+) cells.
Host resistance to influenza virus
Mice were treated with PFDA for 28 d as described above. On Day 29, 7 d after the last exposure, the mice were infected intranasally with Influenza A/Hong Kong/8/68 (H3N2) virus (obtained from Dr Robert Luebke, Environmental Protection Agency, Research Triangle Park, NC) at one of the three challenge levels. The viral stock was diluted in Ca, Mg-free PBS to 1:80 (challenge C), 1:440 (challenge B), and 1:2420 (challenge A), and instilled at 25 μl/nostril. Azathioprine (200 mg/kg) was used as the positive control for this study. Mice were observed twice daily for 21 d (until day 50 of study) for changes in appearance, locomotion, and respiration. Moribund animals were removed and humanely euthanized; percent moribundity (n = 12) was the assay endpoint (Burleson et al. Citation1996; Luebke et al. Citation2002).
Statistical analyses
All results, except the host resistance data, are presented as mean ± SE for 7–8 animals per group. All statistical analyses were conducted using SAS software (SAS Institute, Cary, NC). Jonckheere’s Test was used to test for dose-related trends. Data which typically exhibit a normal distribution were analyzed using a parametric multiple comparison procedure. If a significant trend was observed Williams’ test was used; if the trend was not significant Dunnett’s test was used. Positive control and vehicle control data were compared by Student’s t-test. Data for other endpoints were analyzed using a non-parametric multiple comparison procedure. If a significant trend was observed Shirley’s test was used; if the trend was not significant Dunn’s test was used. Positive control and vehicle control data were compared by a Wilcoxon Rank Sum Test. Host resistance data were analyzed by a Cochran–Armitage test, to establish single trend p values on binary moribundity data, and by a Fisher’s exact test to determine pairwise significance. Data that were different from control at p ≤ 0.05 were considered statistically significant.
Results
Body and organ weights
Significantly lower body weights (BW; 4–22%) and BW gain (27–103%) were noted in rats treated with 2 mg PFDA/kg/d at days 15, 22, and 29 (Supplemental Table 1) compared with controls; lower BW (5%) and BW gain (21%) were also observed at 1 mg PFDA/kg/d at day 29. At 2 mg PFDA/kg/d, two rats (out of 88) exhibited BW loss of >20% in 5 d, and were humanely euthanized. Due to the adverse clinical observations, and in accordance with NTP Laboratory Animal Management guidelines (NTP Citation2011), rats that received 1 or 2 mg PFDA/kg/d were excluded from further evaluation. All data below are based on doses that did not lead to acute toxicity.
No significant differences were observed in BW or BW gain in rats treated with 0.125–0.5 mg PFDA/kg/d (Supplemental Table 1). Organ weights were measured as a component of three studies, i.e. MPS study, TDAR to SRBC, and tissue collection for histopathology (). Relative liver weights were increased at 0.25 and 0.5 mg PFDA/kg/d, as compared with vehicle control, in all three studies (8–35%); the absolute liver weights were increased in two of three studies (23–39%). Absolute and relative thymus weights (0.125 and 0.25 mg PFDA/kg/d, 21–36%), and absolute and relative kidney weights (0.5 mg PFDA/kg/d, 9–13%), were increased in one study each. No effects were observed on spleen or lung weights.
Table 1. Body and organ weights in female Harlan Sprague–Dawley rats exposed to perfluoro-n-decanoic acid for 28 d.
Based on species-specific differences in pharmacokinetics, mice were exposed to PFDA weekly. Under those conditions, the only effect on weight was a 2.9% decrease in body weight, with a 22% decrease in weight gain, at day 29, at 5.0 mg PFDA/kg/week, compared with control (Supplemental Table 2). This observation, although statistically significant, was mostly the result of a single cohort of mice (out of 11), the 5.0 mg PFDA/kg/week/host resistance challenge C cohort. Absolute and relative liver weights were increased (16–89%) in mice treated with ≥ 0.625 mg PFDA/kg/week, relative to the vehicle control (), the relative spleen weights were decreased (9–22%) at ≥ 1.25 mg PFDA/kg/week, and the absolute spleen weight was decreased (19%) at 5.0 mg PFDA/kg/week relative to the vehicle control. No significant effects were observed on the weights of thymus, kidney, or lung.
Table 2. Body and organ weights in female B6C3F1/N mice exposed to perfluoro-n-decanoic acid for 28 d.
Hematology
No significant effects were observed on hematologic parameters or leukocyte populations in rats or mice, with the exception of MCH and MCHC in rats. Rat MCH and MCHC were decreased 6–7% at 0.25 mg PFDA/kg/d and 0.5 mg PFDA/kg/d (MCHC only), relative to the vehicle control (Supplemental Tables 3 and 4). These variations are not considered biologically relevant for the assessment of direct immunotoxicity (Descotes Citation2004).
Histopathology
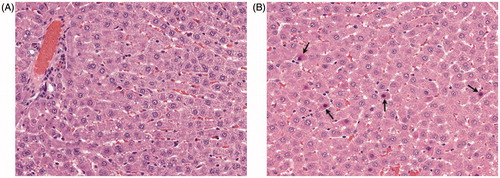
PFDA treatment at 0.5 mg/kg/d induced centrilobular, single cell, hepatocyte necrosis (grade 1.0, minimal severity) in 3/8 rats (). Common background lesions were detected in bone marrow, thymus, lung, and kidney. No treatment-related lesions were detected in the spleen, mucosa-associated lymphoid tissues, stomach, intestinal tract, or mandibular, mesenteric, or popliteal lymph nodes, at 0.125–0.5 mg PFDA/kg/d.
Figure 1. Hepatocyte necrosis in Harlan Sprague–Dawley rats exposed to PFDA for 28 d. Liver tissue from PFDA-treated and control rats was fixed in 10% neutral buffered formalin and evaluated using enhanced histopathology guidelines (see Methods section). Liver of (A) control or (B) rat treated with 0.5 mg PFDA/kg/d. Centrilobular, single cell, hepatocyte necrosis (arrows) was present in 3/8 rats and of minimal severity (grade 1.0). Note randomly scattered shrunken hepatocytes containing hyper-eosinophilic cytoplasm with small-to-occasionally pyknotic nuclei.
Spleen cell immunophenotypes
No effects on the total spleen cell numbers or on the absolute or relative values of splenic B-cells, T-cells, T-cell subsets, NK cells, or macrophages in rats were observed following 28 d of exposure to PFDA (). In mice, total spleen cell numbers were decreased 24% at 5 mg PFDA/kg/week, and the absolute numbers of B-cells, T-cells, T-helper cells, cytotoxic T-lymphocytes, NK cells, and macrophages were also decreased compared with vehicle controls (). Absolute B-cell (Ig+) numbers were decreased 27% at 5 mg PFDA/kg/week, while the relative percentage of B-cells was increased 9% at 0.625 mg PFDA/kg/week. Absolute T-cell (CD3+) and T-helper cell (CD4+CD8−) numbers decreased 13.5–44% and 12–29%, respectively, at ≥1.25 mg PFDA/kg/week, compared with corresponding vehicle control values. Absolute cytotoxic T-lymphocyte (CD4−CD8+, CTL) numbers decreased 10.5–28% at ≥0.625 mg PFDA/kg; the relative number of CTL decreased 13.4% at 0.625 mg PFDA/kg/week. Both absolute (20–39%) and relative (13.9–19%) macrophage (MAC3+) numbers decreased at ≥ 0.625 mg PFDA/kg/week. Absolute numbers of natural killer (NK) cells decreased 17.6% at 1.25 and 5.0 mg PFDA/kg/week. Absolute values reflect the full impact of exposure to the test article on each cell population compared to that from the vehicle control. This endpoint is considered to more accurately reflect what is occurring in an animal as assessment is based on the whole spleen (White et al. Citation2005). Percent values are normalized by spleen cell number, and, therefore, reflect both adverse impacts on specific cell populations and the potential induction of splenic atrophy and/or cytotoxicity.
Table 3. Spleen cell immunophenotyping in female Harlan Sprague–Dawley rats exposed to perfluoro-n-decanoic acid for 28 d.
Table 4. Spleen cell immunophenotyping in female B6C3F1/N mice exposed to perfluoro-n-decanoic acid for 28 d.
Humoral-mediated and cell-mediated immunity
No PFDA exposure-related effects were observed on the AFC response to SRBC in rats or mice, or in the serum IgM antibody levels to SRBC or KLH in rats (Supplemental Tables 5 and 6). The AFC response to SRBC in rats was measured in three studies, due to a low response (relative to historic controls) in the vehicle control group in one study, and due to inter-animal variability common in outbred stocks. No statistically significant effects were observed on the specific or total activity in any of the studies.
Similarly, no PFDA exposure-related effects were observed in two measures of cell-mediated immunity in rats or mice, the proliferative response to anti-CD3 stimulation and the delayed-type hypersensitivity response to C. albicans, or in the MLR in mice (Supplemental Tables 7 and 8). A decrease in total spleen cell numbers was noted at 0.25 and 0.5 mg PFDA/kg/d in non-immunized rats (18–23%), at 0.5 mg PFDA/kg/d in one of three studies in which rats were immunized with SRBC (15%), and at 5 mg PFDA/kg/week in mice (24%).
Innate immunity
The phagocytosis of SRBC by fixed tissue macrophages in liver and thymus was altered in rats. Although the vascular half-life for [51Cr]-SRBC was not significant (p = 0.158, ), the specific activity of fixed tissue macrophages in the liver (cpm [51Cr]-SRBC/mg tissue) was decreased 24–39% at 0.25–0.5 mg PFDA/kg/d ( ), concurrent with a 15–24% increase in liver weight. The total activity (trend p = 0.051) and percent uptake (trend p = 0.029) displayed a downward sloping curve (decrease of 12–25% at 0.25–0.5 mg PFDA/kg). At 0.5 mg PFDA/kg/d in the thymus, specific activity (174%), total activity (139%), and percent uptake (200%) of [51Cr]-SRBC were significantly increased (), relative to control. The thymus data should be interpreted with caution. Although statistically significant, the absolute values of the % uptake of [51Cr]-SRBC and the total activity in thymus were more than two orders of magnitude less than the negative control tissue (kidney).
Figure 2. Vascular half-life of [51Cr]-SRBC in rats exposed to PFDA for 28 d. Rats were injected intravenously with [51Cr]-SRBC on Day 29 at an amount equal to 20% of their hematocrit. Blood samples were collected over a 30-min period, and counted in a γ-counter to determine clearance of [51Cr]-SRBC from the blood and the vascular half-life. N = 8 rats/group for VH control and PFDA treated groups, N = 7 for MVE treated group. *p ≤ 0.05, Trend p = 0.158. VH: vehicle control; MVE: maleic vinyl ether (positive control for assay).
![Figure 2. Vascular half-life of [51Cr]-SRBC in rats exposed to PFDA for 28 d. Rats were injected intravenously with [51Cr]-SRBC on Day 29 at an amount equal to 20% of their hematocrit. Blood samples were collected over a 30-min period, and counted in a γ-counter to determine clearance of [51Cr]-SRBC from the blood and the vascular half-life. N = 8 rats/group for VH control and PFDA treated groups, N = 7 for MVE treated group. *p ≤ 0.05, Trend p = 0.158. VH: vehicle control; MVE: maleic vinyl ether (positive control for assay).](/cms/asset/ee911675-086f-4d8c-8c42-e5afea9bfa13/iimt_a_1445145_f0002_b.jpg)
Figure 3. Functional activity of the mononuclear phagocytic system in the liver and thymus of rats exposed to PFDA for 28 d. Rats were injected intravenously with [51Cr]-SRBC on Day 29 and the vascular half-life was determined. Sixty minutes after injection, tissues were excised and counted in a γ-counter to determine organ uptake of labeled SRBC. N = 8 rats/group for VH control and PFDA-treated groups, N = 7 for the MVE-treated group. *Value significantly different from VH control; *p ≤ 0.05. Specific activity = cpm 51Cr-SRBC/mg tissue. Specific activity trend: Liver p < 0.001. Total activity = total cpm 51Cr-SRBC measured in tissue. Total activity trend: Liver p = 0.051. % Uptake = % of total counts [51Cr]-SRBC injected into the animal. % Uptake trend: Liver p = 0.029. VH: vehicle control; MVE: maleic vinyl ether (positive control for assay).
![Figure 3. Functional activity of the mononuclear phagocytic system in the liver and thymus of rats exposed to PFDA for 28 d. Rats were injected intravenously with [51Cr]-SRBC on Day 29 and the vascular half-life was determined. Sixty minutes after injection, tissues were excised and counted in a γ-counter to determine organ uptake of labeled SRBC. N = 8 rats/group for VH control and PFDA-treated groups, N = 7 for the MVE-treated group. *Value significantly different from VH control; *p ≤ 0.05. Specific activity = cpm 51Cr-SRBC/mg tissue. Specific activity trend: Liver p < 0.001. Total activity = total cpm 51Cr-SRBC measured in tissue. Total activity trend: Liver p = 0.051. % Uptake = % of total counts [51Cr]-SRBC injected into the animal. % Uptake trend: Liver p = 0.029. VH: vehicle control; MVE: maleic vinyl ether (positive control for assay).](/cms/asset/292ef89b-9740-4d15-baa3-03372dd6174d/iimt_a_1445145_f0003_b.jpg)
Table 5. Functional activity of the mononuclear phagocytic system in female Harlan Sprague–Dawley rats exposed to perfluoro-n-decanoic acid for 28 d.
Natural killer cell activity was measured at E:T ratios of 6.25:1 to 200:1 for all PFDA doses. There was no significant effect on NK cell activity in any PFDA treated group in rats or mice (Supplemental Tables 9 and 10). NK cell activity in animals treated with AAGMI (positive control) was significantly suppressed at all E:T ratios in rats and at E:T 50:1 to 200:1 in mice.
Bone marrow
DNA synthesis was unaffected in both rats and mice. Bone marrow cellularity was reduced (26–39%) with 0.3125–0.625 mg PFDA/kg/week in one of three mouse studies (Supplemental Tables 11 and 13). Aside from a 13% decrease in the percentage of CD11b/c+ (granulocyte/monocyte) cells at 0.25 mg PFDA/kg/d, there were no treatment-related effects observed on the progenitor cell populations of bone marrow cells in rats, or on colony-forming units following in vitro stimulation with CSF-M, CSF-GM, or CSF-E (Supplemental Tables 11 and 12).
Host resistance to Influenza virus
Host resistance to Influenza virus was evaluated in mice at three virus challenge levels, 1:2420, 1:440, and 1:80 dilutions. Percent moribundity for the vehicle control at 1:2420 (challenge A) was 0, at 1:440 (challenge B) was 25%, and at 1:80 (challenge C) was 42%. This showed that this study included one non-lethal dose (1:2420), and one dose with a moribundity of < 30% (1:440), as recommended by Burleson et al. (Citation1996). Treatment with PFDA did not alter the survival of the mice following intranasal challenge with the virus at any dose or at any of the three virus challenge levels, relative to the respective controls, during the 21-d post-challenge observation period (Days 29–50 of study) (Supplemental Table 14). Although there was no effect on disease resistance, a 7.6% decrease (p = 0.05) in body weight, compared with control (25.66 [± 0.356] g), was observed on Day 29 with 5.0 mg PFDA/kg (23.72 [± 0.497] g) in challenge group C.
Discussion
Human exposure to PFDA, a persistent environmental pollutant, and other PFAS compounds, has been associated with contaminated food, drinking water, and leachate from PFAS-containing products (Axmon et al. Citation2014; Wang et al. Citation2014). Published reports indicate that PFDA may modulate humoral-, innate-, and cell-mediated immunity (Nelson et al. Citation1992), and thyroid hormone homeostasis (Harris et al. Citation1989; Berg et al. Citation2016). However, many of these effects were observed following IP exposure at levels that induced acute toxicity and morbidity. The current study reports the effect of PFDA on immune system parameters under conditions that did not induce reduced body weight or acute toxicity.
The data herein suggest PFDA exposure may contribute to adverse effects in the liver. Centrilobular, single cell necrosis was diagnosed in three of the eight HSD rats exposed to 0.5 mg PFDA/kg/d. Hepatomegaly was observed in both rats and mice, at exposure levels as low as 0.25 mg PFDA/kg/d in rats and 0.625 mg PFDA/kg/week in mice. Early studies consistently reported PFDA induced hepatomegaly\hepatocellular swelling in rodents after a single exposure to 20–50 mg PFDA/kg (George and Anderson, Citation1986; van Rafelghem et al. Citation1987; Harris et al. Citation1989).
The liver has been identified as a major target organ for PFAS compounds in rodents (Cui et al. Citation2009; Foreman et al. Citation2009; Qazi et al. Citation2010; Tatum-Gibbs et al. Citation2011; Botelho et al. Citation2015) and in humans (Karrman et al. Citation2010). Cui et al. (Citation2009) measured the concentration of PFOA and PFOS in the tissues of Sprague–Dawley rats; liver was one of the top two sites for bioaccumulation for both compounds. Similarly, a single exposure to 0.1 mmol PFNA/kg (≈ 46 mg/kg) resulted in hepatomegaly in C57Bl/6 mice (Rockwell et al. Citation2013). Heptatic histopathological and biological damage (immunological and non-immunological) have been observed following exposure to a variety of PFAS compounds in research animals, including peroxisome proliferation and activation of PPARα, peroxisomal β-oxidation, and liver tumors (DeWitt et al. Citation2009; Foreman et al. Citation2009; Qazi et al. Citation2010; DeWitt et al. Citation2012; OHAT Citation2016; Rockwell et al. Citation2017). However, with its resident lymphocyte and Kupffer cell populations, the liver is also a sensitive immune organ, capable of generating acute-phase proteins and cytokines, and engaging in phagocytosis, host resistance, and antigen recognition, processing, and presentation (Sheth and Bankey Citation2001; Racanelli and Rehermann Citation2006).
Phagocytosis by fixed tissue macrophages was reduced in rat liver at 0.25–0.5 mg PFDA/kg/d, consistent with the observation of hepatomegaly. Alterations in the phagocytic response could reflect modulation of macrophage function/activity, changes in the proportion of cell types, or modulation of an upstream event such as enzyme induction. Total phagocytic activity and % uptake give a more accurate picture of MPS activity in light of the hepatomegaly. While individual data points were not statistically significant, total activity (trend p = 0.051) and percent uptake (trend p = 0.029) displayed decreases of 12–25% at 0.25–0.5 mg PFDA/kg. Taken together, the hepatomegaly and decreases in % uptake and total activity suggest that MPS activity in the liver was mildly diminished by exposure to PFDA. However, the effects of PFDA on phagocytic activity in the liver should be interpreted with caution. It is equally possible that an increase in liver weight, with potential increase in hepatocyte numbers, diluted Kupffer cell (KC) numbers, resulting in an apparent decrease in overall activity, because total activity in the liver was not changed at specific dose levels.
Phagocytosis is a marker for activation of resident hepatic macrophages, i.e. KC (Cowper et al. Citation1990; Bojes and Thurman Citation1996). Activated KC release a variety of pharmacologically active mediators, i.e. reactive oxygen species and pro-inflammatory molecules (Bojes and Thurman Citation1996; Helmy et al. Citation2006; Roberts et al. Citation2007; Dixon et al. Citation2013; Xing et al. Citation2016), and contribute to hepatic phagocytosis, antigen presentation, innate immune responses and host defense. KC express and respond to PPARγ, but not PPARα or PPARβ (Peters et al. Citation2000). Roberts et al. (Citation2007) proposed a two-part hepatic response to peroxisome proliferators, a PPARα-dependent activation of liver parenchymal cells, and a PPARα-independent mechanism in which NADPH oxidase in KC is activated directly, followed by activation of NF-κB pathways (Clark and Valente, Citation2004, Panday et al. Citation2015), tumor necrosis factor (TNF)-α, and interleukin (IL)-1β that regulate PPARα in other hepatic cell populations (Peters et al. Citation2000; Roberts et al. Citation2007; Stienstra et al. Citation2010; Fang et al. Citation2012), and initiate a cascade of inflammatory responses (Roberts et al. Citation2007; Xing et al. Citation2016).
Published reports indicated that PFOA induced increases in hepatocyte hypertrophy, ultrastructural alterations of peroxisome proliferation (Wolf, Moore, et al. Citation2008), and gene expression changes related to PPARα activation (Rosen et al. Citation2008) in SV/129 mice. However, PFOA and PFOS also induced gene expression changes that were independent of PPARα for xenobiotic and fatty acid metabolism, inflammation, and cell cycle regulation in PPARα null mice (Rosen et al. Citation2008, Citation2010). Exposure to PFOA suppressed the T-cell dependent antigen response to SRBC in both PPARα knockout and wild-type C57BL/6 mice (DeWitt et al. Citation2016), while PFOS inhibited IL-2 production in stimulated human Jurkat T-cells in the presence and absence of the PPARα-antagonist GW6471 (Midgett et al. Citation2015), and inhibited TNFα and IL-8 secretion in stimulated THP-1 cells (pro-myelocytic cell line) in the presence and absence of PPARα siRNA (Corsini et al. Citation2011). In vitro, PFDA exposure decreased secretion of TNFα and IL-6 in stimulated human peripheral blood leukocytes (hPBL) and in THP-1 cells, decreased secretion of interferon (IFN)-γ by stimulated hPBL, and inhibited NF-κB activation in stimulated THP-1 cells. However, PFDA failed to activate PPARα-driven transcription in THP-1 cells (Corsini et al. Citation2012). Collectively, these data support an alternative PPARα-independent, possibly NF-κB-driven, mechanism in immune cells. In the current study, PFDA exposure induced effects on liver pathology and phagocytosis that were consistent with those induced by PFOA and the PFAS class, and that suggest possible immunosuppression.
A modified exposure paradigm (weekly dosing) in B6C3F1/N mice allowed for the evaluation of immune endpoints at higher doses of PFDA without induction of acute toxicity; although overall body burden would be lower than daily administration of the same dose. Under these conditions, further evidence of immunosuppression was observed. Immune cell phenotype determination in the spleen is a reliable indicator of immunotoxicity in mice, with a concordance rate of 83% (Luster et al. Citation1992; FDA Citation2002). At 5.0 mg PFDA/kg/week, spleen weight, total spleen cells, the total numbers of Ig+, CD3+, CD4+, CD8+, NK+, and Mac3+ cells (18–39%) were decreased in B6C3F1/N mouse spleen, and CD3+, CD4+, CD8+, and Mac3+ populations were decreased at 1.25 and 2.5 mg PFDA/kg/week. Relative values of Mac3+ cells were decreased in concert with absolute values; however, relative values of other spleen populations were not affected, possibly due to the splenic atrophy noted at 5.0 mg PFDA/kg/week. These findings are consistent with previous reports of decreased CD4+, CD8+, NK+, and B-cells (Qazi et al. Citation2009) in C57BL/6 mice exposed to PFOA or PFOS at subacute toxicity levels, of alterations in the proportions and numbers of T-cells, B-cells, immature T-cells, and phagocytes in spleen and thymus of C57BL/6 mice exposed to 0.1 mmol PFNA/kg (Rockwell et al. Citation2013, Citation2017), and of splenic atrophy following exposure to PFOS (C = 8), PFOA (C = 8), PNFA (C = 9), or PFDA (C = 10) (Harris et al. Citation1989; Qazi et al. Citation2009; Rockwell et al. Citation2013, Citation2017). No significant changes were observed in splenic leukocyte sub-populations in PFDA-exposed HSD rats. Under the daily exposure paradigm, acute toxicity prevented evaluation above 0.5 mg PFDA/kg. Though no adverse effects were observed on functional measures of cell- or humoral-mediated immunity, suppression of immune cell populations in the spleen could be an early indicator of immunosuppression, with impaired function at higher doses or longer exposure periods (Qazi et al. Citation2009).
It has been proposed that carbon chain length correlates positively with activity and adverse effects of PFAS compounds (Goecke-Flora and Reo Citation1996; Kudo et al. Citation2006; Wolf, Moore, et al. Citation2008; Buck et al. Citation2011), which suggests that the 10-carbon PFDA should induce a higher degree of immune suppression as compared to shorter-chain compounds. However, variability in potency and mode of action have been observed between PFOA and PFOS, both 8-carbon compounds and the most commonly studied PFAS. PFOS was consistently the more potent and immunotoxic of the two compounds when directly compared in in vitro studies (Corsini et al. Citation2011, Citation2012). Differences in effects on cytokine excretion (Corsini et al. Citation2011; Midgett et al. Citation2015), PPARα activation (Corsini et al. Citation2011), and enhancement/suppression of immune cell populations (Qazi et al. Citation2009, Citation2010), suggested different modes of action for the two compounds (Corsini et al. Citation2011). The lack of effect on functional immune endpoints in the current study, relative to published reports for PFOA and PFOS, could also be related to the dose and dosing paradigm or differences in pharmacokinetics. PFNA, a 9-carbon PFAS, induced splenic atrophy and altered immune cell populations in C57BL/6 mice at 0.1 mmol PFNA/kg, but with a 31–38% decrease in body weight for both male and female mice, relative to control (Rockwell et al. Citation2013, Citation2017). Published reports demonstrated the pharmacokinetics of PFOA and PFOS were dependent on the magnitude and frequency of dosing (Lou et al. Citation2009) and on the species (Rodriguez et al. Citation2009; Chang et al. Citation2016). The serum/plasma half-life was shortest in rats (2–4 h in female rats for PFOA and 1–2 month in rats for PFOS), and longest in humans (3–5 yr for PFOA and PFOS). Preliminary TK analysis of PFDA in female HSD rats conducted by the NTP resulted in a half-life of 32 d after a single gavage administration of 2 mg PFDA/kg. PFDA, PNFA, and other PFAS with >8 carbon units are less well-characterized than PFOA and PFOS (Rockwell et al. Citation2013). Concerns about acute toxicity and hepatic pathology may limit dosing paradigms and the assessment of potential adverse effects on functional immune endpoints for these compounds.
Conclusions
Exposure to PFDA for 28 d by oral gavage at doses of 0.125–0.5 mg/kg/d in HSD rats and 0.3125–5.0 mg/kg/week in B6C3F1/N mice, had little effect on humoral- and cell-mediated immunity, developing hematopoietic cells in the bone marrow, or host resistance to Influenza virus. At the level of the whole animal, the functional data suggest limited toxicity by PFDA under conditions of the study. However, such exposure contributed to adverse effects in the liver as evidenced by the histological lesions at 0.5 mg PFDA/kg. PFDA induced statistically significant changes in MPS activity in the liver at 0.25–0.5 mg PFDA/kg, but these results may be confounded by changes in liver weight and hepatocyte numbers. A reduction in immune cell populations in the spleen in B6C3F1/N mice suggest possible immunosuppression at higher doses (≥ 1.25 mg PFDA/kg/week), particularly for individuals with compromised immune function. Humans are seldom exposed to individual PFAS compounds in isolation; serum analysis has demonstrated that exposure to mixtures of PFASs is more typical. An analysis of 2003–2004 U.S. National Health and Nutrition Examination Survey (NHANES) samples detected 12 different PFASs in 2094 human serum samples, with four compounds present in > 98% of the samples (Calafat et al. Citation2007). While the immunotoxicity of PFDA alone is limited, it could contribute to the overall PFAS body burden. Collectively, these data suggest that, under conditions that do not induce acute toxicity, exposure to PFDA, a long chain polyfluoroalkyl compound, may induce adverse effects that are consistent with the PFAS class.
Rachel_Frawley_et_al_supplemental_content.zip
Download Zip (74.9 KB)Acknowledgements
Special thanks to Dr Michael DeVito for conducting the mathematical modeling used to determine the doses of the test article; to Ronnetta Brown, Anthony Brown, Michael Montague, Julia Nims, Andre Savage, and Dr Tai Guo for outstanding technical assistance in conducting this research; and to Drs. Georgette Hill, and Neil Allison for pathology support. The authors also thank Drs Andrew Rooney and Robert Luebke for their critical review of the manuscript.
Disclosure statement
The authors declare no conflicts of interest.
Additional information
Funding
Related Research Data
References
- Auttachoat W, Germolec D, Collins B, Luebke R, White K, Guo T. 2009. Immunotoxicological profile of chloroform in female B6C3F1 mice when administered in drinking water. Drug Chem Toxicol. 32:77–87.
- Axmon A, Axelsson J, Jakobsson K, Lindh C, Johsson B. 2014. Time trends between 1987 and 2007 for perfluoroalkyl acids in plasma from Swedish women. Chemosphere. 102:61–67.
- Berg V, Nost T, Pettersen R, Hansen S, Veyhe A, Jorde R, Odland J, Sandanger T. 2016. Persistent organic pollutants and the association with maternal and infant thyroid homeostasis: A multi-pollutant assessment. Environ Health Perspect. 125:127–133.
- Bojes H, Thurman R. 1996. Peroxisome proliferators activate Kupffer cells in vivo. Cancer Res. 56:1–4.
- Botelho S, Saghafian M, Pavlova S, Hassan M, Depierre J, Abedi-Valugerdi M. 2015. Complement activation is involved in the hepatic injury caused by high-dose exposure of mice to perfluorooctanoic acid. Chemosphere. 129:225–231.
- Boverhoff D, Ladics G, Luebke R, Bothan J, Corsini E, Evans E, Germolec D, Holsapple M, Loveless S, Lu H, et al. 2014. Approaches and considerations for the assessment of immunotoxicity for environmental chemicals: A workshop summary. Regul Toxicol Pharmacol. 68:96–107.
- Buck R, Franklin J, Berger U, Conder J, Cousins I, de Voogt P, Jensen A, Kannan K, Mabury S, van Leeuwen S. 2011. Perfluoroalkyl and polyfluoroalkyl substances in the environment: Terminology, classification, and origins. Integr Environ Assess Manage. 7:513–541.
- Burleson G, Lebrec H, Yang Y, Ibanes J, Pennington K, Birnmaum L. 1996. Effect of 2,3,7,8-tetrachlorodibenzo-p-dioxin (TCDD) on influenza virus host resistance in mice. Fundam Appl Toxicol. 29:40–47.
- Calafat A, Wong L, Kuklenyik Z, Reidy J, Needham L. 2007. Polyfluoroalkyl chemicals in the U.S. population: Data from National Health and Nutrition Examination Survey (NHANES) 2003–2004 and comparisons with NHANES 1999–2000. Environ Health Perspect. 115:1596–1602.
- Centers for Disease Control (CDC). 2014. Fourth National Report on Human Exposure to Environmental Chemicals. U.S. Department of Health and Human Services CFDCaP. https://www.cdc.gov/exposurereport/pdf/FourthReport_UpdatedTables_Aug2014.pdf
- Chang E, Adami H, Boffetta P, Wedner H, Mandel J. 2016. A critical review of perfluorooctanoate and perfluorooctanesulfonate exposure and immunological health conditions in humans. Crit Rev Toxicol. 46:279–331.
- Clark R, Valente A. 2004. NF-κB activation by NADPH oxidases. Mech Ageing Dev. 125:799–810.
- Corsini E, Avogadro A, Galbiati V, Dell’agli M, Marinovich M, Galli C, Germolec D. 2011. In vitro evaluation of the immunotoxic potential of perfluorinated compounds (PFCs)). Toxicol Appl Pharmacol. 250:108–116.
- Corsini E, Sangiovanni E, Avogadro A, Galbiati V, Viviani B, Marinovich M, Galli C, Dell’agli M, Germolec D. 2012. In vitro characterization of the immunotoxic potential of several perfluorinated compounds (PFC). Toxicol Appl Pharmacol. 258:248–255.
- Cowper K, Currin R, Dawson T, Lindert K, Lemasters J, Thurman R. 1990. A new method to monitor Kupffer-cell function continuously in the perfused rat liver. Dissociation of glycogenolysis from particle phagocytosis. Biochem Biochem J. 266:141–147.
- Cui L, Zhou Q, Liao C, Fu J, Jiang G. 2009. Studies on the toxicological effects of PFOA and PFOS on rats using histological observation and chemical analysis. Arch Environ Contam Toxicol. 56:338–349.
- Curran I, Hierlihy S, Liston V, Pantazopoulos P, Nunnikhoven A, Tittlemier S, Barker M, Trick K, Bondy G. 2008. Altered fatty acid homeostasis and related toxicologic sequelae in rats exposed to dietary potassium perfluorooctanesulfonate (PFOS). J Toxicol Environ Health. 71:1526–1541.
- Denys S, Fraize-Frontier S, Moussa O, Le Bizec B, Veyrand B, Volatier J. 2014. Is the fresh water fish consumption a significant determinant of the internal exposure to perfluoroalkylated substances (PFAS)? Toxicol Lett. 231:233–238.
- Descotes J, editor. (Ed.). 2004. Principles and methods of immunotoxicity. Amsterdam: Elsevier.
- DeWitt J, Peden-Adams M, Keller J, Germolec D. 2012. Immunotoxicity of perfluorinated compounds: Recent developments. Toxicol Pathol. 40:300–311.
- DeWitt J, Shnyra A, Badr MZ, Loveless SE, Hoban D, Frame SR, Cumard R, Anderson SE, Meade BJ, Peden-Adams MM, et al. 2009. Immunotoxicity of perfluorooctanoic acid and perfluoroctane sulfonate and the role of peroxisome proliferator-activated receptor alpha. Crit Rev Toxicol. 39:76–94.
- DeWitt J, Williams W, Creech N, Luebke R. 2016. Suppression of antigen-specific antibody responses in mice exposed to perfluorooctanoic acid: Role of PPARα and T- and B-cell targeting. J Immunotoxicol. 13:38–45.
- Dixon L, Barnes M, Tang H, Pritchard M, Nagy L. 2013. Kupffer cells in the liver. Compr Physiol. 3:785–797.
- Dong G, Liu M, Wang D, Zheng L, Liang Z, Jin Y. 2011. Sub-chronic effect of perfluoro-octanesulfonate (PFOS) on the balance of Type 1 and Type 2 cytokine in adult C57BL6 mice. Arch Toxicol. 85:1235–1244.
- Dong G, Wang J, Zhang Y, Liu M, Wang D, Zheng L, Jin Y. 2012. Induction of p53-mediated apoptosis in splenocytes and thymocytes of C57BL/6 mice exposed to perfluorooctane sulfonate (PFOS). Toxicol Appl Pharmacol. 264:292–299.
- Elmore S. 2006a. Enhanced histopathology of mucosa-associated lymphoid tissue. Toxcol Pathol. 34:687–696.
- Elmore S. 2006b. Enhanced histopathology of the bone marrow. Toxicol Pathol. 34:666–686.
- Elmore S. 2006c. Enhanced histopathology of the lymph nodes. Toxicol Pathol. 34:634–647.
- Elmore S. 2006d. Enhanced histopathology of the spleen. Toxicol Pathol. 34:648–655.
- Elmore S. 2006e. Enhanced histopathology of the thymus. Toxcol Pathol. 34:656–665.
- [EPA] Environmental Protection Agency. 2013. A Retrospective Analysis of Immunotoxicity Studies (870.7800). Health Effects Division OoPP, U.S. Environmental Protection Agency, Washington (D.C). https://www.epa.gov/sites/production/files/documents/immunotoxicity-retro-analysis.pdf
- Fang X, Zou S, Zhao Y, Cui R, Zhang W, Hu J, Dai J. 2012. Kupffer cells suppress perfluorononanoic acid-induced hepatic peroxisome proliferator-activated receptor α expression by releasing cytokines. Arch Toxicol. 86:1515–1525.
- Food and Drug Administration (FDA). 2002. Guidance for Industry. Immunotoxicology Evaluation of Investigational New Drugs. Services USDOHaH, Administration FaDResearch CFDEA. Rockville (MD). http://www.fda.gov/cder/guidance/index.htm
- Foreman J, Chang S, Ehresman D, Butenhoff J, Anderson C, Palkar P, Kang B, Gonzalez F, Peters J. 2009. Differential hepatic effects of perfluorobutyrate mediated by mouse and human PPAR-alphaα. Toxicol Sci. 110:204–211.
- Fujii Y, Yan J, Harada K, Hitomi T, Yang H, Wang P, Koizumi A. 2012. Levels and profiles of long-chain perfluorinated carboxylic acids in human breast milk and infant formulas in east Asia. Chemosphere. 86:315–321.
- George M, Anderson M. 1986. Toxic effects of nonadecafluoro-n-decanoic acid in rats. Toxicol Appl Pharmacol. 85:169–180.
- Goecke-Flora CM, Reo NV. 1996. Influence of carbon chain length on the hepatic effects of perfluorinated fatty acids. A 19F- and 31P-NMR investigation. Chem Res Toxicol. 9:689–695.
- Guo T, McCay J, Brown R, Musgrove D, Butterworth L, Munson A, Germolec D, White K. 2000. Glycidol modulation of the immune responses in female B6C3F1 mice. Drug Chem Toxicol. 23:433–457.
- Guruge K, Hikono H, Shimada N, Murakami K, Hasegawa J, Yeung L, Yamanaka N, Yamashita N. 2009. Effect of perfluorooctane sulfonate (PFOS) on influenza A virus-induced mortality in female B6C3F1 mice. J Toxicol Sci. 34:687–691.
- Harris M, Uraih L, Birmbaum L. 1989. Acute toxicity of perfluorodecanoic acid in C57Bl/6 mice differs from 2,3,7,8-tetrachlorodibenzo-p-dioxin. Fundam Appl Toxicol. 13:723–736.
- Helmy K, Katschki K, Gorgani N, Kljavin N, Elliott J, Diehl L, Scales S, Ghilardi N, Van L, Campagne M. 2006. CRIg: A macrophage complement receptor required for phago-cytosis of circulating pathogens. Cell. 124:915–927.
- Jerne N, Nordin A, Henry C. 1963. The agar plate technique for recognizing antibody-producing cells. In: Amos B, Koprowski H, editors. Cell-bound antibodies. Philadelphia: Wistar Institute Press.
- Kannan K, Corsolini S, Falandysz J, Fillmann G, Kumar K, Loganathan B, Mohd M, Olivero J, van Wouwe N, Yang J, et al. 2004. Perfluorooctanesulfonate and related fluorochemicals in human blood form several countries. Environ Sci Technol. 38:4489–4495.
- Karrman A, Domingo J, Liebaria X, Nadal M, Bigas E, van Bavel B, Lindstrom G. 2010. Biomonitoring perfluorinated compounds in Catalonia, Spain: Concentrations and trends in human liver and milk samples. Environ Sci Pollut Res. 17:750–758.
- Kelling C, Van Rafelghem M, Menahan L, Peterson R. 1987. Effects of perfluorodecanoic acid on hepatic indices of thyroid status in the rat. Biochem Pharmacol. 36:1337–1344.
- Kim D, Kim U, Kim H, Choi S, Oh J. 2016. Perfluoroalkyl substances in serum from South Korean infants with congenital hypothyroidism and healthy infants – its relationship with thyroid hormones. Environ Res. 147:399–404.
- Kudo N, Suzuki E, Katakura M, Ohmori K, Noshiro R, Kawashima Y. 2001. Comparison of the elimination between perfluorinated fatty acids with different carbon chain length in rats. Chem Biol Interact. 134:203–216.
- Kudo N, Suzuki-Nakajima E, Mitsumoto A, Kawashima Y. 2006. Responses of the liver to perfluorinated fatty acids with different carbon chain length in male and female mice: In relation to induction of hepatomegaly, peroxisomal β-oxidation and microsomal 1-acylglycerophosphocholine acyltransferase. Biol Pharm Bull. 29:1952–1957.
- Lou I, Wambaugh J, Lau C, Hanson R, Lindstrom A, Strynar M, Zehr R, Setzer R, Barton H. 2009. Modeling single and repeated dose pharmacokinetics of PFOA in mice. Toxicol Sci. 107:331–334.
- Luebke R, Copeland C, Bishop L, Daniels M, Gilmour M. 2002. Mortality in dioxin-exposed mice infected with influenza: Mitochondrial toxicity (Reye’s-like syndrome) versus enhanced inflammation as the mode of action. Toxicol Sci. 69:109–116.
- Luster M, Munson A, Thomas P, Holsapple M, Fenters J, White K, Lauer L, Germolec D, Rosenthal G, Dean J. 1988. Development of a testing battery to assess chemical-induced immunotoxicity: National Toxicology Program’s guidelines for immunotoxicology evaluation in mice. Fundam Appl Toxicol. 10:2–19.
- Luster M, Portier C, Pait D, White K, Gennings C, Munson A, Rosenthal G. 1992. Risk assessment in immunotoxicology. I. Sensitivity and predictability of immune tests. Fundam Appl Toxicol. 18:200–210.
- Midgett K, Peden-Adams M, Gilkeson G, Kamen D. 2015. In vitro evaluation of the effects of perfluorooctanesulfonic acid (PFOS) and perfluorooctanoic acid (PFOA) on IL-2 production in human T-cells. J Appl Toxicol. 35:459–465.
- Motas Guzman M, Clementini C, Perez-Carceles M, Jimenez Rejon S, Cascone A, Martellini T, Guerranti C, Cincinelli A. 2016. Perfluorinated carboxylic acids in human breast milk from Spain and estimation of infant’s daily intake. Sci Total Environ. 544:595–600.
- Nelson D, Frazier D, Ericson J, Tarr M, Mathes L. 1992. The effects of perfluorodecanoic acid (PFDA) on humoral, cellular, and innate immunity in Fischer 344 rats. Immunopharmacol Immunotoxicol. 14:925–938.
- National Toxicology Program (NTP). 2011. Laboratory animal management, NTP, National Institute of Environmental Health Sciences, National Institutes of Health, U.S. Department of Health and Human Services 2011. Specifications for the conduct of studies to evaluate the toxic and carcinogenic potential of chemical, biological, and physical agents in laboratory animals for the National Toxicology Program (NTP). Research Triangle Park (NC): National Toxicology Program
- Office of Health Assessment and Translation (OHAT). 2016. NTP Monograph on Immuno-toxicity Associated with Exposure to Perfluorooctanoic acid (PFOA) or Perfluorooctane Sulfonate (PFOS). Research Triangle Park: OHAT NTP, National Institute of Environmental Health Sciences, NIH, U.S. Department of Health and Human Services.
- Ohmori K, Kudo N, Katayama K, Kawashima Y. 2003. Comparison of the toxicokinetics between perfluorocarboxylic acids with different carbon chain length. Toxicology. 184:135–140.
- Okada E, Kashino I, Matsuura H, Sasaki S, Miyashita C, Yamamoto J, Ikeno T, Ito Y, Matsumura T, Tamakoshi A, et al. 2013. Temporal trends of perfluoroalkyl acids in plasma samples of pregnant women in Hokkaido, Japan, 2003–2011. Environ Int. 60:89–96.
- Olsen G, Ellefson M, Mair D, Church T, Goldberg C, Herron R, Medhdizadehkashi Z, Nobiletti J, Rios J, Reagen W, et al. 2011. Analysis of a homologous series of perfluorocarboxylates from American Red Cross adult blood donors, 2000–2001 and 2006. Environ Sci Technol. 45:8022–8029.
- Panday A, Sahoo M, Osorio D, Batra S. 2015. NADPH oxidases: An overview from structure to innate immunity-associated pathologies. Cell Mol Immunol. 12:5–23.
- Peden-Adams M, Keller J, Eudaly J, Berger J, Gilkeson G, Keil D. 2008. Suppression of humoral immunity in mice following exposure to perfluorooctane sulfonate. Toxicol Sci. 104:144–154.
- Peters J, Rusyn I, Rose M, Gonzalez F, Thurman R. 2000. Peroxisome proliferator-activated receptor α is restricted to hepatic parenchymal cells, not Kupffer cells: Implications for mechanism of action of peroxisome proliferators in hepatocarcinogenesis. Carcinogenesis. 21:823–826.
- Qazi M, Abedi M, Nelson B, Depierre J, Abedi-Valugerdi M. 2010. Dietary exposure to perfluorooctanoate or perfluorooctane sulfonate induces hypertrophy in centrilobular hepatocytes and alters the hepatic immune status in mice. Int Immunopharmacol. 10:1420–1427.
- Qazi M, Xia Z, Bogdanska J, Chang S, Ehresman D, Butenhoff J, Nelson B, Depierre J, Abedi-Valugerdi M. 2009. The atrophy and changes in the cellular compositions of the thymus and spleen observed in mice subjected to short-term exposure to perfluorooctanesulfonate are high-dose phenomena mediated in part by peroxisome proliferator-activated receptor-alpha (PPARalpha)α. Toxicology. 260:68–76.
- Racanelli V, Rehermann B. 2006. The liver as an immunological organ. Hepatology. 43:S54–S62.
- Roberts R, Ganey P, Ju C, Kemendulis L, Rusyn I, Klaunig J. 2007. Role of the Kupffer cell in mediating hepatic toxicity and carcinogenesis. Toxicol Sci. 96:2–15.
- Rockwell C, Turley A, Cheng X, Fields P, Klaassen C. 2013. Acute immunotoxic effects of perfluorononanoic acid (PFNA) in C57Bl/6 mice. Clin Exp Pharmacol. 4:S4–S002.
- Rockwell C, Turley A, Cheng X, Fields P, Klaassen C. 2017. Persistent alterations in immune cell populations and function from a single dose of perfluorononanoic acid (PFNA) in C57Bl/6 mice. Food Chem Toxicol. 100:24–33.
- Rodriguez C, Setzer R, Barton H. 2009. Pharmacokinetic modeling of perfluorooctanoic acid during gestation and lactation in the mouse. Reprod Toxicol. 27:373–386.
- Rosen M, Abbott B, Wolf D, Corton J, Wood C, Schmid J, Das K, Zehr R, Blair E, Lau C. 2008. Gene profiling in the livers of wild-type and PPARα-null mice exposed to perfluorooctanoic acid. Toxicol Pathol. 36:592–607.
- Rosen M, Schmid J, Corton J, Zehr R, Das K, Abbott B, Lau C. 2010. Gene expression profiling in wild-type and PPARα-independent effects. PPAR Res. 2010:794739.
- Sheth K, Bankey P. 2001. The liver as an immune organ. Curr Opin Crit Care. 7:99–104.
- Smith M, Germolec D, Frawley R, White K. 2013. Immunomodulatory effects of black cohosh (Actaea racemosa) extract in female B6C3F1/N mice. Toxicology. 308:146–419.
- Smith D, Smith M, White K. 2010. Systemic immunosuppression following a single pharyngeal aspiration of 1,2:5,6-dibenzanthracene in female B6C3F1 mice. J Immunotoxicol. 7:219–231.
- Smith M, White K. 2010. Establishment and comparison of delayed-type hypersensitivity models in the B6C3F1 mouse. J Immunotoxicol. 7:308–317.
- Son H, Lee S, Tak E, Cho H, Shin H, Kim S, Yang J. 2009. Perfluorooctanoic acid alters T-lymphocytes phenotypes and cytokine expression in mice. Environ Toxicol. 24:580–588.
- Stienstra R, Saudale F, Duval C, Keshtkar S, Groener J, Van Rooijen N, Staels B, Kersten S, Muller M. 2010. Kupffer cells promote hepatic steatosis via IL-2β-dependent suppression of peroxisome proliferator-activated receptor-alpha activity. Hepatology. 51:511–522.
- Tatum-Gibbs K, Wambaugh J, Das K, Zehr R, Strynar M, Lindstrom A, Delinsky A, Lau C. 2011. Comparative pharmacokinetics of perfluorononanoic acid in rat and mouse. Toxicology. 281:48–55.
- Temple L, Kawabata T, Munson A, White K. 1993. Comparison of ELISA and plaque-forming cell assays for measuring the humoral immune response to SRBC in rats and mice treated with benzo[a]pyrene or cyclophosphamide. Fundam Appl Toxicol. 21:412–419.
- Van Rafelghem M, Mattie D, Bruner R, Andersen M. 1987. Pathological and hepatic ultrastructural effects of a single dose of perfluoro-n-decanoic acid in the rat, hamster, mouse, and guinea pig. Fundam Appl Toxicol. 9:522–540.
- Wang Y, Rogan W, Chen P, Lien G, Chen H, Tseng Y, Longnecker M, Wang S. 2014. Association between maternal serum perfluoroalkyl substances during pregnancy and maternal and cord thyroid hormones: Taiwan maternal and infant corhort study. Environ Health Perspect. 122:529–534.
- White K, Delorme M, Beatty P, Smith M, Peachee V. 2013. Jet fuel kerosene is not immunosuppressive in mice or rats following inhalation for 28 days. J Toxicol Environ Health Part A. 76:778–797.
- White K, Germolec D, Booker C, Hernendez D, McCay J, Delclos K, Newbold R, Weis C, Guo T. 2005. Dietary methoxychlor exposure modulates splenic natural killer cell activity, antibody-forming cell response and phenotypic marker expression in F0 and F1 generations of Sprague Dawley rats. Toxicology. 207:271–281.
- White K, Musgrove D, Brown R. 2010. The sheep erythrocyte T-dependent antibody response (TDAR). Meth Mol Biol. 598:173–184.
- White K, Sanders V, Barnes D, Shopp G, Munson A. 1985. Immunotoxicological investigations in the mouse: General approach and methods. Drug Chem Toxicol. 8:299–332.
- Wilson S, McCay J, Butterworth L, Munson A, White K. 2001. Correlation of suppressed natural killer cell activity with altered host resistance models in B6C3F1 mice. Toxicol Appl Pharmacol. 177:208–218.
- Wolf C, Takacs M, Schmid J, Lau C, Abbott B. 2008. Activation of mouse and human PPARα by perfluoroalkyl acids of different functional groups and chain lengths. Toxicol Sci. 106:162–171.
- Wolf D, Moore T, Abbott B, Rosen M, Das K, Zehr R, Lindstrom A, Strynar M, Lau C. 2008. Comparative hepatic effects of perfluorooctanoic acid and WY 14,643 in PPARα knockout and wild-type mice. Toxcol Pathol. 36:632–639.
- Xing X, Wu H, Feng H, Yuan ZQ. 2016. Immune function of nonparenchymal liver cells. Genet Mol Res. 15:gmr.15018524.
- Yang Q, Xie Y, Depierre J. 2000. Effects of peroxisome proliferators on the thymus and spleen of mice. Clin Exp Immunol. 122:219–226.
- Zheng L, Dong G, Jin Y, He Q. 2009. Immunotoxic changes associated with a 7-day oral exposure to perfluorooctanesulfonate (PFOS) in adult male C57Bl/6 mice. Arch Toxicol. 83:679–689.
- Zheng L, Dong G, Zhang Y, Liang Z, Jin Y, He Q. 2011. Type 1 and type 2 cytokines imbalance in adult male C57BL/6 mice following a 7-day oral exposure to perfluorooctanesulfonate (PFOS) ). J Immunotoxicol. 8:30–38.