
 ?Mathematical formulae have been encoded as MathML and are displayed in this HTML version using MathJax in order to improve their display. Uncheck the box to turn MathJax off. This feature requires Javascript. Click on a formula to zoom.
Abstract
Skin sensitization is an important occupational health problem and immunotoxicity endpoint. Considering animal welfare and time and cost savings, many alternative approaches, such as those conducted in vitro, in silico, and in chemo, have been proposed and applied to predict skin sensitization of compounds. Toxicologically, sensitizers can elicit excess toxicity at greater levels than non-sensitizers due to their capacity to react with proteins/peptides. Based on this understanding, calculated toxicity enhancements (Te) of 65 organic compounds from three in vitro bioassays, i.e. 48-hr ciliate (Tetrahymena pyriformis) growth inhibition, and both 96-hr fathead minnow and 48-hr Daphnia magna acute lethal toxicities, were employed to qualitatively and quantitatively predict skin sensitization potencies of the test agents. The sensitivity, specificity, and accuracy reaching 80% strongly suggested toxicity enhancement was an excellent parameter for predicting skin sensitization. Linear regressions of skin sensitization against toxicity enhancement were fitted for each bioassay, and they were improved after the sensitizers were categorized into different reaction mechanistic domains, which, in decreasing order of contribution from Te to sensitization, were SNAr > SN1 > MA. These results indicated that toxicity bioassays are useful tools and that Te could be a useful parameter that might be applied to predict skin sensitization.
Introduction
Skin sensitization (e.g. allergic contact dermatitis, ACD), is an important immunotoxicologic endpoint that results from the allergic reaction of sensitizers in the skin (Aeby et al. Citation2010). Including allergic and irritant contact dermatitis, ACD is the second most commonly reported occupational disease, accounting for 10–15% of all occupational diseases (Anderson et al. Citation2011). Currently, the only valid methods for identifying skin sensitization to compounds are in vivo assays, such as the guinea pig maximization test (GPMT) and local lymph node assay (LLNA) in mice (mOECD Citation1992, Citation2002). However, due to regulatory requirements to reduce animal testing, researchers have tried to develop alternative (in vitro, in silico, and in chemo) approaches to predict allergenic compound skin sensitization potency (Aptula et al. Citation2006; Arning et al. Citation2009; Roberts and Natsch Citation2009; Aeby et al. Citation2010; Jeong et al. Citation2013). Common to these additional approaches is a fact that a key step in skin sensitization is the formation of a covalent adduct between skin sensitizers and local proteins/peptides (Natsch and Gfeller Citation2008; Aleksic et al. Citation2009).
Although aquatic toxicity and skin sensitization are different endpoints, their chemical reaction mechanisms are partially the same (Aptula and Roberts Citation2006). From the skin sensitization perspective, the higher the sensitizer reactive capacity, the higher is its sensitization potency (Natsch and Gfeller Citation2008). Moreover, it is accepted that when a compound presents reactivity to a protein/peptide, it could be a potential sensitizer (Gerberick et al. Citation2007) regardless of bioavailability. From a toxicity perspective, the higher the reactive capacity of an organic agent, the greater the excess toxicity elicited by that agent (Bo¨hme et al. Citation2009; Schramm et al. Citation2011). Chemically, the covalent binding of reactive compounds to DNA could lead to mutagenesis or genotoxicity (Thaens et al. Citation2012), binding to protein and/or peptides could lead to excess toxicity (Bo¨hme et al. Citation2010), and binding to immuno-proteins in skin could lead to skin sensitization (Roberts et al. Citation2011). Based on this link between skin sensitization and excess toxicity, it has been hypothesized that a sensitizer can elicit excess toxicity because of its reactive capability but that a non-sensitizer will only show narcotic-level toxicity due to a lack of reactive capacity.
Toxicity enhancement (Te), previously termed excess toxicity, is widely used to determine whether a compound can elicit reactive toxicity through a comparison with its baseline toxicity (von der Ohe et al. Citation2005; Schramm et al. Citation2011). Te = 10 has been proposed as a threshold to discriminate reactive from non-reactive compounds. Similarly, one reasonably assumes that toxicity enhancement can be utilized to discriminate a sensitizer from a non-sensitizer. In the present study, data on the toxicity of 65 compounds to Tetrahymena pyriformis, fathead minnow, and Daphnia magna were compiled and collected, and toxicity enhancements of each in the three biosystems were calculated and applied to predict their sensitization potency. The three selected assays in the different species, toxic endpoints, and exposure durations demonstrated that toxicity enhancement was a reliable parameter that could be used to predict skin sensitization potency and discriminate strong (and extreme) and moderate sensitizers from weak and non-sensitizers.
Materials and methods
Skin sensitization data
Skin sensitization estimates for the compounds of interest – based on local lymph node assay (LLNA) outcomes – were obtained from Gerberick et al. (Citation2005) and Kern et al. (Citation2010). Based on EC3 values, the compounds were categorized into five sub-categories (), i.e. extreme, strong, moderate, weak, and non-sensitizers. Log EC3 values of each were calculated (EquationEquation (1)(1)
(1) ; MW = molecular weight). Values were not calculated for non-sensitizers.
(1)
(1)
Table 1. Classification of skin sensitization potency through EC3 values.
Aquatic toxicity data
Data on aquatic toxicity to three aquatic organisms by the test compounds were collected from the U.S. EPA ECOTOX database and QSAR Toolbox 2.2. Experimental toxicity data (48-hr EC50, 50% growth inhibition concentration) were collected for the ciliate T. pyriformis, but data from minor 40-hr or 24-hr assays were also accepted. Additionally, data on 96-hr LC50 (50% lethal concentration) experimental toxicities towards fathead minnows were used, as were experimental acute toxicity (48-hr LC50, 50% lethal concentration) data with the cladoceran Daphnia magna. Only immobilization data (EC50, 50% effective concentration) were obtained for the minority compounds in the present research. The data set of information on the 65 agents represents an overlap between the LLNA and ECOTOX databases. Some compounds were excluded from the set due to their very complex structures or they were not widely utilized in daily life. Still, although the set here did not comprise the full LLNA database, the number of selected compounds was in the range of that used in the Direct Peptide Reactivity Assay (DPRA), i.e., 38 compounds used in 2004 and 82 in 2007 (Gerberick et al. Citation2004, Citation2007). This limited pool of test agents would be in keeping with another OECD-accepted in vitro assay; assessments of the Nrf2 pathway activation in keratinocytes also just examined 67 test agents in the model (Emter et al. Citation2010).
Reaction mechanistic domains
Previous studies suggested categorizing the sensitizers through their reaction mechanism domains (Aptula et al. Citation2005). Therefore, in the present research, these compounds had been categorized according to their reaction mechanisms, which were followed by QSAR Toolbox 2.2 suggestions. Accordingly, multiple reaction mechanisms had been proposed for some agents. For example, Compounds 8 and 10 act either as pro-Michael acceptors or via SN1 reaction mechanisms, and compound 9 acts either Michael acceptor or SN1 reaction mechanisms. Thus, the SN1 reaction mechanisms were selected as the dominant type for these compounds based on QSAR Toolbox 2.2 suggestions. Considering the roles of bio- or chemical-transformations, pro-Michael acceptors were classified as using Michael addition (MA) reaction conditions. Chemically, the non-sensitizers had not been expected to bind with proteins/peptides; as such, the QSAR Toolbox 2.2 suggested these compounds had no reaction mechanisms.
Basic and excess toxicity
Basic toxicity (defined as minimal toxicity correlated with hydrophobicity) of the 65 compounds to the three aquatic organisms were calculated through log Kow regression models (van Leeuwen et al. Citation1992; von der Ohe et al. Citation2005; Ellison et al. Citation2008). The baseline toxicity models for each organism are summarized in ; hydrophobicity, log Kow, was obtained using EPI Suite 4.1 software. Toxicity enhancements (Te) of each compound were calculated using EquationEquation (2)(2)
(2) (comparing experimental toxicity with narcotic toxicity).
(2)
(2)
Table 2. QSAR equations used to describe basic toxicity of organic agents to each organism.
Results
Excess toxicity data for 65 compounds
Values for toxicity enhancements (log Te) to the three organisms by the compounds of interest are shown in , which also summarizes the skin sensitization (log EC3), reaction mechanisms, as well as physicochemical properties of each agent. The toxicity enhancements of some compounds were unavailable because their toxicity data were missing. illustrates that the relationship between toxicity enhancement and sensitization potency presented a similar trend in all three organisms, i.e., extreme/strong sensitizers yielded the highest excess toxicities (average log Te > 2.50), followed by the moderate sensitizers (average log Te > 2.10). In comparison, weak and non-sensitizers showed only narcotic toxicity, with an average log Te < 1.00 and <0.50, respectively. Generally, a threshold of log Te = 1 is applied to separate excess toxic compounds from narcotic-level compounds (Blaschke et al. Citation2010, Citation2011; Schramm et al. Citation2011). In the study here, log Te = 1 was also used to discriminate strong, extreme, and moderate sensitizers from weak and non-sensitizers. All the bioassays yielded good sensitivity, specificity, and accuracy (of at least 80%) (). The fish model yielded the highest degree of accuracy (90.2%) and specificity (93.8%); the D. magna model presented the highest sensitivity (95.7%).
Figure 1. Box-plots of toxicity enhancement (log Te) against skin sensitization potency. Skin sensitization potency was identified through EC3 values: extreme <0.1%; strong 0.1–1.0%; moderate 1.0–10%; weak 10–100%; non-sensitizer >100%. (A) Tetrahymena pyriformis. (B) Fathead minnow. (C) Daphnia magna.
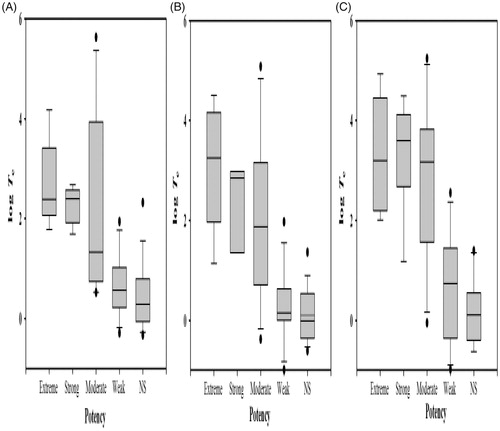
Table 3. The 65 test compounds evaluated in this study.
Table 4. Sensitivity, specificity and accuracy of Tetrahymena pyriformis, fathead minnow, and Daphnia magna bioassay models employing Te = 10 as threshold.
Various prediction models for different reaction mechanism domains
Linear regressions of log Te vs. log EC3 for the bioassays were calculated and examined (, Equations (3)–(5) []). Interestingly, the T. pyriformis bioassay model presented the steepest slope (−0.807) compared to the fish (−0.377) and Daphnia (−0.401) models. Previous research has strongly recommended that sensitizers be categorized according to their suspected reaction mechanisms but not their structure classes (Aptula et al. Citation2005). Due to limited toxicity and skin sensitization data, we only obtained three models of log EC3 plotted against log Te for the SN1, SNAr, and Michael addition (MA) reaction mechanisms. MA mechanism models showed negligible improvements; the slopes were not much steeper, and the r2 values did not increase (compare Equation (3)–(5) with (11)–(13)). By comparison, each model of the SN1 and SNAr reaction mechanisms showed visible improvements, with much steeper slopes and increased r2 values.
Figure 2. Linear regressions for toxicity enhancement (log Te) against skin sensitization (log EC3) for selected compounds (excluding non-sensitizers). Box-plots for (A) T. pyriformis. (B) Fathead minnow. (C) D. magna.
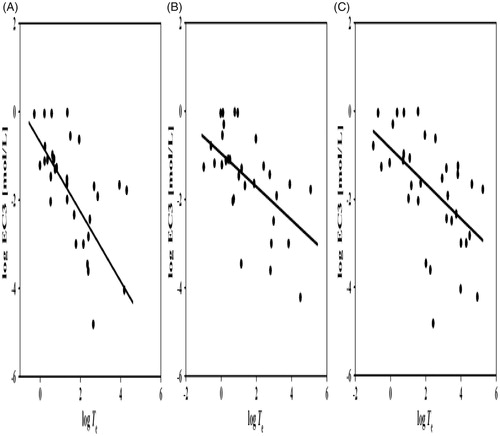
Table 5. Linear regressions of toxicity enhancements, log Te, against skin sensitization potency, log EC3, for different reaction mechanisms.
Contribution of bioavailability to skin sensitization
Regression equations including hydrophobicity as an additional descriptor to simulate bioavailability are summarized in . For all chemical compound groups, hydrophobicity clearly contributed to skin sensitization, though the r2 decreased and s increased (see Equation (14)–(16)). The steeper slopes of log Te and the negative slopes of log Kow in the fish and D. magna models indicated that reactivity and bioavailability cooperatively contribute to skin sensitization. Contributions from bioavailability were also visible in the models for the different reaction mechanisms (SN1, SNAr, MA). Based on the positive slopes associated with the T. pyriformis (SN1; Equation (17) and the minnow (SNAr; Equation (20), hydrophobicity did not appear to contribute to skin sensitization potency.
Table 6. Linear regressions of toxicity enhancements (log Te) as well as hydrophobicity (log Kow) vs skin sensitization potency (log EC3) for different reaction mechanisms.
Discussion
The key step in skin sensitization is formation of a covalent adduct between allergenic compounds and local proteins/peptides (Natsch and Gfeller Citation2008; Aleksic et al. Citation2009). Allergenic compounds could also elicit excess toxicities due to this kind of reactive capacity. In principle, skin sensitization and aquatic toxicity in part share chemical reaction mechanisms, but the endpoints differ (Aptula and Roberts Citation2006). A general understanding is that strong (and extreme) and moderate sensitizers can elicit excess toxicity due to high reactive capacity, but weak/non-sensitizers show only narcotic-level toxicity (due to lack of capacity). Therefore, it is possible toxicity enhancement (Te) can be used to screen for skin sensitization potencies.
Te has been successfully used for qualitative monitoring of skin sensitization (Aptula et al. Citation2006; Arning et al. Citation2009). The present research confirmed the suitability of Te for this application. Here it seems the largest Te values were observed with strong (and extreme) sensitizers (average log Te > 2.50), followed by moderate sensitizers (average log Te > 2.10); only narcotic toxicities were found with the weak (average log Te < 1.00) or non- (average log Te < 0.50) sensitizers. Compounds with a high reactive capacity could elicit excess toxicity and strong (or extreme) or moderate skin sensitization, while those with weak/no reactive capacity could only induce narcotic toxicity and weak or no skin sensitization. Thus, Te could be an excellent parameter for use in predicting skin sensitization.
A log Te = 1 as a threshold is widely accepted to discriminate excess toxic compounds from basic toxic compounds (von der Ohe et al. Citation2005; Schramm et al. Citation2011). In the current study, most of the weak sensitizers only showed narcotic toxicity (average log Te < 1.0). Aptula et al. (Citation2006) proposed a “rule” that log Te > 0.5 be a threshold to distinguish sensitizers from non-sensitizers. The present study results were partially consistent with those in the literature indicating that some weak sensitizers yield only narcotic-level toxicities. Nevertheless, log Te = 1 was still used as a threshold here to separate strong (and extreme) and moderate sensitizers from weak/non-sensitizers.
Each bioassay had up to 80% sensitivity, specificity, and accuracy for use in predicting skin sensitization potency of the test compounds. The sensitivity, specificity, and accuracy levels in the Direct Peptide Reactivity Assay were up to 53% in the pioneer 2004 investigation and improved to 80% in the 2007 analyses. In comparison, another OECD-accepted in vitro assay applied in a test cell line also obtained a close test accuracy of 85.1% (Emter et al. Citation2010). The LuSens assay – based on 69 test compounds – also had up to 80% sensitivity, specificity, and accuracy (Ramirez et al. Citation2014). Among the three models evaluated here, the highest accuracy and specificity [at-least 90%] was with the fish system. Furthermore, each organism showed different sensitivity in predicting skin sensitization, with the pattern fish > D. magna > T. pyriformis. Notably, the assays utilized different toxicity endpoints (i.e., growth vs. survival) and exposure durations (96 hr vs. 48 hr). Accordingly, such differences likely governed the sensitivity, specificity, and accuracy of each model to predicting sensitization potency. Nevertheless, the levels of consistency suggested that the bioassays evaluated here provided reliable outcomes, in many cases on par with the OECD-accepted reactivity assay (DPRA) and other established in vitro assays.
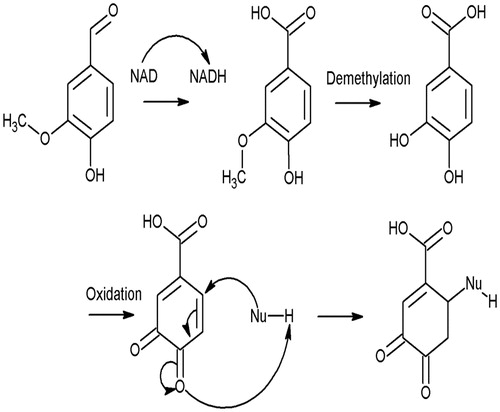
While 80% sensitivity, specificity, and accuracy of each bioassay is laudable, there were still some outliers in each case. For example, some moderate sensitizers showed only narcotic-level toxicities or were “non-sensitizers”. There are four possible explanations for such outliers. (A) Some sensitizers are too hydrophobic and fail to induce toxicity enhancement in bioassays; α-terpinene (26), a moderate sensitizer according to LLNA (EC3 = 8.9), is an excellent example. Here, it presented only narcotic-level toxicities (log Te = −0.38 and −0.05 to fish and Daphnia, respectively) because of its relatively high log Kow of 4.25. Generally, the log Te of a compound will decrease with an increase in log Kow (Schramm et al. Citation2011), so the toxicity enhancement of α-terpinene is masked due to a high log Kow. (B) Some weak/non-sensitizers showed excess toxicities due to biotransformation in in vitro assays. Vanillin (Compound 55) fails to induce sensitization due to a high activation energy (carbonyl group has deactivation effect) (Patlewicz et al. Citation2001). However, if a demethylated methoxy group is present in the meta and para position, hydroxyl can then be oxidized to a carbon–oxygen double bond (Patlewicz et al. Citation2001; Fabjan and Hulzebos Citation2008) – as illustrated in – enabling a Michael addition. Similarly, 2-nitro-3-pyridinol (Compound 63) shows toxicity enhancement because of biotransformation (Roberts et al. Citation2007). Notably, biotransformation is important for some sensitizers (especially pro-haptens) to exert their effect (Aptula et al. Citation2006; Natsch and Haupt Citation2013), thus, biotransformation should be considered during sensitization risk assessment. (C) Some skin sensitization data were false-negatives. For example, benzaldehyde (Compound 41) is identified as a non-sensitizer in the LLNA, but human data (patch test) indicated it is a moderate sensitizer (EC3 value of 10%) (Natsch et al. Citation2012). Indeed, here, benzaldehyde elicited excess toxicity to the fish (log Te = 1.36) and D. magna (log Te = 1.34), and its toxicity to T. pyriformis was 6-times higher than its narcotic toxicity. Both explanations (B) and (C) suggest the importance of biotransformation in skin sensitization. In the three bioassays here, biotransformation of some sensitizing pro-haptens is possible. However, from past studies it is clear that in many cases, a presence of additional enzymes (such as various P450s or those commonly found in S9 mixes prepared from rat liver) are needed to accurately measure reactive capabilities of test compounds and their skin sensitization potency (Natsch and Haupt Citation2013). (D) The potency of some sensitizers could be underestimated in LLNA due to compound loss via volatilization. By this, some reactive agents that should be strong or moderate sensitizers exhibit only weak sensitization potency. Roberts and Natsch (Citation2009) found that loss by volatilization was an important factor that could result in low skin sensitization potency in an LLNA. Examples of this can be seen by comparing methyl (Compound 33) and ethyl (Compound 34) acrylates to 2-ethylhexyl acrylate (Compound 23). Sensitization potencies of each agent are comparably weak, but their excess toxicities differ; this could be explained by significant difference in vapor pressures, i.e., 1.59 vs. 1.94 vs. −0.75 (log values; EPI suite), respectively. Such volatilization loss was also noted in other bioassays and clearly impacted on accurate toxicity calculations (Schramm et al. Citation2011).
Figure 3. Metabolic transformation of vanillin and its possible reactions.
While Te has been successfully applied in the qualitative monitoring of skin sensitization (Aptula et al. Citation2006; Arning et al. Citation2009), the current study established a quantitative relationship between log EC3 and log Te (excluding non-sensitizers because of their missing EC3 values) (Equations (3)–(5)). Furthermore, linear regressions were established for all compound classes as well as different reaction mechanisms. Interestingly, for all compound classes, the T. pyriformis model had the steepest slope (−0.807) compared with the fish (−0.377) and Daphnia (−0.401) models. This result suggested the Tetrahymena pyriformis model was the most sensitive to monitor skin sensitization potencies. Indeed, the log Te of T. pyriformis, fathead minnow, and D. magna (5.96, 6.07. and 6.63-orders of magnitude against the same 4.80 log units of skin sensitization potency) might help explain why the T. pyriformis model presented with the steepest slope.
The above conclusions were based on the degree of accuracy and specificity, which indicated the fish model was superior to the D. magna model. That the two model outcomes conflicted was possible because of discrepancies between qualitative and quantitative analyses and partly due to some false-negative log Te values that could statistically affect their generated regressions. For example, hexane is structurally a narcotic-level compound and a non-sensitizer, but its false-negative log Te value (−1.39) in D. magna suggested an experimental toxicity 10-times below baseline. Volatilization [and sorption] losses with different exposure durations could also be a reason for the false-negative toxicity data, as >99% of hexane can be lost in that manner (Schramm et al. Citation2011).
Based on the different slopes, the contribution of toxicity enhancement to skin sensitization potential followed a decreasing scale, i.e., SNAr > SN1 > MA. This finding agreed with previous reports that the degree of increase in skin sensitization differed with each reaction mechanism. As Michael acceptors present the lowest slopes compared to other reaction mechanisms (Natsch et al. Citation2011), this suggests that great increases in toxicity enhancement of Michael acceptors only slightly increase sensitization potency (compared with sensitizers that act via SN1 and SNAr). Thus, bioassays should be carefully used if monitoring Michael acceptor sensitization potencies.
Penetration of the stratum corneum is a first step in inducing skin sensitization (Aeby et al. Citation2010); this penetration process is usually modeled by hydrophobicity. Thus, a possible reason for failure of weak or non-sensitizers to induce skin sensitization could be a low bioavailability. Hydrophobicity showed a clear contribution to skin sensitization of the test compounds (though r2 decreased while s increased). Slopes of bioavailability (log Kow) and reactivity (log Te) in the fish and T. pyriformis models strongly indicated bioavailability and reactivity were inter-dependent and cooperatively contributed to compound sensitization. However, log Kow (which has a broad range) would be expected to less predictive of skin sensitization potency; this was confirmed by the steeper slopes of log Te compared to those of log Kow (Equations (14)–(16)).
Bioavailability also seemed to impact skin sensitization potency via each of the SN1, SNAr and MA reaction mechanisms. In the T. pyriformis model for SN1 (Equation (17) and the minnow model for SNAr (Equation (20) mechanisms, potency likely only depended on chemical reactivity, not on hydrophobicity. In silico studies also suggested that skin sensitization via Schiff base (SB) and SNAr mechanisms were independent of hydrophobicity (Roberts et al. Citation2006, Citation2011). For the Michael acceptors, a role for hydrophobicity in skin sensitization appeared in all three bioassays, as illustrated by negative log Kow slopes and decreased r2 and s values.
Conclusions
Toxicity enhancement (Te) appears to be a useful parameter to rank skin sensitization potencies of test agents, and could be used to discriminate strong, extreme, and moderate sensitizers from weak or non-sensitizers. Still, such enhancements vary in their ability to be used to predict sensitization potency, due to their different reaction mechanisms. Nevertheless, these bioassays seem to be useful approaches to predict skin sensitization by a variety of compounds and could be applied to replace or reduce animal tests. However, these tools should be carefully applied with non-sensitizers that could undergo biotransformation to agents that now impart excessive toxicity.
Disclosure statement
No potential conflict of interest was reported by the authors.
Additional information
Funding
References
- Aeby P, Ashikaga T, Bessou-Touya S, Schepky A, Gerberick F, Kern P, Marrec-Fairley M, Maxwell G, Ovigne JM, Sakaguchi H, et al. 2010. Identifying and characterizing chemical skin sensitizers without animal testing: Colipa's research and method development program. Toxicol In Vitro. 24:1465–1473.
- Aleksic M, Thain E, Roger D, Saib O, Davies M, Li J, Aptula A, Zazzeroni R. 2009. Reactivity profiling: Covalent modification of single nucleophile peptides for skin sensitization risk assessment. Toxicol Sci. 108:401–411.
- Anderson S, Siegel P, Meade B. 2011. The LLNA: A brief review of recent advances and limitations. J Allergy (Cairo). 2011:424203.
- Aptula A, Patlewicz G, Roberts D. 2005. Skin sensitization: Reaction mechanistic applicability domains for structure-activity relationships. Chem Res Toxicol. 18:1420–1426.
- Aptula A, Patlewicz G, Roberts D, Schultz T. 2006. Non-enzymatic glutathione reactivity and in vitro toxicity: A non-animal approach to skin sensitization. Toxicol In Vitro. 20:239–247.
- Aptula A, Roberts D. 2006. Mechanistic applicability domains for non-animal-based prediction of toxicological endpoints: General principles and application to reactive toxicity. Chem Res Toxicol. 19:1097–1105.
- Arning J, Matzke M, Stolte S, Nehen F, Bottin-Weber U, Bo¨schen A, Abdulkarim S, Jastorff B, Ranke J. 2009. Analyzing cytotoxic effects of selected isothiazol-3-one biocides using the toxic ratio concept and structure-activity relationship considerations. Chem Res Toxicol. 22:1954–1961.
- Blaschke U, Eismann K, Böhme A, Paschke A, Schüürmann G. 2011. Structural alerts for the excess toxicity of acrylates, methacrylates, and propiolates derived from their short-term and long-term bacterial toxicity. Chem Res Toxicol. 25:170–180.
- Blaschke U, Paschke A, Rensch I, Schu¨u¨rmann G, 2010. Acute and chronic toxicity toward the bacteria Vibrio fischeri of organic narcotics and epoxides: Structural alerts for epoxide excess toxicity. Chem Res Toxicol. 23:1936–1946.
- Bo¨hme A, Thaens D, Paschke A, Schu¨u¨rmann G, 2009. Kinetic Glutathione chemoassay to quantify thiol reactivity of organic electrophiles: Application to α,β-unsaturated ketones, acrylates, and propiolates. Chem Res Toxicol. 22:742–750.
- Bo¨hme A, Thaens D, Schramm F, Paschke A, Schu¨u¨rmann G, 2010. Thiol reactivity and its impact on the ciliate toxicity of α,β-unsaturated aldehydes, ketones, and esters. Chem Res Toxicol. 23:1905–1912.
- Ellison C, Cronin M, Madden J, Schultz T. 2008. Definition of the structural domain of the baseline non-polar narcosis model for T. pyriformis. Environ Res. 19:751–783.
- Emter R, Ellis G, Natsch A. 2010. Performance of a novel keratinocyte-based reporter cell line to screen skin sensitizers in vitro. Toxicol Appl Pharm. 245:281–290.
- Fabjan E, Hulzebos E. 2008. An evaluation of selected valid and mechanistically based SARs for skin sensitization. Toxicol In Vitro. 22:468–490.
- Gerberick F, Ryan C, Kern P, Schlatter H, Dearman R, Kimber I, Patlewicz G, Basketter D. 2005. Compilation of historical local lymph node data for evaluation of skin sensitization alternative methods. Dermatitis. 16:157–202.
- Gerberick G, Vassallo J, Bailey R, Chaney J, Morrall S, Lepoittevin J. 2004. Development of a peptide reactivity assay for screening contact allergens. Toxicol Sci. 81:332–343.
- Gerberick G, Vassallo J, Foertsch L, Price B, Chaney J, Lepoittevin J. 2007. Quantification of chemical peptide reactivity for screening contact allergens: A classification tree model approach. Toxicol Sci. 97:417–427.
- Jeong Y, An S, Shin K, Lee T. 2013. Peptide reactivity assay using spectrophotometric method for high-throughput screening of skin sensitization potential of chemical haptens. Toxicol In Vitro. 27:264–271.
- Kern P, Gerberick G, Ryan C, Kimber I, Aptula A, Basketter D. 2010. Local lymph node data for the evaluation of skin sensitization alternatives: A second compilation. Dermatitis. 21:8–32.
- mOECD. 1992. Guideline for Testing of Chemicals No. 406, Skin Sensitization. Adopted 17th July.
- mOECD. 2002. Guideline for Testing of Chemicals No. 429, Skin Sensitization: Local Lymph Node Assay. Adopted 24th April.
- Natsch A, Gfeller H. 2008. LC-MS-based characterization of the peptide reactivity of chemicals to improve the in vitro prediction of the skin sensitization potential. Toxicol Sci. 106:464–478.
- Natsch A, Gfeller H, Haupt T, Brunner G. 2012. Chemical reactivity and skin sensitization potential for benzaldehydes: Can Schiff base formation explain everything?. Chem Res Toxicol. 25:2203–2215.
- Natsch A, Haupt T. 2013. Utility of rat liver S9 fractions to study skin-sensitizing pro-haptens in a modified KeratinoSens assay. Toxicol Sci. 135:356–368.
- Natsch A, Haupt T, Laue H. 2011. Relating skin sensitizing potency to chemical reactivity: Reactive Michael acceptors inhibit NF-κB signaling and are less sensitizing than SNAr- and SN2-reactive chemicals. Chem Res Toxicol. 24:2018–2027.
- Patlewicz G, Basketter D, Smith C, Hotchkiss S, Roberts D. 2001. Skin-sensitization structure-activity relationships for aldehydes. Contact Dermatitis. 44:331–336.
- Ramirez T, Mehling A, Kolle SN, Wruck CJ, Teubner W, Eltze T, Aumann A, Urbisch D, van Ravenzwaay B, Landsiedel R. 2014. LuSens: A keratinocyte based ARE reporter gene assay for use in integrated testing strategies for skin sensitization hazard identification. Toxicol In Vitro. 28:1482–1497.
- Roberts D, Aptula A, Patlewicz G. 2006. Mechanistic applicability domains for non-animal based prediction of toxicological endpoints. QSAR analysis of the Schiff base applicability domain for skin sensitization. Chem Res Toxicol. 19:1228–1233.
- Roberts D, Aptula A, Patlewicz G. 2011. Chemistry-based risk assessment for skin sensitization: Quantitative mechanistic modeling for the SNAr domain. Chem Res Toxicol. 24:1003–1011.
- Roberts D, Natsch A. 2009. High throughput kinetic profiling approach for covalent binding to peptides: Application to skin sensitization potency of Michael acceptor electrophiles . Chem Res Toxicol. 22:592–603.
- Roberts D, Patlewicz G, Kern P, Gerberick F, Kimber I, Dearman R, Ryan CA, Basketter D, Aptula A. 2007. Mechanistic applicability domain classification of a local lymph node assay dataset for skin sensitization. Chem Res Toxicol. 20:1019–1030.
- Schramm F, Mu¨ller A, Hammer H, Paschke A, Schu¨u¨rmann G, 2011. Epoxide and thiirane toxicity in vitro with the ciliates Tetrahymena pyriformis: Structural alerts indicating excess toxicity. Environ Sci Technol. 45:5812–5819.
- Thaens D, Heinzelmann D, Böhme A, Paschke A, Schüürmann G. 2012. Chemoassay screening of DNA-reactive mutagenicity with 4-(4-nitrobenzyl)pyridine - application to epoxides, oxetanes, and sulfur heterocycles. Chem Res Toxicol. 25:2092–2102.
- van Leeuwen C, van der Zandt P, Aldenberg T, Verhaar H, Hermens J. 1992. Application of QSARs, extrapolation and equilibrium partitioning in aquatic effects assessment. I. Narcotic industrial pollutants. Environ Toxicol Chem. 11:267–282.
- von der Ohe P, Kühne R, Ebert R-U, Altenburger R, Liess M, Schüürmann G. 2005. A new classification model to discriminate excess toxicity from narcotic effect levels of organic compounds in the acute daphnid assay. Chem Res Toxicol. 18:536–555.