
Abstract
Evidence suggests that macrophages may play a role in the development of idiosyncratic drug-induced liver injury (IDILI). However, there has yet to be a clear link between macrophage activation and the inflammatory infiltrate that is characteristic of IDILI. A major chemokine involved in the recruitment of macrophages into the liver is C-C motif chemokine ligand 2 (CCL2)/monocyte chemoattractant protein 1 (MCP1). Therefore, we tested the effect of this chemokine in an animal model of IDILI. Specifically, amodiaquine (AQ), which is known to cause IDILI in humans, causes mild liver injury in wild-type C57BL/6 mice that resolves despite continued AQ treatment, but it causes more severe liver injury that does not resolve in PD-1−/− mice co-treated with anti-CTLA-4 to impair immune tolerance. CCR2−/− mice treated with AQ were not protected from the expected AQ-induced liver injury seen in wild-type C57BL/6 mice. In contrast, anti-CCL2 antibodies attenuated the liver injury caused by AQ in the impaired immune tolerance model. The difference in response of the two models is likely due to a difference in the IDILI mechanism; the mild injury in wild-type animals is mediated by NK cells, while the more serious injury in the impaired immune tolerance model requires CD8 T-cells. The results from these experiments provide evidence that macrophage infiltration into the liver may not be involved in mild IDILI mediated by the innate immune system, but it does appear necessary in more severe IDILI involving cytotoxic T-cells.
Introduction
Clinical evidence suggests that most idiosyncratic drug-induced liver injury (IDILI) is immune mediated (Cho and Uetrecht 2016). Furthermore, evidence suggests macrophages may play a role in initiation of immune-mediated IDILI, possibly involving inflammasome activation (Weston and Uetrecht Citation2014; Kato and Uetrecht Citation2017). However, there has yet to be a clear link between macrophage activation and the inflammatory infiltrate that is characteristic of IDILI.
A major chemokine involved in the recruitment of monocytes into the liver is C-C motif chemokine ligand 2 (CCL2)/monocyte chemoattractant protein 1 (MCP1). Chemokines are signaling proteins that mediate traffic or chemotaxis of immune cells into sites of injury (Deshmane et al. Citation2009). CCL2 is one of the most potent monocyte attractants and binds to CCR2, the CCL2 receptor. CCL2 is expressed by a variety of liver cells including macrophages, stellate cells, and endothelial cells (Deshmane et al. Citation2009), while CCR2 is primarily expressed on monocytes and certain T-cells (Mack et al. Citation2001). Expression of CCL2 can be induced by pro-inflammatory cytokines and cell stress, which leads to an increased accumulation of monocytes in the injured area (Deshmane et al. Citation2009). CCR2 is expressed mostly on a subset of monocytes that express Ly6C and are generally referred to as inflammatory monocytes (Geissmann et al. Citation2003). As these monocytes differentiate into macrophages the expression of CCR2 is down-regulated. For example, acetaminophen-induced hepatotoxicity in mice was shown to cause recruitment of a subset of activated macrophages into the liver mediated by CCL2/CCR2 (Dambach et al. Citation2002).
In these experiments, amodiaquine (AQ)-induced liver injury in mice was used as a model. AQ is an anti-malarial drug known to cause IDILI in humans. It also causes mild liver injury that resolves despite continued treatment in mice and rats (Metushi et al. Citation2015). It causes more serious injury in an impaired immune tolerance model utilizing PD1−/− mice co-treated with anti-CTLA-4, and this injury does not resolve with continued AQ treatment (Metushi et al. Citation2015b). This model was also shown to unlock the potential of isoniazid, nevirapine, troglitazone, and tolcapone to cause liver injury (Mak and Uetrecht 2015; Mak et al. 2017). CCR2−/− mice on a C57BL/6 background were used to determine the role of CCR2 in mild AQ-induced liver injury. In order to test the effects of CCL2/CCR2 signaling on severe AQ-induced liver injury, anti-CCL2 antibodies were used to deplete this chemokine in the impaired immune tolerance IDILI model.
Materials and methods
Animals and drug treatments
Female C57BL/6 mice (8–10-wk-of-age) were purchased from Charles River Laboratories (QC, Canada). CCR2−/− mice were generously donated from Dr. Michael Taylor (The Hospital for Sick Children, Toronto, ON, Canada) and then bred in-house. Female PD1−/− mice between 10–12-wk-of-age were bred and housed as previously described (Metushi et al. Citation2015b). AQ (hydrochloride salt, Ipca Laboratories Limited; Mumbai, India) was thoroughly mixed with rodent meal (2018 Teklad Global 18% Protein Diet, Envigo; ON, Canada) at a concentration of 0.2% (w/w) then provided in small jars ad libitum.
For the treatments, mice were randomly allocated into seven groups (N = 3/group). The groups were: wild-type C57BL/6 control mice (Control), wild-type C57BL/6 mice treated with AQ (AQ), CCR2−/− control mice (CCR2−/−), CCR2−/− mice treated with AQ (CCR2−/−/AQ), PD1−/− mice treated intraperitoneally (IP) with an anti-CCL2 (200 µg, 3 and 1 day before drug treatment and then twice weekly injections [anti-CCL2 = Clone 624416A2; Bio-X-cell, West Lebanon, NH]) (PD1−/−/anti-CCL2), PD1−/− mice treated with anti-CTLA-4 (250 µg IP, 3 and 1 day before drug treatment and then weekly injections [anti-CTLA-4 = Clone 9D9; Bio-X-cell]) and AQ (PD1−/−/anti-CTLA-4/AQ), PD1−/− mice treated with anti-CTLA-4, AQ, and, finally, anti-CCL2 (PD1−/−/anti-CTLA-4/AQ/anti-CCL2). All animal protocols used in this study were approved by the University of Toronto Animal Care Committee and conducted in an animal facility accredited by the Canadian Council on Animal Care.
Mice were euthanized by carbon dioxide asphyxiation at the end of the treatment period. At necropsy, the liver and spleen were removed and weighed prior to processing for histology or for isolation of mononuclear cells (see below).
ALT
Blood was collected weekly as previously described (Mak and Uetrecht 2015). To determine AQ-induced liver injury, serum alanine aminotransferase (ALT) levels were determined using a commercial kit (Thermo Scientific, Middletown, VA) according to manufacturer protocols.
Histology
Representative liver and spleen samples from three mice/group were placed in 10% neutral buffered formalin solution (Sigma, Oakville, ON, Canada). Each sample was paraffin-embedded, sectioned to 4-µm, stained with H&E, and then scanned at the CFIBCR Histology/Microscopy Core Unit of the University Health Network (Toronto, ON, Canada).
Isolation of mononuclear cells and flow cytometry
From the remaining liver tissue from each mouse, mononuclear cells were isolated stained with antibodies, and then phenotyped by flow cytometry as in Mak and Uetrecht (Citation2015a). In brief, mononuclear cells from each of the three mice/group were isolated by digestion of minced liver using collagenase followed by passage of the digested materials through tissue strainers. Mononuclear cells were then obtained by differential centrifugation.
After isolation, the mononuclear cells were stained for macrophages (M1 and M2), infiltrating macrophages, CD8 T-cells, CD4 T-cells, T-regulatory (Treg) cells, natural killer (NK) cells, NKT cells, and B-cells using standard protocols. Ultimately, the isolated macrophages were characterized as CD11b+/F4/80+, and then further characterized as either Kupffer cells (CD11b+/F4/80hi), M1 macrophages (CD11b+/F4/80+ and iNOS+ or IL-12+) or M2 macrophages (CD11b+/F4/80+ and Arg1+ or IL-10+). Infiltrating macrophages were characterized as CD11b+/Gr1+, CD4 T-cells as CD3+/CD4+, CD8 T-cells as CD3+/CD8+, Treg cells as CD4+/FoxP3+, NK cells as CD3-/NK1.1+, NKT cells as CD3+/NK1.1+, and B-cells as CD45R+. All cells were evaluated in an LSRII system (BD Biosciences, San Jose, CA) using FlowJo software. A minimum of 20 000 live cells were captured for each sample.
Statistical analysis
Means (± SEM) values were calculated for each experimental group. Statistical analyses were performed using Prism Software (GraphPad, San Diego, CA). Data were analyzed using a one- or two-way analysis of variance (ANOVA). A p values <0.05 was considered significant (*p < 0.05; **p < 0.01; ***p < 0.001).
CCR2−/− mice are not protected from mild AQ-induced liver injury
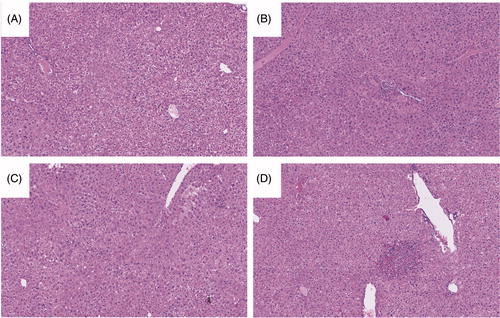
Liver injury was assessed by measuring blood ALT levels weekly. As shown in , there was no increase in serum ALT levels in the control wild-type C57BL/6 mice or control CCR2−/− mice. Treatment of wild-type C57BL/6 mice resulted in a delayed-onset rise in ALT levels that appeared to be recovering despite continued treatment. CCR2−/− mice treated with AQ were not protected from liver injury and developed similar increases in ALT levels as wild-type C57BL/6 mice treated with AQ. Liver histology appeared similar between groups, with only a few necro-inflammatory foci being noted in the tissues from the AQ-treated groups (). No significant findings were seen among the spleen samples (data not shown).
Figure 1. Mice treated with AQ develop delayed-onset mild liver injury that appears to be recovering despite continued treatment. Designations: Wild-type C57BL/6 mice (Control); wild-type mice treated with AQ (AQ); CCR2−/− control mice (CCR2−/−); and, CCR2−/− mice treated with AQ (CCR2−/−/AQ). Wild-type C57BL/6 mice and CCR2−/− mice treated with AQ had ALT levels significantly greater than Controls at Weeks 2–4 (significance of both AQ-treated mouse groups compared to control are displayed in figure). However, the two AQ-treated mouse groups did not significantly differ from each other. Wild-type C57BL/6 mice and CCR2−/− mice treated with AQ also had ALT levels significantly greater than CCR2−/− mice at Weeks 2–4 (p ≤ 0.05). Values shown are means ± SE. Two-way ANOVA. p < 0.05*, < 0.01**, < 0.001***, < 0.0001****.
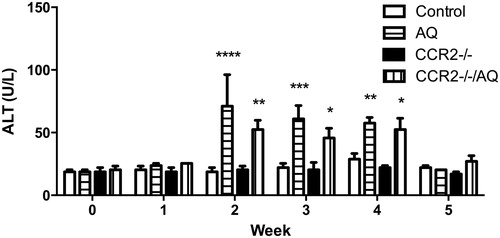
Figure 2. Stained liver sections. Samples shown are representative H&E-stained sections. (A) Control. (B) AQ. (C) CCR2−/−. (D) CCR2−/−/AQ. Group identities are defined in legend. Liver histology appeared similar between groups, with only a few necro-inflammatory foci being noted in the tissues from the AQ-treated groups.
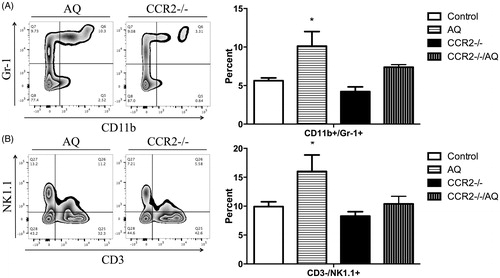
Liver immune cells were phenotyped to better understand the immune response to AQ in the different treatment groups. Though there was a trend toward increases in numbers of CD11b+/F4/80hi macrophages (presumably Kupffer cells) in wild-type animals treated with AQ, the changes (vs. control CCR2−/− mice) were not significant (Supplemental Figure 1). However, in these mice, there was a significant increase in GR1+/CD11b+ cells (presumably infiltrating macrophages) and NK cells compared to control CCR2−/− mice (). The increases in these cells in CCR2−/− mice treated with AQ appeared to be blunted because the “increases” were not significant compared to what was seen in the other groups (). Changes in levels of other the immune cells evaluated, as a function of treatment, were not significant (Supplemental Figure 1). This phenotyping was done at the end of the treatment period when serum ALT levels had returned to normal (see ); therefore, these immune cell changes may not represent the composition of cells in the liver during the actual injury.
Figure 3. Flow cytometry analysis of mononuclear leukocytes in the liver. Representative zebra plot and average from three mice/group are displayed. Mononuclear cells with significant differences among the treatment groups compared to control are displayed (when the difference was not significant the data are not shown). Wild-type C57BL/6 control mice (Control), wild-type C57BL/6 mice treated with AQ (AQ), CCR2−/− control mice (CCR2−/−), CCR2−/− mice treated with AQ (CCR2−/−/AQ). (A) The percentage of CD11b+/GR-1+ macrophages in the CCR2−/− group was less compared to the AQ group. (B) Significantly decreased percentage of NK cells in the CCR2−/− group compared to AQ group. Values shown are means ± SE. One-way ANOVA. *p < 0.05.
Anti-CCL2 antibodies decreased AQ-induced liver injury in impaired immune tolerance model
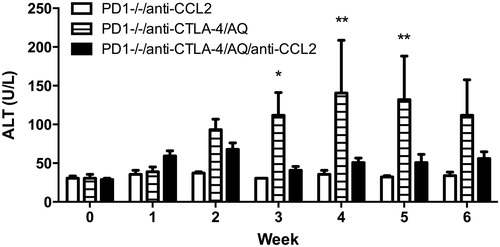
There was no increase in serum ALT levels in control PD1−/− mice treated with anti-CCL2 (). As was previously observed (Metushi et al. Citation2015), PD1−/− mice treated with anti-CTLA-4 and AQ developed a delayed-onset rise in ALT levels that appeared higher compared to in wild-type C57Bl/6 mice treated with AQ (). In contrast to CCR2−/− mice, anti-CCL2 treatment attenuated the increase in ALT in PD1−/− mice treated with anti-CTLA-4 and AQ. Specifically, AQ/anti-CTLA-4-treated PD1−/− mice had significantly increased ALT at Weeks 3–5. In contrast, there were no statistically significant increases in ALT at any time point in the AQ/anti-CTLA-4-treated PD1−/− mice that also received anti-CCL2 ().
Figure 4. ALT levels. PD1−/− mice treated with anti-CTLA-4 and AQ have significantly greater ALT levels at Weeks 3–5 compared to PD1−/− mice treated with anti-CTLA-4, AQ, and anti-CCL2 (significance displayed in figure). PD1−/− mice treated with anti-CTLA-4 and AQ also had significantly greater ALT levels at Weeks 3–6 (p ≤ 0.05) compared to PD1−/− mice treated with anti-CCL2. PD1−/− mice treated with anti-CCL2 (PD1−/−/anti-CCL2), PD1−/− mice with anti-CTLA-4 and AQ (PD1−/−/anti-CTLA-4/AQ), and PD1−/− mice with anti-CTLA-4, AQ, and anti-CCL2 (PD1−/−/anti-CTLA-4/AQ/anti-CCL2). Values represent the mean ± SE. Analyzed for statistical significant by two-way ANOVA. *p < 0.05; **p < 0.01.
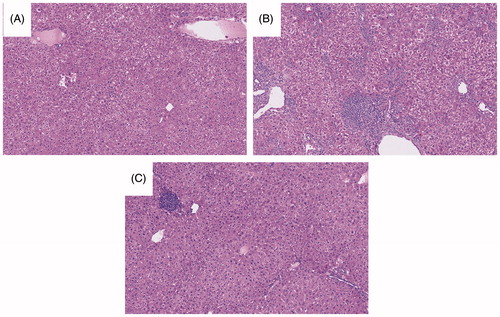
Histologically, anti-CCL2 treatment alone did not appear to cause any significant changes. In contrast, PD1−/− mice treated with anti-CTLA-4 and AQ demonstrated characteristic numerous necro-inflammatory foci seen in previous experiments (). PD1−/− mice treated with anti-CTLA-4, AQ, and anti-CCL2 still resulted in hepatic necro-inflammatory foci; however, they were fewer than in PD1-/-/anti-CTLA-4/AQ/anti-CCL2 group. No significant findings were noted among the spleens (data not shown).
Figure 5. Stained liver sections. Samples shown are representative H&E-stained sections. (A) PD1−/−/anti-CCL2. (B) PD1−/−/anti-CTLA-4/AQ. (C) PD1−/−/anti-CTLA-4/AQ/anti-CCL2. Group identities are fully defined in Figure 4 legend. Anti-CCL2 treatment did not appear to cause significant abnormalities, while PD1−/− mice treated with anti-CTLA-4 and AQ demonstrated the characteristic numerous necro-inflammatory foci seen in previous experiments. PD1−/− mice treated with anti-CTLA-4, AQ, or anti-CCL2 still presented with a few necro-inflammatory foci in their liver; however, these were significantly fewer in prevalence than in livers of PD1−/− mice treated with anti-CTLA-4 and AQ in the absence of anti-CCL2.
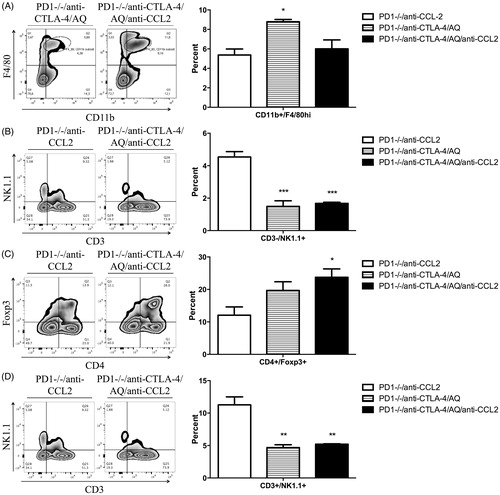
Liver immune cells were again phenotyped to better understand effects of the treatments on the immune system. PD1−/− mice treated with anti-CTLA-4 and AQ showed significantly greater percentages of liver macrophages compared to PD1−/− mice treated with anti-CTLA-4, AQ, and anti-CCL2 (). In this case, the significant changes were specifically among CD11b+/F4/80hi macrophages. This may represent macrophages brought in by inflammation; however, at this point in the evolution of the injury, the macrophages have converted to a Kupffer cell phenotype. Characteristic of the impaired immune tolerance model, PD1−/− mice treated with anti-CTLA-4 and AQ, or PD1−/− mice treated with anti-CTLA-4, AQ, and anti-CCL2 showed significantly reduced percentages of liver NK cells compared to PD1−/− mice treated with anti-CCL2 alone. There was also a significant decrease in the percentage of liver NKT cells. Finally, PD1−/− mice treated with anti-CTLA-4, AQ, and anti-CCL2 presented with significantly greater percentages of liver Treg cells compared to PD1−/− mice treated with anti-CCL2. Changes in other immune cells were not significant (Supplemental Figure 2).
Figure 6. Flow cytometry analysis of mononuclear leukocytes in liver. Representative zebra plot and average from three animals are displayed. Mononuclear cells with significant differences among the treatment groups compared to control are displayed (data not shown when difference was not significant). PD1−/− mice treated with an anti-CCL2 (PD1−/−/anti-CCL2), PD1−/− mice with anti-CTLA-4 and AQ (PD1−/−/anti-CTLA-4/AQ), PD1−/− mice with anti-CTLA-4, AQ, and anti-CCL2 (PD1−/−/anti-CTLA-4/AQ/anti-CCL2). (A) Significantly decreased percentage of F4/80hi macrophages in the PD1−/−/anti-CTLA-4/AQ/anti-CCL2 group compared to in PD1−/−/anti-CTLA-4/AQ group. (B) Significantly decreased NK cell percentages in PD1−/−/anti-CTLA-4/AQ and PD1−/−/anti-CTLA-4/AQ/anti-CCL2 groups compared to in PD1−/−/anti-CCL2 group. (C) Treg cell percentages were significantly increased in PD1−/−/anti-CTLA-4/AQ/anti-CCL2 mice vs. in the PD1−/−/anti-CCL2 mice. (D) NKT cells were significantly decreased in PD1−/−/anti-CTLA-4/AQ and PD1−/−/anti-CTLA-4/AQ/anti-CCL2 groups compared to in PD1−/−/anti-CCL2 mice. Values shown are means ± SE. One-way ANOVA. *p < 0.05, ***p < 0.001.
Discussion
There is evidence that at least some drugs that cause idiosyncratic drug reactions such as IDILI have the potential to activate macrophages in vitro (Weston and Uetrecht Citation2014; Kato and Uetrecht Citation2017). Specifically, AQ was found to activate macrophages directly or through the supernatant from a hepatocyte incubation (Kato and Uetrecht Citation2017). In order to test the involvement of macrophages in the mechanism of IDILI in vivo, CCR2 or CCL2 signaling was impaired in two models of IDILI, one representing mild IDILI and the other representing a more severe IDILI. CCR2−/− mice were used in the mild IDILI model, while anti-CCL2 antibodies were used in the more severe IDILI model.
In previous experiments, wild-type C57BL/6 mice treated with AQ alone developed delayed-onset mild liver injury that appeared to be resolving despite continued treatment (Metushi et al. Citation2015). The injury in this mild IDILI model was found to be NK cell-mediated. In the current experiments, CCR2−/− mice were used because they have been found to have significantly reduced monocyte recruitment into sites of injury, in this case the liver. Contrary to the initial hypothesis, CCR2−/− mice treated with AQ were not protected from AQ-induced liver injury (). When immune cell changes in the liver were analyzed, wild-type C57BL/6 mice treated with AQ showed the characteristic increase in percentages of liver NK cells. NK cells are the major lymphocyte of innate immunity and can induce direct cell cytotoxicity and produce pro-inflammatory cytokines (Chan et al. Citation2014). As part of the innate immune system, NK cells can be directly activated in response to stressed cells in order to maintain tissue homeostasis (Chan et al. Citation2014). If the mild AQ-induced liver injury is NK cell-mediated, this liver injury may not require an influx of monocytes; this could account for the lack of protection in CCR2−/− mice. However, the increase in NK cells associated with AQ treatment appeared to be attenuated in CCR2−/− mice even though the increase in ALT was not attenuated, though the difference in levels of NK cells between AQ and CCR2−/−/AQ was not significant.
In contrast to the mild liver injury in wild-type mice, in the impaired immune tolerance model, co-treatment with anti-CCL2 significantly decreased AQ-induced liver injury. Injury in this model is CD8 T-cell dependent (Mak and Uetrecht Citation2015b). As adaptive immune cells, CD8 T-cells require activation by the innate immune system including antigen-presenting cells and other macrophages. Immune cell phenotype findings from the impaired immune tolerance model showed a significant increase in macrophages in the liver that was prevented by treatment with anti-CCL2. Anti-CCL2 did not significantly decrease the number of CD8 T-cells in this model (Supplemental Figure 2), but it may have led to a decrease in the level of activation of AQ-specific CD8 T-cells.
Overall, the results from these experiments provide evidence that macrophage infiltration into the liver may not be significantly involved in the development of mild IDILI, but it does appear to be important in more severe IDILI. Although the sample size (N = 3) is quite small for such experiments, the pattern of liver injury is the same as we have seen in many previous experiments. There clearly is still liver injury in the CCR2−/− mice and anti-CCL2 antibodies clearly prevented significant liver injury in the PD-1−/− mice. Mild IDILI is always more common than serious IDILI, and the dominant immune response to drugs that can cause severe liver injury appears to be immune tolerance (Cho and Uetrecht Citation2016). Mild IDILI may be similar to AQ-induced liver injury in wild-type mice; however, we do not know if the injury in the impaired immune tolerance model begins with an NK cell-mediated immune response and evolves into an adaptive immune-mediated injury, or if the mechanism in the two models is different from the beginning. In any case, similar to liver injury in our impaired immune tolerance model, liver biopsies from cases of severe IDILI in humans is characterized by a mononuclear infiltrate with numerous CD8 T-cells and few NK cells (Foureau et al. Citation2015). Therefore, the results of the experiments in the impaired immune tolerance model are consistent with those in IDILI in humans and suggest that infiltrating macrophages play an important role in the pathogenesis of IDILI.
Acknowledgments
The authors would like to thank Tiffany Cho for helping with the experiments and Dr. M.A. Hayes for reviewing the histology sections.
Disclosure statement
No potential conflict of interest was reported by the authors.
Additional information
Funding
References
- Chan C, Smyth M, Martinet L. 2014. Molecular mechanisms of natural killer cell activation in response to cellular stress. Cell Death Differ. 21:5–14.
- Cho T, Uetrecht J. 2016. How reactive metabolites induce an immune response that sometimes leads to an idiosyncratic drug reaction. Chem Res Toxicol. 30:295–314.
- Dambach D, Watson L, Gray K, Durham S, Laskin D. 2002. Role of CCR2 in macrophage migration into the liver during acetaminophen-induced hepatotoxicity in the mouse. Hepatology. 35:1093–1103.
- Deshmane S, Kremlev S, Amini S, Sawaya B. 2009. Monocyte chemoattractant protein-1 (MCP-1): An overview. J Interferon Cytokine Res. 29:313–326.
- Foureau D, Walling T, Maddukuri V, Anderson W, Culbreath K, Kleiner D, Ahrens W, Jacobs C, Watkins P, Fontana R, et al. 2015. Comparative analysis of portal hepatic infiltrating leucocytes in acute drug-induced liver injury, idiopathic autoimmune and viral hepatitis. Clin Exp Immunol. 180:40–51.
- Geissmann F, Jung S, Littman D. 2003. Blood monocytes consist of two principal subsets with distinct migratory properties. Immunity. 19:71–82.
- Kato R, Uetrecht J. 2017. Supernatant from hepatocyte cultures with drugs that cause idiosyncratic liver injury activates macrophage inflammasomes. Chem Res Toxicol. 30:1327–1332.
- Mack M, Cihak J, Simonis C, Luckow B, Proudfoot AE, Plachý J, Brühl H, Frink M, Anders HJ, Vielhauer V, Pfirstinger J, Stangassinger M, Schlöndorff D. 2001. Expression and characterization of the chemokine receptors CCR2 and CCR5 in mice. J Immunol. 166:4697–4704.
- Mak A, Kato R, Weston K, Hayes A, Uetrecht J. 2018. Editor’s highlight: An impaired immune tolerance animal model distinguishes the potential of troglitazone/pioglitazone and tolcapone/entacapone to cause IDILI. Toxicol. Sci. 161:412–420.
- Mak A, Uetrecht J. 2015a. The combination of anti-CTLA-4 and PD1−/− mice unmasks the potential of isoniazid and nevirapine to cause liver injury. Chem Res Toxicol. 28:2287–2291.
- Mak A, Uetrecht J. 2015b. The role of CD8 T Cells in Amodiaquine-Induced Liver Injury in PD1-/- Mice Cotreated with Anti-CTLA-4. Chem Res Toxicol. 28:1567–1573.
- Metushi I, Cai P, Dervovic D, Liu F, Lobach A, Nakagawa T, Uetrecht J. 2015. Development of a novel mouse model of amodiaquine-induced liver injury with a delayed onset. J Immunotoxicol. 12:247–260.
- Metushi I, Hayes M, Uetrecht J. 2015. Treatment of PD-1−/− mice with amodiaquine and anti-CTLA4 leads to liver injury similar to idiosyncratic liver injury in patients. Hepatology. 61:1332–1342.
- Weston J, Uetrecht J. 2014. Activation of inflammasomes by agents causing idiosyncratic skin reactions: A possible biomarker. Chem Res Toxicol. 27:949–951.