
Abstract
Trichloroethylene (TCE) is known to induce skin disorders and multi-system dysfunction, but the mechanism of this multi-organ injury is not entirely clear. It was shown in a previous study that levels of pivotal end-products of the kallikrein-kinin system (KKS), i.e. bradykinin (BK) and BK receptors B1R/B2R, in the kidneys were increased by TCE exposure. Unfortunately, how BK and its receptors acted in the etiology of the induced renal injury is not clear. Thus, this study explored any correlation between BK receptors and immune renal injury in TCE-sensitized mice by blocking the BK receptors B1R/B2R. BALB/c mice were sensitized (via skin) by TCE, with or without pre-treatment with a B1R or B2R antagonist. Renal lesions, increased expressions of B1R, B2R, Kim-1, Lipocalin-2, and NF-κB p65 subunit on tubular epithelial cells were all observed in TCE-sensitized mice. Serum levels of creatinine (Cr), microglobulin α1 and β2, along with mRNA levels for inflammatory cytokines and NF- κB p65 in kidneys, were all increased by 72 h after a final challenge. Highly selective antagonist pre-treatment blocked B2R and significantly attenuated TCE-induced changes. Blocking B1R or B2R attenuated release of pro-inflammatory cytokines and activation of NF-κB signaling pathway (as reflected in lower up-regulation of pIκB and nuclear NF-κB p65 subunit, and down-regulation of IκB in the kidneys. These results provided evidence that TCE-sensitization caused KKS activation and enhanced the expression of B1R and B2R on tubular epithelial cells. This, in turn, accelerated NF-κB signaling pathway activation and amplified inflammatory cytokine release, which all likely contributed to TCE-induced immune renal injury.
Introduction
Trichloroethylene (TCE) is a volatile chlorinated vehicle commonly used as degreaser, chemical intermediate, and extractant in occupational settings (Bassig et al. Citation2013; Chiu et al. Citation2013). A large number of workers suffer from TCE-related adverse health effects, involving the skin, liver, and kidney, in a pathology defined as TCE hypersensitivity syndrome (THS) (Watanabe Citation2011; Zhang et al. Citation2017). Increasingly, clinical studies have classified THS as T-cell-mediated Type IV allergic reaction/delayed-type hypersensitivity (DTH); however, recent research has noted Type IV allergic reactions cannot fully explain the multi-organ injuries induced by TCE, especially the renal injury (Yu et al. Citation2017; Liu et al. Citation2018). Animal experiments revealed significant renal function impairment and increases in circulating inflammatory cytokines (e.g. tumor necrosis factor [TNF]-α, interferon (IFN)-γ, and interleukin [IL]-2) levels in TCE sensitized mice (Zhang et al. Citation2016, Citation2018). Based on findings like that, it has become more accepted that immune [regulation] dysfunction could play a vital role in renal injury caused by TCE. That would be in keeping with findings in patients occupational-exposed to TCE who were also sources of additional evidence that TCE is immunotoxic in humans (Bassig et al. Citation2013).
In a previous study, it was found that TCE exposure resulted in kallikrein-kinin system (KKS) activation, including that of bradykinin (BK) and the bradykinin receptor (B1R/B2R). Human plasma KKS proteins are related to inflammatory responses and immune disease through BK (Motta and Tersariol Citation2017). BK is released from kininogen by kallikrein, and metabolized rapidly to Des-Arg-BK (DABK) by kininase (Sang et al. Citation2016). Studies indicated the BK receptor B2R recognized BK, whereas B1R had a higher affinity for DABK (Brechter et al. Citation2008; da Costa et al. Citation2014). Under physiological conditions, constitutive B2R is widely expressed in most tissues. In a body, B2R helps mediate blood pressure, blood flow, and vascular permeability, and it is also known to reduce oxidative stress (Chao et al. Citation2010). In contrast, B1R is synthesized at very low levels under physiological conditions and over-expressed in inflammatory responses, ischemia, and trauma (Schmaier Citation2016; Motta and Tersariol Citation2017).
In the kidney, KKS proteins are mainly formed in cortical tubular plasma membranes and secreted into the tubular fluid (Hillmeister and Persson Citation2012). Indeed, several studies have suggested both B1R and B2R exert a number of actions in kidney diseases like focal segmental glomerulosclerosis (Pereira et al. Citation2014) and diabetes (Sang et al. Citation2016). Other studies showed BK and B1R/B2R were strongly up-regulated by TCE during induction of renal injury in mice (Wang et al. Citation2016). Nevertheless, the mechanism(s) underlying how BK receptors mediate renal injury in TCE-sensitized mice remains poorly defined. Hence, this study attempted to clarify mechanisms by which B1R and B2R contribute to TCE-induced renal immune injury.
Increasing evidence has revealed that B1R and B2R expression is involved in the activation of the NF-κB pathway in osteoblasts, fibroblasts, and colonic epithelial cells (Brechter et al. Citation2008; Marcon et al. Citation2013). There are five NF-κB family members in mammalian hosts, e.g. RelA/p65, RelB, c-Rel, p50/p105, and p52/p100. A hallmark of the NF-κB pathway is that it is regulated by IκB proteins. Under physiological conditions, IκB proteins in the cytoplasm inhibit NF-κB activation. However, a range of stimuli, including pathogen-derived substances (Moynagh Citation2005) are able – through IκB phosphorylation and degradation by IκK kinase (IKK) – to trigger activated NF-κB-dimer (mostly p65/p50 and p65/p65) translocation from cytoplasm to nucleus where it then binds κB sites in gene promoters. By this, gene transcription is regulated (Ghosh and Hayden Citation2012). Because as a family of inducible factors, NF-κB plays a prominent and evolutionarily conserved role in the immune system (Hayden and Ghosh Citation2014), it is plausible that BK receptors might also possibly activate NF-κB signaling pathways and so aggravate TCE-induced (immune-based) injuries in the kidneys.
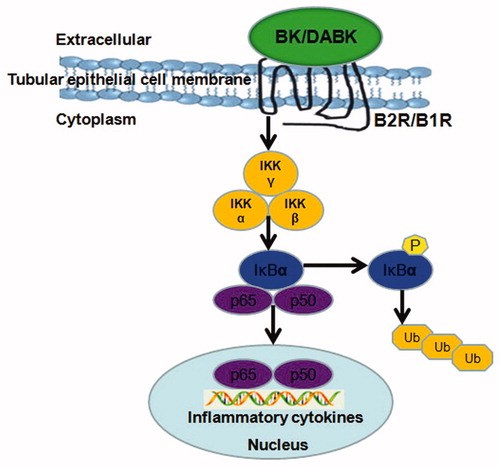
Accordingly, we hypothesized up-regulation of B1R and B2R in renal tubular epithelial cells induced NF-κB signaling pathway activation, and this in turn caused release of inflammatory cytokines to aggravate renal immune injury in TCE-sensitized mice (). To verify this, highly selective antagonists for B1R and B2R were used to evaluate relationships between BK and its receptors that were likely affecting NF-κB signaling pathway activation in the immune renal injury induced by TCE.
Figure 1. Mechanism involving bradykinin receptors and NF-κB signaling pathway. IκB: κB protein inhibitor; IKK: IκB kinase; P: phosphorylation; p65 and p50: NF-κB-dimer; Ub: ubiquitin.
Materials and methods
Animals
Healthy specific pathogen-free female BALB/c mice (6–8-week-of-age, 18–24 g) were purchased from the Experimental Animal Center of Anhui Medical University (Anhui, China). The animals were housed (six/cage) under conditions of temperature (20–25 °C) and humidity (50 ± 5%) with a 12-h light/dark cycle. All mice were provided ad libitum access to standard rodent chow and filtered water. The experimental protocol and the use of animals were approved by the Animal Care and Use Committee of Anhui Medical University.
Chemicals and reagents
The reagents and antibodies used for the experiments and their suppliers were the following: TCE and Freund’s complete adjuvant (FCA) were purchased from Sigma (St. Louis, MO); acetone and olive oil were purchased from the Shanghai Chemical Reagent Company (Shanghai, China). Antibody to phosphorlyated-IκB (pIκB), IκB, NF-κB p65, β-actin, and Lamin A/C were bought from Cell Signaling Technology (Beverley, MA) and that to cytokeratin-18 (CK-18) from Abcam (Cambridge, UK). Anti-Kim-1 and anti-Lipocalin-2 antibodies were from Bioss (Beijing, China). Chemiluminescence (ECL) detection kits were purchased from Pierce Biotechnology (Rockford, IL). Horseradish peroxidase (HRP)-conjugated goat anti-rabbit IgG and fluorescein isothiocyanate (FITC)-conjugated donkey anti-goat IgG were purchased from Santa Cruz Biotechnology (Santa Cruz, CA). R715 and HOE140 were obtained from TOCRIS bioscience (Avonmouth, Bristol, UK). ELISA kit for serum microglobulins α1 (α1 MG) and β2 (β2 MG) were bought from Elabscience Biotechnology Co. (Wuhan, China). Other materials purchased were the following: Revert Aid First Strand cDNA Synthesis Kit (ThermoScientific, Pittsburgh, PA) and a LightCycler 480 SYBR Green I Master kit (Roche, Basel, Switzerland). Immunohistochemistry kits were purchased from Zhong Shan Jin Qiao (Beijing, China). Nuclear protein extraction kits were bought from Keygen Biotech (Nanjing, China). Bicinchoninic acid (BCA) protein assay reagents were purchased from Pierce (Rockford, IL).
Treatments
A model of TCE-sensitized BALB/c mice () was induced according to Wang et al. (Citation2015). After 1 week of adaptation, all mice were randomly allocated into a blank control group, vehicle control group, TCE-treated group, TCE + B1R antagonist-treated group, or a TCE + B2R antagonist-treated group. In brief, for exposures, a 2 cm × 2 cm area of dorsal hair on each mouse was shaved before they received a subcutaneous injection (24 h later) of vehicle or B1R/B2R inhibitor and TCE. Mice in the TCE + groups were injected with 100 μl of 50% TCE (TCE: olive oil: acetone =5:2:3) and an equal volume of 50% FCA (50 μl) on Day 1. A total of 100 μl 50% TCE was then painted on the shaved area a total of three times, i.e. on Days 4, 7, and 10. A skin challenge was performed on Days 17 and 19 using 100 μl of 30% TCE (TCE: olive oil: acetone =3:2:5). In B1R/B2R antagonist-treated groups, mice received an intraperitoneal injection of R715 (1 mg/kg) (Raslan et al. Citation2010)/HOE140 (0.1 mg/kg) (Gama et al. Citation2004) before the TCE challenge on Days 17 and 19. Vehicle control mice were treated with the same proportions of vehicles (olive oil and acetone) but not TCE (Zhang et al. Citation2016).
Figure 2. Experimental schedules for induction of sensitization in BALB/c mouse.
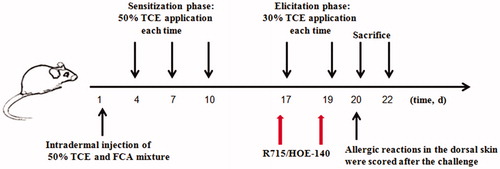
Allergic reactions in the skin were scored on a 4-point scale at 24 h after the challenge: 0 = no reaction, 1 = scattered mild redness, 2 = moderate and diffuse redness, and 3 = intensive erythema and swelling. Scores ≥1 were considered positive (+) reactions; otherwise, hosts were deemed as sensitization negative (−). On Days 20 (24 h timepoint) and 22 (72 h timepoint), mice were euthanized by cervical dislocation and blood, kidney, and other biosamples were collected according to experimental requirements. A schematic of the experimental protocol is shown in .
In the end, all mice could be categorized into the following groups: blank control (B), vehicle control (V), 24 h TCE+, 24 h TCE−, 72 h TCE+, 72 h TCE−, 24 h TCE + R715 positive (24 h B1RA+), 24 h TCE + R715 negative (24 h B1RA−), 72 h TCE + R715 positive (72 h B1RA+), 72 h TCE + R715 negative (72 h B1RA−), 24 h TCE + HOE140 positive (24 h B2RA+), 24 h TCE + HOE140 negative (24 h B2RA−), 72 h TCE + HOE140 positive (72 h B2RA+), and 72 h TCE + HOE140 negative (72 h B2RA−). The number of mice in each group is shown in .
Evaluation of kidney to body weight ratio and renal function
Wet weights of the kidneys removed at necropsy were measured and kidney:body weight ratios calculated. At each timepoint (24 and 72 h after final challenge), blood from the orbital venous plexus was collected into non-anticoagulant-coated tubes, held at 4 °C for 2 h, and then centrifuged at 3000 rpm for 15 min. The serum generated was collected and concentrations of serum urea nitrogen (BUN) and creatinine (Cr) then measured in an AU5800 automatic biochemistry analyzer (Beckman Coulter, Brea, CA). Serum α1 MG and β2 MG were assayed using a commercial ELISA kit, following manufacturer instructions. The optical density (OD) in the kit wells was read at 450 nm in a uQUANT microplate reader (BioTek, Winooski, VT). The level of sensitivity of the kit was 0.08 ng α1 MG/ml and 0.02 ng β2 MG/ml.
Pathological and immunohistochemical assessments
From the freshly isolated kidneys, representative samples were removed and placed in 10% neutral buffered formalin for 48 h and then embedded in paraffin blocks. The tissues were then sectioned to 5 μm and deparaffinized in xylene and rehydrated in ethanol with a series of concentration gradients. The sections were then stained with hematoxylin and eosin using standard protocols.
For immunohistochemistry, antigen retrieval was achieved by microwave using a sodium citrate solution (pH 6.0). The slices were then incubated with goat serum at room temperature (RT) for 15 min for non-specific antigen blockage. After quenching endogenous peroxidase (by immunohistochemistry kit), the slices were incubated in a phosphate-buffered saline (PBS, pH 7.4) solution containing monoclonal antibody against Kim-1 (1:200 dilution in PBS), Lipocalin-2 (1:100), or NF-κB p65 (1:100) at 4 °C overnight. The following day, the slices were warmed to RT, washed with PBS, and then incubated for 15 min at RT in PBS containing anti-rabbit IgG (1:1000). The sections were then stained with avidin–biotin peroxidase (DAB) substrate solution. The sections were then cover-slipped and examined using a light microscope.
Double-label immunofluorescence assays with CK18 and B1R/B2R
Other portions of the fresh tissues were immediately embedded in tissue freezing media optimum cutting temperature (OCT) compound. The kidney samples were then frozen at −20 °C, and cut into 5-μm slices using a CM1950 Frozen Slicer (Leica, Nussloch, Germany). The sections were then fixed in pre-cooled acetone for 5 min, permeabilized using 0.1% Triton X-100 (in PBS) for 15 min, and then blocked for 2 h at RT with 5% fetal bovine serum in PBS. For double-labeling, the sections were co-incubated at 4 °C overnight with rabbit anti-CK18 antibody (1:100 dilution in PBS) and goat anti-B1R/B2R antibody (1:100 in PBS). On the following day, the sections were warmed to RT, rinsed three times in PBS, then incubated for 2 h at RT in PBS containing fluorescein isothiocyanate (FITC)-conjugated secondary antibodies, i.e. a mixture of donkey anti-rabbit (red) IgG-FITC (1:200 in PBS) and anti-goat (green) IgG-FITC (1:200 in PBS). Sections were then gently washed three times with PBS and cell nuclei counter-stained with DAPI solution (4 mg/ml in deionized water) for 15 min at RT. Both CK18 and B1R/B2R expressions were evaluated and photographed using an IX73 inverted fluorescence microscope (Olympus, Tokyo, Japan) with appropriate excitation/emission filters and in-line Leica camera.
Western blot analysis for NF-κB signaling pathway protein
For Western blot analyses, ≈ 50 mg renal tissue was homogenized in 500 μl radio immunoprecipitation lysis buffer (RIPA) containing phenylmethylsulfonyl fluoride (PMSF) supplemented with a mixture of phosphatase inhibitors. Nuclear protein extraction of the tissues was performed according to a nuclear protein extraction kit protocol. Renal lysates were suspended in hypotonic buffer and then kept on ice for 15 min. The suspension was then mixed with detergent and centrifuged at 14,000 rpm for 30 s. The nuclear pellet was re-suspended in complete lysis buffer in the presence of the protease inhibitor cocktail, incubated for 30 min on ice, and then centrifuged at 14,000 rpm for 10 min. Protein concentrations in the final supernatant were determined using a bicinchoninic acid (BCA) protein assay.
Protein extracts from the samples from each mouse (containing equal amounts 25 μg/lane) were electrophoretically separated over discontinuous 5% and 12.5% acrylamide gradients, and the resolved proteins were then electrotransferred onto PVDF membranes. The membranes were blocked with 5% non-fat powdered milk in Dulbecco’s PBS (DPBS) for 2 h at RT and then incubated overnight at 4 °C in PBS containing monoclonal antibody against pIκB (1:1000 dilution in PBS), IκB (1:1000 in PBS), NF-κB p65 (1:1000 in PBS), Lamin A/C (1:1000 in PBS), or against β-actin (1:2000 in PBS). The Lamin A/C was used to normalized for nuclear protein and β-actin for total protein (). On the following day, the membranes were washed three times with DPBS containing 0.05% Tween-20, and then incubated with a solution of 5% non-fat powdered milk in DPBS containing horseradish peroxidase (HRP)-conjugated goat anti-rabbit IgG (1:10,000) antibody for 2 h at RT. After a gentle rinsing with DPBS, immune-reactive bands were developed using an enhanced chemiluminescence (ECL) detection kit and evaluated in a chemiluminescence system (Pierce Biotechnology, Rockford, IL). The densitometric value of each signal was analyzed using Image-Pro software v.6.0 (Media Cybernetics, Rockville, MD).
Quantitative real-time PCR measurement for inflammatory cytokines and NF-κB p65
Expression of genes for inflammatory cytokines IL-1β, TNFα, and IL-17 and for NF-κB p65 in kidney tissues was quantified using real-time quantitative PCR (RT-PCR). In brief, a small piece of the harvested kidneys underwent total RNA extracting using Trizol reagent (Thermo Scientific, Pittsburgh, PA), according to manufacturer protocols. Subsequently, cDNA was synthesized using a RevertAid First Strand cDNA Synthesis Kit and then amplified/quantified by PCR in a Light Cycler 480 system (Roche, Basel, Switzerland) using primer sequences shown in . The amplification program was 95 °C for 10 min (initial denaturation), followed by 45 cycles, including 95 °C for 15 s, 60 °C for 15 s, and 72 °C for 20 s. Levels of target genes were calculated using the 2−ΔΔCt method. Calculation of fold-change in mRNA for each examined cytokine and NF-κB p65 were normalized to measures of levels of the GAPDH housekeeping gene.
Table 1. PCR primer pairs used in the study.
Statistical analysis
All data were expressed as means ± SD unless otherwise indicated. One-way analysis of variance (ANOVA) followed by a post-hoc least-significant (LSD) test (equal variances) or Dunnett test (unequal variances) was employed to compare differences between groups. A Chi-square test was used to analyze differences between percentages (sensitization rates). A p value of <0.05 was considered statistically significant. All statistical analyses were performed using SPSS 11.0 software (SPSS, Chicago, IL).
Results
Sensitization rates
At 24 h after the final challenge, no mice in the blank control or vehicle control groups exhibited erythema and edema. On the other hand, the results showed sensitization rates of 44.3% (31/70 mice) in the TCE group, 40.5% (15/37 mice) in the B1RA pretreated and 34.0% (18/53 mice) in the B2RA pretreated groups (). Sensitization rates did not differ between the B1RA pre-treatment and the TCE group nor between the B2RA-pretreated and the TCE group. Moreover, there was no significant difference between rates in the B1RA and the B2RA-pretreated group. The overall sensitization rate was 40.0%.
Table 2. Sensitization rates and scores.
B1R and B2R expression on renal tubules of TCE-sensitized mice
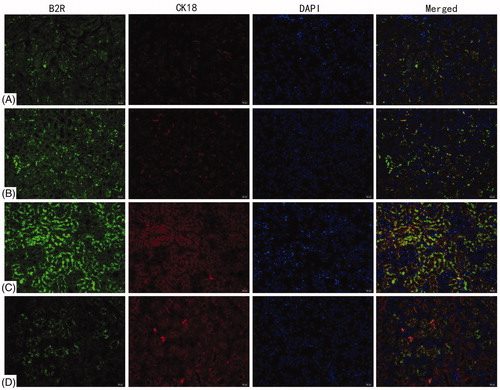
B1R and B2R expression on renal tubules was evaluated by double label immunofluorescence with CK18. The analyses found that B1R and B2R were mainly expressed on tubular epithelial cells in the kidneys. There was no significant difference in B1R and B2R levels between the blank control and vehicle control groups ( and ). Compared with the blank control, B1R and B2R expression increased significantly in the 72 h TCE+ mice.
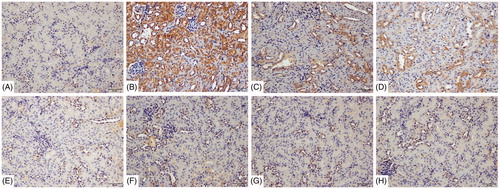
Figure 3. Deposition of B1R on renal tubules. B1R detected by double immunofluorescence staining with CK18. (A) Blank control, (B) vehicle control, (C) 72 h TCE+, and (D) 72 h TCE− group. Magnification =400×. Representative photos are shown.
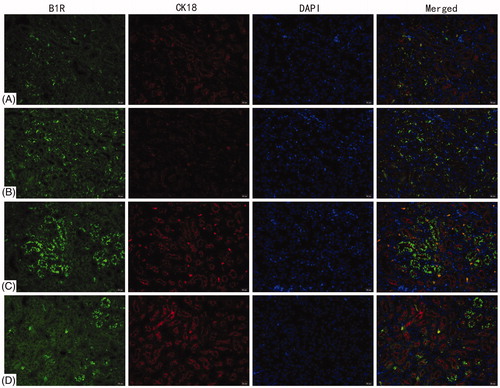
Figure 4. Deposition of B2R on renal tubules. B1R detected by double immunofluorescence staining with CK18. (A) Blank control, (B) vehicle control, (C) 72 h TCE+, and (D) 72 h TCE− group. Magnification =400×. Representative photos are shown.
Pathological changes in kidneys and alterations in kidney:body weight ratios
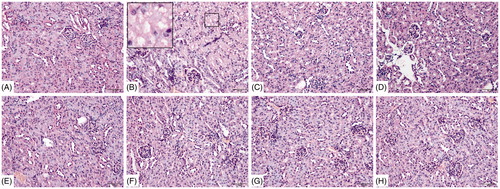
Analyses of tissue samples collected 72 h after the final challenge indicated pathological changes in renal tissue (). There were no significant histomorphological changes in the renal tissues from the blank control, vehicle control, and negative groups. In comparison, among the TCE+ mice, cell swelling, loss of brush border of proximal tubular epithelial cells, cell necrosis, interstitial edema, and tubular lumen obstruction were clearly evident. Compared with these TCE+ mice, damage was significantly attenuated in the 72 h B1RA+ and B2RA+ hosts.
Figure 5. Renal histopathology. (A) Blank control, (B) 72 h TCE+, (C) 72 h B1RA+, (D) 72 h B2RA+, (E) vehicle control, (F) 72 h TCE−, (G) 72 h B1RA− group, and (H) 72 h B2RA− group. Magnification =200×. H&E staining. Representative photos are shown.
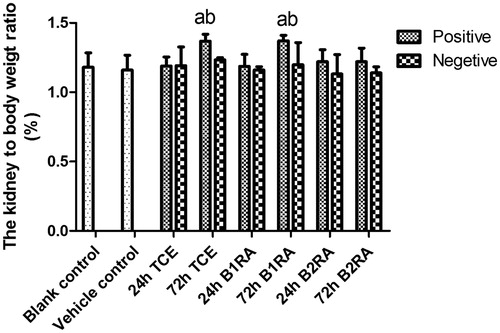
Measures of kidney:body weight ratio were also performed in each group (). The data indicated that the ratio increased significantly compared with that in the vehicle control group in the 72 h TCE+ and 72 h B1RA+ groups. However, this did not occur among the 72 h B2RA+ mice.
Figure 6. Kidney to body weight ratio. Value significantly different versus avehicle control, bcorresponding TCE sensitization negative group (each p < 0.05) (n = 82).
Renal function
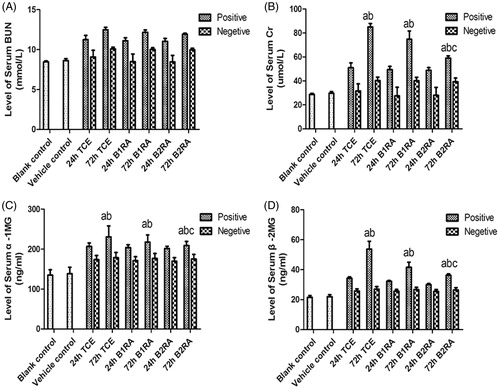
Serum BUN levels did not significantly differ among any of the test groups. There was no significant difference between vehicle control and blank control serum Cr levels (), but these levels gradually increased (through 24 h) and significantly peaked at 72 h in the TCE+ mice. In contrast, among the B2RA+ mice, serum Cr levels were significantly lower than in 72 h TCE+ counterparts. There were no significant difference between B1RA+ and TCE+ mice at either timepoint. Levels of serum α1 MG and β2 MG displayed the same trends as for serum Cr among the various groups.
Figure 7. Serum BUN, Cr, α1 MG and β2 MG levels. Value significantly different versus avehicle control, bcorresponding TCE sensitization negative group, or ccorresponding TCE sensitization positive group (each p < 0.05) (n = 87/87/70/64).
Inflammatory injury in renal tubules
Using immunohistochemical analyses, tubular injury was assessed by examining Kim-1 and Lipocalin-2 deposition in tubular epithelial cells. There was no visible Kim-1 and lipocalin-2 deposition in the cells from the blank control and vehicle control mice ( and ). In comparison, deposition of each protein was significantly greater in samples from the 72 h TCE+ mice. Expressions of each were significantly lowered in the B1RA+ and B2RA+ mice than their TCE+ counterparts. There were no significant differences in expression of either protein between the TCE-, B1RA-, and B2RA-hosts.
Figure 8. Deposition of Kim-1 on renal tubules. Kim-1 detected by IHC/DAB kit. (A) Blank control, (B) 72 h TCE+, (C) 72 h B1RA+, (D) 72 h B2RA+, (E) vehicle control, (F) 72 hr TCE−, (G) 72 h B1RA−, and (H) 72 h B2RA− group. Magnification =200×. Representative photos are shown.
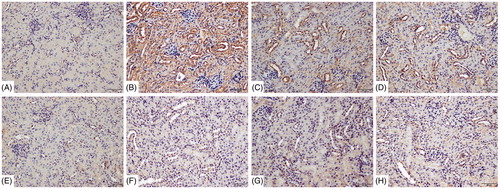
Figure 9. Deposition of Lipocalin-2 on renal tubules using immunohistochemistry detected with DAB kit. (A) Blank control, (B) 72 h TCE+, (C) 72 h B1RA+, (D) 72 h B2RA+, (E) vehicle control, (F) 72 h TCE−, (G) 72 h B1RA−, and (H) 72 h B2RA− group. Magnification =200×. Representative photos are shown.
B1RA and B2RA inhibit TCE induced renal NF-κB signaling pathway activation
Nuclear NF-κB p65 translocation, mainly observed in nuclei of renal tubular epithelia cells, was increased from control mice levels in the 72 h TCE+ mice (). B1RA and B2RA pre-treatment attenuated this TCE-induced translocation. At 72 h after final challenge, effects of B1RA and B2RA pre-treatment on TCE-induced renal NF-κB signaling activation were also analyzed (). Renal p-IκB levels markedly increased and IκB significantly decreased in 72 h TCE+ mice compared with levels in vehicle control mice. Moreover, the levels of nuclear NF-κB p65 subunits in the kidneys were significantly elevated in 72 h TCE+ mice. TCE could evoke renal NF-κB p65 subunit to move from the cytoplasm to the nucleus, indicating renal NF-κB signaling pathway activity was elevated in TCE+ mice. In contrast, B1RA and B2RA pre-treatments attenuated TCE-induced IκB phosphorylation and inhibited the reduction in renal IκBα levels caused by TCE. Even so, there was no significant difference between the B1RA+ and B2RA+ groups. In addition, B1RA and B2RA pre-treatment significantly inhibited TCE-induced translocation of the nuclear NF-κB p65 subunit. It was note-worthy that there existed significant differences between the two antagonist groups. These data indicated TCE sensitization caused increased expression of proteins associated with the NF-κB signaling pathway and that pre-treatment with B1RA and B2RA attenuated the induced NF-κB signaling activation.
Figure 10. Deposition of NF-κB p65 on renal tubules using immunohistochemistry detected with DAB kit. (A) Blank control, (B) 72 h TCE+, (C) 72 h B1RA+, (D) 72 h B2RA+, (E) vehicle control, (F) 72 h TCE−, (G) 72 h B1RA−, and (H) 72 h B2RA− group. Magnification =200×. Representative photos are shown.
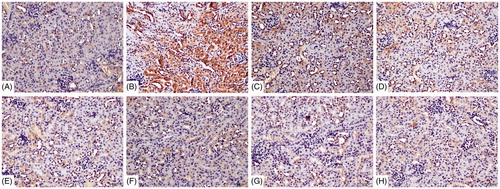
Figure 11. Effect of B1RA and B2RA on TCE-induced activated NF-κB signaling pathway (renal). (A) p-IκB (upper panel), IκB (middle) and β-actin (lower panel) are shown. (B) p-IκB/β-actin. (C) IκB/β-actin. (D) Renal nuclear NF-κB p65 subunit. (E) Nuclear protein p65/Lamin A/C. (F) NF-κB p65 mRNA. Results – normalized by arbitrarily setting densitometry – are expressed as means ± SD (n = 3) Value significantly different versus avehicle control, bcorresponding TCE sensitization negative group, or ccorresponding TCE sensitization positive group (each p < 0.05).
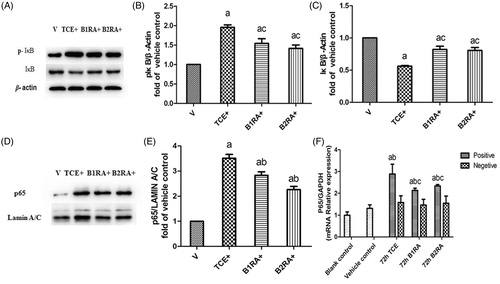
Meanwhile, there was no significant difference in NF-κB p65 mRNA expression between the blank and vehicle control groups (). As expected, compared with the vehicle control, renal NF-κB p65 mRNA levels were increased in 72 h TCE+ and B1RA+ and B2RA+ mice, although the latter pre-treatments each attenuated the overall TCE-induced up-regulation of NF-κB p65 mRNA. Nevertheless, at 72 h, there was no significant difference between the B1RA+ and the B2RA+ group renal NF-κB p65 mRNA levels.
Inflammatory IL-1β, TNFα, and IL-17 mRNA levels in kidney
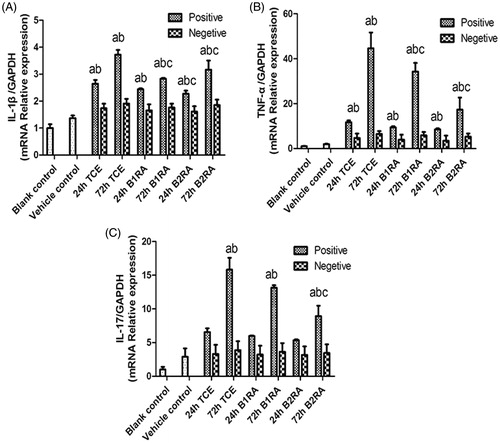
Real-time qRT-PCR assays were performed to assess mRNA levels of pro-inflammatory cytokines in the renal tissues. The level of all evaluated cytokines increased significantly vs. control mice values in the 72 h TCE+ mice (). It was also seen that pre-treatment with B1RA/B2RA effectively down-regulated the expression of IL-1β mRNA compared with those in the 72 h TCE+ mice. TNFα mRNA levels were also markedly decreased in the two antagonist pre-treatment groups as compared with in the TCE+ hosts. Only pre-treatment with B2RA significantly decreased IL-17 mRNA levels in 72 h TCE+ mice. Further, only B2RA pre-treatment caused significant reductions in IL-1β mRNA levels compared with levels in the 24 h TCE+ mice.
Figure 12. IL-1β, TNFα, and IL-17 gene expression in kidney. Value significantly different versus avehicle control, bcorresponding TCE-sensitization negative group, or ccorresponding TCE sensitization-positive group (each p < 0.05) (n = 52/48/48).
Discussion
The number of workers exposed to TCE has been increasing in developing countries in Asia (Bassig et al. Citation2013). These TCE induced skin disorders and multi-system dysfunction are categorized as “occupational medicamentosa-like dermatitis of TCE” (OMLDT) according to Chinese National Diagnostic Criteria, and its immunotoxicity has drawn increasing attention (Wang et al. Citation2016; Yu et al. Citation2017). In animal experiments, TCE sensitized mice to display increases in serum BUN and Cr, outcomes accompanied by increasing levels of glomerular pathological damage (Zhang et al. Citation2016). In the current study, a systematic study was performed and found significant tubular epithelial cell swelling and vacuolar degeneration. These findings were consistent with previous transmission electron microscopic observations that noted tubular epithelial cell mitochondrial swelling, microvillus atrophy, and cell apoptosis due to TCE treatments. Significant increases observed in α1 MG and β2 MG levels in serum and urine also indicated renal tubule function was impaired (Yu et al. Citation2012). Lastly, a presence of Kim-1 and Lipocalin-2, two key indicators of acute renal injury/damage to tubular epithelium cells (Kwon et al. Citation2013; Abella et al. Citation2015), was markedly increased in TCE-sensitized mice in the current study. Such findings provided more evidence to support the conclusion that TCE-induced renal injury not only occurred in the glomerulus, but was evident and also more severe in the renal tubules. Even so, the immunotoxic mechanisms underlying such renal injury – especially to tubular cells – are still not clearly defined.
The present study also reflected how if B1R/B2R was increased, this was accompanied by renal dysfunction/pathological damage in TCE-sensitized mice. Once again, however, defined mechanisms for how B1R and B2R contribute to TCE-induced immune renal injury remain unclear. The broad spectrum of KKS action are mediated by B1R and B2R, which have been classified as trans-membrane G protein-coupled receptors (GPCR) (da Costa et al. Citation2014). These two receptors are expressed not only on structural cells but on inflammatory cells (Ricciardolo et al. Citation2016). Using double immunofluorescence staining with CK-18 (specifically expressed in renal epithelial cells), the present study showed B1R and B2R were mainly expressed on tubular epithelial cells (Djudjaj et al. Citation2016). The present study also showed that highly selective antagonists against B1R and B2R exerted protective (albeit not completely mitigative) effects against TCE-induced renal injury. Most of these effects were similar to those noted in studies of experimental focal segmental glomerulosclerosis (Pereira et al. Citation2014) and renal ischemia/re-perfusion injury (Kakoki et al. Citation2007). Still, the current results also conflict with findings of some previous studies. For example, Sang et al. (Citation2016) indicated there were opposite effects of antagonists against B1R and B2R in experimental diabetic rats. Such contradictory results in the different studies reflect upon the complicated functions of B1R and B2R and their impact on the kidneys.
To our knowledge, this study has provided the first evidence of how two BK receptors were likely involved in TCE-mediated renal tubular injury. Previous data suggested that B2R may have mediated many of the acute effects of kinins, while B1R was more responsible for chronic responses in inflammation. Ongoing research has shown that each does not always act alone, and that there are interactions between the two BK receptors. Despite its physiological role, B2R can also induce the activation of proinflammatory and pro-fibrotic cascades, which can in turn induce tissue damage and increase the expression of both B1R and B2R receptors (Pan et al. Citation1996). B1R may also play a compensatory role for any lack of B2R (Couture et al. Citation2014); simultaneously, up-regulation of B2R expression can lead to heterodimerization with inducible B1R in some cases. Other studies have shown B2R expression is up-regulated in B1R knockout mice (Seguin et al. Citation2008) and B1R is up-regulated in B2R knockout mice (Pereira et al., Citation2014). These in-depth findings extend previous literature data about KKS activation and BK receptors expression in TCE-induced renal injury (immune-mediated). However, it also allows for one to raise a new question, i.e. what pathway was involved in leading to the immune response and inflammatory injury after BK/DABK binds to their B2R/B1R receptor in renal tubular epithelial cells?
Research has shown B1R itself is able to induce its own expression through the NF-κB pathway, resulting in the elevation of IL-1β and TNFα synthesis (Marcon et al. Citation2013). Another study indicated that B2R expression could be increased in tandem with increased in NF-κB expression (Ricciardolo et al. Citation2016). Thus, it would be important to ascertain if TCE activates the NF-κB signal pathway as part of any induced renal injury and if this could also be mediated by BK receptors. As expected, the current study showed that a blockade of B1R and B2R attenuated the changes in NF-κB p65 mRNA levels and nuclear NF-κB p65 translocation in tubular epithelial cells that had been induced by TCE sensitization. Specifically, B1RA and B2RA pre-treatments significantly decreased TCE-induced IκB phosphorylation and nuclear NF-κB p65 subunit translocation. Together, these findings provided evidence that NF-κB signaling pathway was activated in TCE-induced renal injury (immune-mediated).
Interestingly, the effects noted above were attenuated by the highly selective antagonists against B1R (R715) and B2R (HOE140). When analyses of NF-κB regulation of almost 500 different genes, including cytokines such as IL-1β, IL-6, and TNFα (Shih et al. Citation2015) was undertaken, the study here showed that mRNA levels of IL-1β and TNFα were increased by TCE sensitization and attenuated by both R715 and HOE140. Of note, however, compared with the 72 h TCE+ mice, levels of IL-17 mRNA were decreased only by HOE 140.
Studies have also indicated that B2R activation promotes expression of select chemokines (i.e. CCL2, CCL5) and inflammatory TNFα (dos Santos et al. Citation2008). When B1R expression is up-regulated, this strengthens the inflammatory response and induces release of cytokines including IL-6, vascular endothelial growth factor (VEGF), and transforming growth factor (TGF)-β secondary to activation of the NF-κB pathway (Pan et al. Citation1996; Tang et al. Citation2010). These (and other) cytokines/growth factors play important roles in regulating TCE-induced immune-mediated injury and inflammatory processes (Bassig et al. Citation2013). These findings lend support to our hypothesis that B1R and B2R – through activation of NF-κB signaling pathways – can help amplify the release of pro-inflammatory cytokines and so aggravate any already extant TCE-induced renal injury in mice.
Conclusions
In summary, the data here suggested to us that there was renal tubular epithelium cell damage in TCE-sensitized mice that shed light on the excessive activation of KKS, especially B1R and B2R, and in part via NF-κB signaling pathway activation. This latter activation caused release of inflammatory cytokines that further aggravated TCE-induced immune injury. This work adds important information for a better understanding about the complicated mechanisms underlying TCE-induced renal injury. Based on the data here concerning a likely role for BK receptors during different stages of TCE-induced immune renal injury, we hope to perform more studies to ultimately define more clearly the mechanisms of toxicity in the kidney. From that, more effective therapeutic approaches to treating/mitigating TCE-induced renal injury could then follow on.
Disclosure statement
The authors declare no conflicts of interest. The authors alone are responsible for the content of this manuscript.
Additional information
Funding
References
- Abella V, Scotece M, Conde J, Gomez R, Lois A, Pino J, Gómez-Reino JJ, Lago F, Mobasheri A, Gualillo O. 2015. The potential of lipocalin-2/NGAL as biomarker for inflammatory and metabolic diseases. Biomarkers. 20:565–571.
- Bassig B, Zhang L, Tang X, Vermeulen R, Shen M, Smith M, Qiu C, Ge Y, Ji Z, Reiss B, et al. 2013. Occupational exposure to trichloroethylene and serum concentrations of IL-6, IL-10, and TNF-α. Environ Mol Mutagen. 54:450–454.
- Brechter A, Persson E, Lundgren I, Lerner U. 2008. Kinin B1 and B2 receptor expression in osteoblasts and fibroblasts is enhanced by IL-1 and TNF-α. Effects dependent on activation of NF-κB and MAP kinases . Bone. 43:72–83.
- Chao J, Shen B, Gao L, Xia C, Bledsoe G, Chao L. 2010. Tissue kallikrein in cardiovascular, cerebrovascular and renal diseases and skin wound healing. Biol Chem. 391:345–355.
- Chiu W, Jinot J, Scott C, Makris S, Cooper G, Dzubow R, Bale A, Evans M, Guyton K, Keshava N, et al. 2013. Human health effects of trichloroethylene: Key findings and scientific issues. Environ Health Perspect. 121:303–311.
- Couture R, Blaes N, Girolami J. 2014. Kinin receptors in vascular biology and pathology. Curr Vasc Pharmacol. 12:223–248.
- da Costa P, Sirois P, Tannock I, Chammas R. 2014. The role of kinin receptors in cancer and therapeutic opportunities. Cancer Lett. 345:27–38.
- Djudjaj S, Papasotiriou M, Bülow R, Wagnerova A, Lindenmeyer M, Cohen C, Strnad P, Goumenos D, Floege J, Boor P. 2016. Keratins are novel markers of renal epithelial cell injury. Kidney Int. 89:792–808.
- Dos Santos A, Roffê E, Arantes R, Juliano L, Pesquero J, Pesquero J, Bader M, Teixeira M, Carvalho-Tavares J. 2008. Kinin B2 receptor regulates chemokines CCL2 and CCL5 expression and modulates leukocyte recruitment and pathology in experimental autoimmune encephalomyelitis (EAE) in mice. J Neuroinflamm. 5:49.
- Gama R, Jancar S, Steil A, Sirois P. 2004. Modulation of allergic and immune complex-induced lung inflammation by bradykinin receptor antagonists. Inflamm Res. 53:78–83.
- Ghosh S, Hayden M. 2012. Celebrating 25 years of NF-κB research. Immunol Rev. 246:5–13.
- Hayden M, Ghosh S. 2014. Regulation of NF-κB by TNF family cytokines . Semin. Immunol. 26:253–266.
- Hillmeister P, Persson P. 2012. The Kallikrein-Kinin system. Acta Physiol (Oxf). 206:215–219.
- Kakoki M, McGarrah R, Kim H, Smithies O. 2007. Bradykinin B1 and B2 receptors both have protective roles in renal ischemia/reperfusion injury. Proc Natl Acad Sci U S A. 104:7576–7581.
- Kwon S, Park M, Jeon J, Noh H, Choi S, Kim J, Hwang S, Jin S, Han D. 2013. KIM-1 expression predicts renal outcomes in IgA nephropathy. Clin Exp Nephrol. 17:359–364.
- Liu M, Wang H, Zhang J, Yang X, Li B, Wu C, Zhu Q. 2018. NF-κB signaling pathway-enhanced complement activation mediates renal injury in trichloroethylene-sensitized mice. J Immunotoxicol. 15:63–72.
- Marcon R, Claudino R, Dutra R, Bento A, Schmidt E, Bouzon Z, Sordi R, Morais R, Pesquero J, Calixto J. 2013. Exacerbation of DSS-induced colitis in mice lacking kinin B(1) receptors through compensatory up-regulation of kinin B(2) receptors: The role of tight junctions and intestinal homeostasis. Br J Pharmacol. 168:389–402.
- Motta G, Tersariol I. 2017. Modulation of the plasma Kallikrein-Kinin system proteins performed by heparan sulfate proteoglycans. Front Physiol. 8:481.
- Moynagh P. 2005. The NF-κB pathway. J Cell Sci. 118:4589–4592.
- Pan Z, Zuraw B, Lung C, Prossnitz E, Browning D, Ye R. 1996. Bradykinin stimulates NF-κB activation and interleukin 1beta gene expression in cultured human fibroblasts. J Clin Invest. 98:2042–2049.
- Pereira R, Felizardo R, Cenedeze M, Hiyane M, Bassi E, Amano M, Origassa C, Silva R, Aguiar C, Carneiro S, et al. 2014. Balance between the two kinin receptors in the progression of experimental focal and segmental glomerulosclerosis in mice. Dis Model Mech. 7:701–710.
- Raslan F, Schwarz T, Meuth S, Austinat M, Bader M, Renné T, Roosen K, Stoll G, Sirén A, Kleinschnitz C. 2010. Inhibition of bradykinin receptor B1 protects mice from focal brain injury by reducing blood-brain barrier leakage and inflammation. J Cereb Blood Flow Metab. 30:1477–1486.
- Ricciardolo F, Petecchia L, Sorbello V, Di Stefano A, Usai C, Massaglia G, Gnemmi I, Mognetti B, Hiemstra P, Sterk P, et al. 2016. Bradykinin B2 receptor expression in the bronchial mucosa of allergic asthmatics: role of NF-κB. Clin Exp Allergy. 46:428–438.
- Sang H, Liu L, Wang L, Qiu Z, Li M, Yu L, Zhang H, Shi R, Yu S, Guo R, et al. 2016. Opposite roles of bradykinin B1 and B2 receptors during cerebral ischaemia-reperfusion injury in experimental diabetic rats. Eur J Neurosci. 43:53–65.
- Schmaier A. 2016. The contact activation and kallikrein/kinin systems: pathophysiologic and physiologic activities. J Thromb Hemost. 14:28–39.
- Seguin T, Buleon M, Destrube M, Ranera MT, Couture R, Girolami J, Tack I. 2008. Hemodynamic and renal involvement of B1 and B2 kinin receptors during the acute phase of endotoxin shock in mice. Int Immunopharmacol. 8:217–221.
- Shih R, Wang C, Yang C. 2015. NF-κB signaling pathways in neurological inflammation: A mini review. Front Mol Neurosci. 8:77.
- Tang S, Chan L, Leung J, Cheng A, Chan K, Lan H, Lai K. 2010. Bradykinin and high glucose promote renal tubular inflammation. Nephrol Dial Transplant. 25:698–710.
- Wang H, Zhang J, Li S, Wang F, Zha W, Shen T, Wu C, Zhu Q. 2015. An animal model of trichloroethylene-induced skin sensitization in BALB/c mice. Int J Toxicol. 34:442–453.
- Wang H, Zhang J, Ye LP, Li S, Wang F, Zha W, Shen T, Wu C, Zhu Q. 2016. Plasma Kallikrein-Kinin system mediates immune-mediated renal injury in trichloroethylene-sensitized mice. J Immunotoxicol. 13:567–579.
- Watanabe H. 2011. Hypersensitivity syndrome due to trichloroethylene exposure: A severe generalized skin reaction resembling drug-induced hypersensitivity syndrome. J Dermatol. 38:229–235.
- Yu J, Feng Y, Shen X. 2017. Potential immunotoxic effects of trichloroethylene-induced Type IV allergic reaction in renal impairment. Cent Eur J Immunol. 2:140–149.
- Yu J, Leng J, Shen T, Zhou C, Xu H, Jiang T, Xu S, Zhu Q. 2012. Possible role of complement activation in renal impairment in trichloroethylene-sensitized guinea pigs. Toxicology. 302:172–178.
- Zhang J, Li N, Wang H, Shen T, Zhu Q. 2017. The immune response in trichloroethylene hypersensitivity syndrome: A review. Toxicol Ind Health. 33:876–883.
- Zhang J, Li N, Yang L, Zang D, Yang P, Wang H, Shen T, Zhu Q. 2018. Role of selective blocking of bradykinin B1 receptor in attenuating immune liver injury in trichloroethylene-sensitized mice. Cytokine. 108:71–81.
- Zhang J, Zha W, Ye L, Wang F, Wang H, Shen T, Wu C, Zhu Q. 2016. Complement C5a-C5aR interaction enhances MAPK signaling pathway activities to mediate renal injury in trichloroethylene-sensitized BALB/c mice. J Appl Toxicol. 36:271–284.