
Abstract
Silver nanoparticles (AgNP) are one of the most studied nanoparticles due to their anti-bacterial, -fungal, -viral, -parasitic, and -inflammatory properties. This raises the need to evaluate the toxicity and biological effects of AgNP in the immune system in order to develop new safer biomedical products. In this study, an AgNP formulation currently approved for veterinary applications was applied to mouse bone marrow-derived dendritic cells (BMDC), considered important antigen-presenting cells of the immune system, to evaluate cytotoxicity, genotoxicity, and any significant influence on expression of cellular markers associated with BMDC phenotype and maturation status. The results showed that after 12 h of AgNP exposure, a significant decrease in BMDC viability occurred at the highest concentration tested (1.0 µg AgNP/ml) and at lower doses, the cells maintained membrane integrity and metabolic activity. DNA damage was not significant with any AgNP level aside from the 1.0 µg AgNP/ml level. Regarding phenotype, no differences in expression of CD40 (co-stimulatory molecule highly present in mature BMDC) or in CD273 (a marker for inhibitory T-cell response) were observed. The current results showed that the toxicity of this AgNP formulation was dose-related. The findings also suggest BMDC could maintain structural conservation of co-stimulatory/co-inhibitory surface molecules after 12 h of exposure to this AgNP. This work represents the first step in identifying the toxic effects of this AgNP formulation on dendritic cells.
Introduction
Nanotechnology innovations are revolutionizing medicine by offering new approaches in disease treatment and diagnostics, as well as in drug delivery (Dube et al. Citation2014; Aziz et al. Citation2017). With increasing demand for novel therapeutics, diagnostics, and drug delivery systems, silver nanoparticles (AgNP) have become one of the most studied classes of nanoparticles (NP) due in great part to their known capacity to act as bactericides, fungicides, viricides, drug-carriers, etc. (Ge et al. Citation2014). Nevertheless, the toxic effects of many AgNP could still severely limit their utility (Asharani et al. Citation2008; van der Zande et al. Citation2012). It has been noted that AgNP may cause cyto-/genotoxicity by inducing oxidative stress, which in turn could produce changes in cell membrane integrity as well as enhance the formation of DNA strand breaks and chromosomal abnormalities (AshaRani et al. Citation2008; Zhang et al. Citation2014). Many of the variations in the toxic potentials of AgNP ultimately depend on key physicochemical properties like size, shape, surface coating, charge, solubility, etc. Considering that many of these factors can be fine-tuned, different AgNP formulations should not be considered to possess the same toxic attributes, as they could clearly act in completely different manners (Zhang et al. Citation2016; Riaz Ahmed et al. Citation2017).
It seems probable that upon treatment/exposure of a host with AgNP, the particles might first come into contact with resident innate immune cells, i.e. dendritic cells (DC) or macrophages, the sentinels of the immune system (Klippstein et al. Citation2010; Ahlberg et al. Citation2014; Jiao et al. Citation2014). As DC are professional antigen-presenting cells (APC), they also are important potential targets for immunomodulation due to their roles in sensing environmental antigens and priming adaptive antigen-specific immune responses or inducing self-tolerance (Steinman and Banchereau Citation2007). In this regard, there are scarce studies that focus on the interaction between AgNP and DC, and even fewer studies pertaining to inducible phenotypic changes in these cells. Other studies have shown that certain nanomaterials could induce phenotypic changes in DC, including alterations in the expression of cell surface markers related to their function as APC cells and for the activation of naïve T-cells. For instance, Koike et al. (Citation2008) showed that carbon black NP promoted an increase in MHC Class II molecule and CD86 in murine bone-marrow dendritic cells (BMDC). Exposure to silica NP induced an increase in CD86 expression levels on BMDC (Kang and Lim Citation2012). Regarding AgNP, these same authors showed activation of intracellular signal transduction pathways induced through reactive oxygen species (ROS) generation in a DC2.4 murine DC line. It was explained that these outcomes may be related to phenotypic changes associated with cell maturation and subsequent induction of T-cell-dependent immunity (Kang et al. Citation2012).
To increase knowledge about potential toxicologic effects and phenotypic changes related to BMDC maturation that could be mediated by a commercially-available AgNP formulation (Argovit®, currently approved for veterinary and cosmetics applications in Russia [Borrego et al. Citation2016; Vazquez-Muñoz et al. Citation2017]), the present study was undertaken. Here, the toxicity of this formulation upon BMDC was evaluated through measures of cytotoxicity, genotoxicity, and effects on the expression of some surface markers related to DC immunophenotype and maturation.
Material and Methods
Chemicals
Bacterial lipopolysaccharide (LPS; Type 055:B5 from Escherichia coli), fluorescein-diacetate (FDA), acetone, ethidium bromide (EtBr), low-melting-point agarose, regular agarose, TRIS · HCl, ethylenediaminetetraacetic acid (EDTA), Triton X-100, dimethyl sulfoxide (DMSO), methyl methanesulfonate (MMS), and absolute ethanol were purchased from Sigma (St. Louis, MO). Calcein Live/Dead® assay kits were obtained from Molecular Probes (ThermoFisher Scientific, Waltham, MA). For cell cultures, RPMI 1640, fetal bovine serum (FBS), penicillin, streptomycin, L-glutamine, and trypsin were purchased from GIBCO (Thermo Fisher). Apoptosis Annexin V kits and monoclonal antibodies against mouse: MHC Class II (fluorescein isothiocyanate [FITC] conjugate); CD11c (allophycocyanin [APC] conjugate); CD40-biotin conjugate; CD273-biotin conjugate; and, streptavidin (phycoerythrin (PE) conjugate) for use in flow cytometry, were purchased from BD Pharmigen (San Diego, CA). Chinese hamster ovary (CHO) cells transfected with a granulocyte-macrophage growth factor (GM-CSF) gene were a gracious gift from Dr. Andres Castell (School of Medicine, UNAM, Mexico City).
The AgNP (formulated as the commercial product Argovit®) was bought from Scientific Production Centre Vektor Vita (Novosibirsk, Russia). This is a commercial product with sanitary certificates in Russia and has been approved for application in humans/animals by the Federal Service for Veterinary and Phytosanitary Surveillance of the Russian Federation Ministry of Agriculture (Borrego et al. Citation2016). The dose level used on humans/animals for oral administration in Russia depends on the application, but it is never >3.4 mg/kg (as metallic silver content of Argovit). This recommended dose is suggested by the manufacturer (http://vector-vita.com/ company.html).
According to the manufacturer, Argovit is a preparation of 20% AgNP stabilized (i.e. surface-coated by low-weight polyvinylpyrrolidone [PVP]) in water that contains spheroid particles with an average diameter of 35 mm. Juarez-Moreno et al. (2016) published a complete physicochemical characterization of this formulation. Fresh Argovit solutions were prepared before each experiment in RPMI 1640 (without FBS) and kept at 4 °C protected from light and shaking. These steps were taken because in general, silver compounds are light-sensitive and light can influence dissolution processes (Zhou et al. Citation2016); shaking has been shown to contribute to nanoparticle aggregation (according to manufacturer).
Primary culture and differentiation of BMDC
Bone marrow (BM) cells were obtained from ten C57BL/6 mice (male, 6-wk-old) in a colony at the UNAM School of Medicine (Mexico City). Mice were euthanized by cervical dislocation and then, BM was extracted according to the methods described in Inaba et al. (Citation1992) and Piñón-Zárate et al. (Citation2014). At necropsy, femurs and tibiae from each mouse were isolated, washed three times with 70% ethanol, and then, the epiphyses were removed (with sterile scissors) and the diaphysis perfused with phosphate-buffered saline (PBS pH 7.4) to dislodge the marrow. The cells were counted in a Neubauer chamber and then suspended in RPMI 1640 (complete), i.e. supplemented with 10% FBS, 100 U penicillin/ml, 100 µg streptomycin/ml, 2 mM L-glutamine, and a final 20% (v/v) addition of a CHO culture supernatant that contained 200 U GM-CSF/ml, and then plated at 106 cells/ml in 1.5-cm Petri dishes. Cells were cultured 8 d at 37 °C in a humidified 95% air/5% CO2 atmosphere; every third day, half the medium was replaced with fresh supplemented medium until differentiation of the DC present occurred (Day 8). BMDC differentiation was confirmed via measures of MHC Class II (MHCII) and CD11c (specific surface markers for DC) expression in a BD FACSCalibur™ flow cytometer (Beckton Dickinson, San Jose, CA). Data analyses were performed using FlowJo software (v10.0, Tree Star, Ashland, OR). At least 10 000 events/sample were acquired for each analysis.
All procedures involving the mice adhered to ethical standards that followed regulatory guidelines from the Mexican Official Norm NOM-062-ZOO-1999. This work was approved by the Institutional Ethical Committee of the University of Guadalajara.
Incubation of BMDC with AgNP
After BMDC were allowed to differentiate based on the method of Inaba et al. (Citation1992), the attached cells were dislodged from the culture flasks using Pasteur pipettes. After washing with PBS, cells were counted in a Neubauer chamber and placed in a complete medium (at 5 × 10⁵ cells/ml). Thereafter, 1 ml aliquots were seeded into 35-mm dishes (at 5 × 10⁵ cells/dish) for a subsequent 12 h incubation (at 37 °C) with different concentrations of AgNP (0.03, 0.06, 0.125, 0.250, 0.5, or 1.0 µg/ml [0.29, 0.58, 1.16, 2.32, 4.64, or 9.27 µM, respectively]). These concentrations used were based on the metallic Ag content of the Argovit.
This length of exposure and the doses of AgNP used were ultimately selected based on previous data from toxicity assays done to estimate the inhibitory concentration of AgNP in different biological systems (Vazquez-Muñoz et al. Citation2017). These values/timeframes were also based on findings from Kang et al. (Citation2012) who noted that AgNP induced changes in mitochondrial membrane potential shortly after treatment with AgNP (1-h). As decreases in mitochondrial membrane potential are important hallmarks of apoptosis induction, an exposure time of 12 h was selected to confirm if the toxicity of AgNP was the length of exposure-related. At the end of this exposure period, cells were recovered, washed, and re-suspended in PBS for use in the assays outlined below.
Cytotoxicity assessment
Discrimination of live vs. dead cells was performed using fluorochromes FDA and Et-Br, indicators of metabolically-active cells and cell membrane injury, respectively, as in Strauss (Citation1991). Stock solutions of FDA and Et-Br were prepared (FDA as 5 mg/ml in acetone and Et-Br as 3 mg/ml in PBS). To produce the working staining solution, 2.4 ml PBS was mixed with 15 μl diluted FDA and 100 μl Et-Br stock solution and the BMDC were then stained (2 µl dye + 2 µl cell suspension in PBS [104 cells]). The cells were quickly vortexed and then immediately analyzed in an Olympus BH-2 epifluorescence microscope (Olympus America, Mexico City). Live cells were green, whereas dead cells had a red nucleus. The percentage of cell viability was obtained by estimating red and green cell proportions. A total of 100 cells was scored for each sample and each sample was analyzed by triplicate. A sample incubated with DMSO was included as a positive control for cytotoxicity.
Analysis of cell viability
Cell viability was assessed by flow cytometry using a Calcein AM Live/Dead® assay kit, according to manufacturer instructions. This fluorescence-based method relies on enzymatic conversion of non-fluorescent cell-permeant dye to intensely fluorescent Calcein-AM within live cells that can be detected by flow cytometry. Aliquots of cells (500 µl suspension in PBS [3 × 10⁶ cells]) were combined with 1 µl dye (50 μM Calcein AM presented to cells) and 2 µl of ethidium homodimer-1 stock solution (2 mM), and the samples were then maintained in darkness for 15 min before analysis in the FACSCalibur flow cytometer. All data were analyzed using FlowJo software. At least 10, 000 events/sample were acquired.
Analysis of apoptotic and necrotic cells
Identification of apoptotic and necrotic cells was performed using a FITC-Annexin V and Propidium Iodide (PI) kit (BD Pharmingen) by flow cytometry. After the AgNP exposure, cells were washed twice with PBS; for this assay, the cells were re-suspended in kit-provided binding buffer. An aliquot of cells (100 μl [3 × 10⁵ cells]) was then treated with 5 μl FITC-Annexin V and PI solution, and the samples were incubated at room temperature for 15 min in the dark. The cells were then analyzed in the FACSCalibur system, using FlowJo software. At least 10,000 events/sample were acquired.
DNA damage
Any DNA damage as result of the AgNP exposure was evaluated using an alkaline single cell gel electrophoresis assay (SCGE/Comet assay - to detect single- and double-strand breaks), according to the method described by Fortoul et al. (Citation2004). In brief, a parallel sample of cells was incubated with 40 mM MMS (methyl methanesulfonate; inducer of mutations by causing methylation of nitrogenous DNA bases) under the same conditions (thus, a positive control for induction of DNA damage). Thereafter, 75 μl of each BMDC sample was mixed with 75 μl of 0.5% of low-melting-point agarose, and then 75 μl of this mixture was pipetted onto a slide previously covered with 150 μl regular melting point agarose. The slide was then cover-slipped to create a microgel. All slides were placed in an ice-cold tray to allow agarose solidification. The cover glass was then gently removed, and again 75 μl of low-melting-point agarose was layered on the slide. All slides were then immersed in lysing solution (2.5 M NaCl, 100 mM EDTA, 10 mM Tris-base, 1% Triton X-100, 10% DMSO [pH 10]) for 1 h at 4 °C. Slides were then placed in a horizontal electrophoresis chamber and the DNA was allowed to denature for 20 min in an electrophoresis running buffer solution (300 mM NaOH and 1 mM EDTA [pH ≥ 13]). Electrophoresis was then conducted for 20 min at 25 V and 300 mA. All technical steps were conducted under very dim light. Thereafter, the slides were removed, and the pH was neutralized with 0.4 M Tris (pH 7.5). The slides were then dehydrated in three steps with absolute ethanol (5 min/step). A solution of Et\Br (40 μl of 20 mg/ml solution) was placed on each slide and a cover glass was placed over the gel. DNA migration was analyzed with the Olympus BH-2 epifluorescence microscope fitted with a scaled ocular to permit comet tail length evaluation (in μm). For each sample, 200 cells were scored.
Cellular markers for phenotype assessment
The expression of cellular markers, including co-stimulatory and co-inhibitory molecules CD40 and CD273 respectively, was evaluated in BMDC (CD11c+MHCII+) to assess if there were any phenotypic changes induced by AgNP exposure. Both treated and untreated control cells were washed, re-suspended in PBS, and then aliquots (3 × 10⁵ cells/sample) were stained at room temperature with anti-MHCII-FITC, anti-CD11c-APC, anti-CD40-biotin, anti-CD273-biotin, and streptavidin-PE for 15 min (protected from light). The dilutions of each antibody used in this study were those recommended by the manufacturer. Thereafter, each sample was washed twice with PBS and fixed with 0.5% paraformaldehyde solution before being analyzed in the FACSCalibur system. At least 10,000 events/sample were acquired.
Statistical analysis
All data are expressed as means ± SD. Kolmogorov Smirnov and Shapiro Wilk tests were used to determine the normal distribution of the data. Differences in percentages of cell viability, MgI values, and BMDC surface marker expression were compared using parametric one-way analysis of variance (ANOVA) and a Bonferroni or Dunnett's post-hoc test and non-parametric Kruskal–Wallis and post-hoc Mann–Whitney U test. All experiments were performed in triplicate. Prism (v.6.01) software was used for all analyses (Graph Pad, San Diego, CA). A p ≤ 0.05 was considered statistically significant.
Results
Cytotoxicity assessment
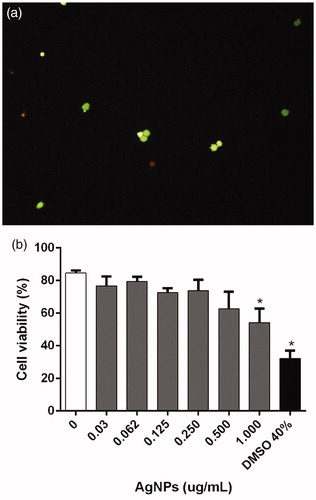
FDA/EtBr assays were used to assess BMDC viabilities after 12 h treatment with the various concentrations of AgNP. The assay discriminated live metabolically-active cells (green) and dead cells with membrane injury (red) (). Here, significant differences in cell viability were observed only with the highest Argovit AgNP level, 1.0 µg/ml (54.4 [±6.5] %) vs. untreated (85.0 [±1.05] %). Cells treated with DMSO (positive control) had a 30% viability, which suggested damage to the metabolic status/cell membrane integrity ().
Figure 1. Viability of BMDC incubated 12 h with AgNP. Viability analyzed by fluorescein-diacetate and ethidium bromide (FDA/Et-Br) staining. (a) Microphotograph (10X) illustrating dual-staining to discriminate metabolically-active live (green) vs. dead membrane-injured (red) cells. (b) Viability percentages. Cells with no treatment = negative controls (NT); cells treated with 40% DMSO = positive control. *p < 0.05 vs NT.
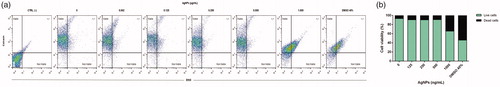
Because the FDA/EtBr assays indicated a significant decrease in BMDC viability due to 1.0 µg AgNP/ml, viability was also assessed using a calcein AM assay wherein the metabolic status of live cells can be determined (enzymatic conversion of non-fluorescent cell-permeant calcein to intensely fluorescent calcein within live cells), while cells with damaged membranes produce a bright red fluorescence upon binding of ethidium homodimer-1 (EthD-1) to nucleic acids. The results showed that a 12-h exposure to 1.0 µg AgNP/ml led to significant decreases in BMDC viability. Cells exposed to lower AgNP doses still had plasma membrane integrity and enzymatic activity (). The results corresponded with the earlier-measured FDA/EtBr data.
Figure 2. Assessment of levels of live BMDC after 12 h incubation with AgNP (Calcein-AM assay). (a) Representative dot-plots with percentage BMDC positive for Calcein and EthD-1. (b) BMDC live and dead percentages.
Apoptosis
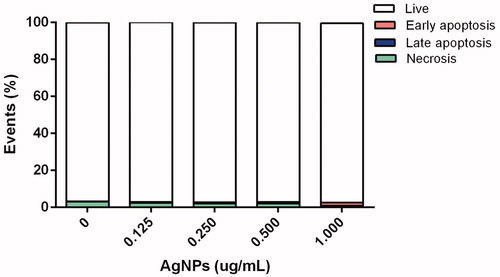
Cell death modality was evaluated with FITC-Annexin V and PI to discriminate living (unstained), necrotic (PI-stained), early apoptotic (FITC-Annexin V-stained), and late apoptotic (PI- and FITC-Annexin V-stained) BMDC. As shown in , after 12 h exposure of the cells to the AgNP, there was no evidence of late apoptosis having been triggered under any assay conditions, i.e. cell viabilities of >95% were noted with all treatment levels tested. However, at the highest exposure level (1.0 μg), slight early apoptosis was observed.
Figure 3. Cell death modality among BMDC incubated 12 h with AgNP. Percentages of live, early apoptotic, late apoptotic, and necrotic cells were assessed using FITC-Annexin V\propidium iodide (PI) staining and flow cytometry.
DNA damage
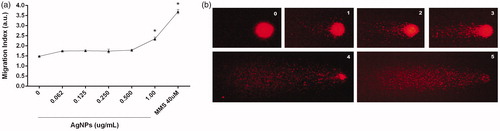
Any induced DNA damage was measured by quantification of single- and double-strand breaks (Comet assay). The results indicated there was no genotoxicity detectable after 12 h exposure to AgNP with the exception of the highest 1 µg/ml dose. Here, the DNA Migration index (MgI) value was significantly increased compared to that for the control (2.35 vs. 1.48 in treated and untreated cells, respectively) (). This damage was classified as severe.
Figure 4. DNA damage induced by AgNP. (a)=DNA migration index (MgI) in arbitrary units (a.u.) use to reflect levels of strand-breaks (Comet assay) in BMDC exposed 12 h to AgNP. (b) Representative photos of comets; numbers indicate Comet scores based on nucleus ratio (r). Methyl methane sulfonate (MMS)-treated cells = positive control. *p < 0.05 vs. untreated control.
Phenotypic implications
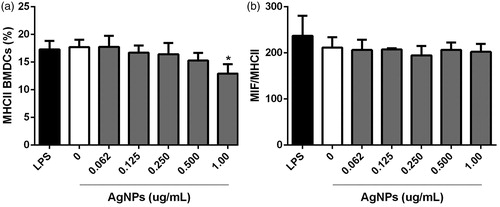
To investigate any phenotypic implications for the BMDC that evolved from the AgNP exposure, expression of select surface markers including CD11c (typical DC marker), MHC Class II (antigen-presenting molecule/maturation biomarker), and co-stimulatory/co-inhibitory surface molecules CD40 and CD273, respectively, were evaluated (these latter two among all CD11c+MHCII+ cells present). On average, >15% of cells with a CD11c+MHCII+ phenotype were present regardless of the AgNP dose tested (). In the case of MHCII on differentiated BMDC, the data indicated percentages of MHCII+ cells were slightly decreased by the 12 h exposure to 1 µg AgNP/ml (compared to levels seen with untreated cells). Regarding the mean fluorescence intensity (MIF) for MHCII expression, there was no effect with any of the AgNP doses tested ().
Figure 5. Representative dot-plots of differentiated BMDC among BMDC incubated 12 h with AgNP. (a) Characterization of BMDC populations by granularity (side-scatter SSC-H) and size (forward scatter FSC-H). (b) MHCII and CD11c expression among the cells (right top quadrant). Unstained (control) cells are shown for comparison.
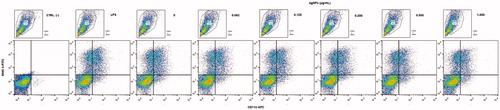
Figure 6. MHC Class II molecule expression on BMDC after 12 h exposure to AgNP. (a) Percentage MHCII+ cells. (b) Mean fluorescence intensity (MIF) for MHCII expression among MHCII+ cells. Lipopolysaccharide (LPS)-treated cells = positive control. Values shown are means ± SD (n = 3/treatment). *p < 0.05 vs. untreated cells.
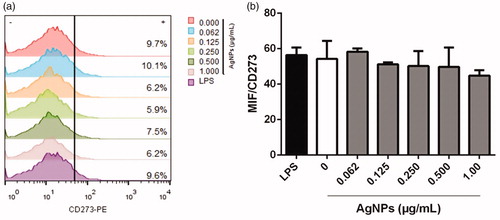
As noted above, CD11c+MHCII+ differentiated BMDC were also evaluated for CD40 and CD273 expression. There was no meaningful effect on CD40 expression after the 12 h exposure to any dose of AgNP. All treated and untreated cells presented lower CD40 expression just as the positive control cultures treated with 1 µg LPS/ml (). As with CD40, there was no impact on CD273 positivity among the BMDC after the 12 h exposures to any AgNP dose ().
Figure 7. Co-stimulatory CD40 molecule expression on MHC11+CD11c+ BMDC after 12 h exposure to AgNP. (a) Percentage CD40+ cells. (b) MIF for CD40 expression among CD40+ cells. LPS-treated cells = positive control. Values shown are means ± SD (n = 3/treatment).
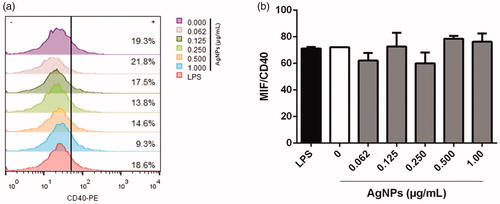
Figure 8. Co-inhibitory CD273 molecule expression on MHC11+CD11c+ BMDC after 12-h exposure to AgNP. (a) Percentage CD273+ cells. (b) MIF for CD273 expression. LPS-treated cells = positive control. Values shown are means ± SD (n = 3/treatment).
Discussion
Silver nanoparticles (AgNP) with different shapes and coatings are able to impart multiple biologic activities. Despite the spectrum of potential utilities of AgNP (in various formulations), only a few have ever had the possibility of reaching applicability due to low stability issues and/or high toxicity potentials. Toxicities of various types of AgNP have been reported (i.e. see Beer et al. [Citation2012]). For cells, AgNP have the potential to induce cytotoxicity via direct genomic damage or by inducing oxidative stress. Toxicities might be induced indirectly as well (under in vitro conditions), as consequence of any inflammation, the particles might be induced in situ (Collins et al. Citation2017).
The toxicity\bioactivities of AgNP formulations depend on physicochemical features that can also govern AgNP stability or reactivity (El Badawy et al. Citation2011; Wei et al. Citation2015). Recently, an analysis of the physicochemical properties of an approved commercially-available AgNP formulation (Argovit; 1.2% metallic silver, PVP coating [18.8% of total mass]), showed these AgNP had a 79-nm hydrodynamic ratio, a 35-nm (average) diameter, and a −15 mV ζ potential. This negative potential provided the AgNP particles high stability in solution and also influenced their agglomeration or ability to bind to cellular proteins. With regard to one of these parameters, cell uptake of charged AgNP (like Argovit AgNP) is greater compared with AgNP that have ζ potentials close to zero (Juarez-Moreno et al. Citation2017). Accordingly, it was not unexpected that Argovit AgNP were able to expose or reveal significant effects (toxicity) against several types of bacteria, fungi, viruses, and neoplastic human cells, with the effects being governed by the dose (Borrego et al. Citation2016; Juarez-Moreno et al. Citation2017; Vazquez-Muñoz et al. Citation2017). Despite this array of findings, in the end, commercial/medical applications for this/any other AgNP can only be achieved by mitigating toxicity, including immunotoxicity. At this point, there appears to a lack of information in the literature about potential effects of AgNP/Argovit on the immune system in general and upon DC in particular, important targets for effects of any potential immunotoxicant.
A notable decrease in viability (based on membrane integrity and cell metabolic activity) was found after exposure of the mouse BMDC to 1.0 µg AgNP/ml; this limited outcome confirmed that cytotoxicity was restricted by the AgNP level in Argovit (20% AgNP in water). The present findings were similar to those of Kang et al. (Citation2012) who noted that AgNP with a 2.3-nm diameter and a PVP-coating induced cytotoxicity in DC2.4 cells (DC line) at 0.5 and 1.0 µg AgNP/ml, after 24 and 48 h exposures, respectively. These authors also reported that AgNP elicited ROS-dependent apoptosis and a variety of intracellular signaling molecules (including ERK1/2, JNK, p53, p21, MMP9) were activated by ROS production induced by the AgNP. These published results confirmed the available evidence that suggested oxidative stress was at least one major mechanism through which AgNP could exert potential toxicity in cells.
Although data on AgNP cytotoxicity have been published, it is difficult to establish comparative cytotoxicity values (i.e. LC50) due to the heterogeneity among AgNP formulations and difficulties in establishing standardized methods to assess this parameter. Nevertheless, several publications have reported significant cytotoxicity from AgNP in different cells, including cancer cell lines. Juarez-Moreno et al. (2016) reported an LC50 for Argovit in several human tumor cell lines, e.g. cervix (HeLa: 4.73 µg/ml [43 µM]), breast (MDA-MB-231: 6.72 µg/ml [62 µM] and MCF-7: 4.56 µg/ml [0.042 µM]), prostate (DU-145: 7.57 µg/ml [0.07 µM]), colorectal (DLD-1: 4.19 µg/ml, [0.038 µM] and HT-29: 3.95 µg/ml, [0.036 µM]), and lung (H-1299: 3.71 µg/ml [0.034 µM] and H-1437 5.99 µg/ml, [0.055 µM]). In comparison, the present results indicated that the Argovit AgNP formulation reduced BMDC viability significantly solely at 1.0 µg/ml. We surmise that the differences from the cited results might be explained by different biological features of the targets cells, i.e. immortalized tumor cells have higher proliferative properties than a primary culture of BMDC (Fabbrizi et al. Citation2014).
Since the Argovit AgNP elicited cytotoxicity in BMDC here, apoptotic cell death was evaluated. However, no impact on late apoptosis was noted; nonetheless, slight early apoptosis was found at the highest exposure level employed. In addition, a small number of necrotic cells was observed in almost all treatment levels tested; however, this outcome could be simply related to cell handling. This lack of effect could be explained by a possible cytoprotective-autophagic response induced in the BMDC to promote cell survival. Autophagy is a process normally involved in several DC functions including maturation, antigen presentation, cytokine production, migration, and T-cell activation (Ghislat and Lawrence Citation2018). In this context, only viability (based on cell metabolic activity) was affected, likely due to a loss of cytoplasmic constituents (i.e. proteins, damaged organelles) as a secondary effect of autophagy while apoptosis was not affected. Probably, any induction of autophagy in the DC that was mediated by the AgNP might be associated with stress-related stimuli, considered these have been shown to be autophagy-inducers in different types of DC (Levine and Kroemer Citation2008). Still, while some nanomaterials have been shown to act as autophagy-inducers, e.g., quantum dots, gold\iron metallic NP, graphene, fullerene C60/its derivatives, etc., it remains to be determined if AgNP can induce - or even inhibit - autophagy in DC or other cell types (Lin et al. Citation2014).
Regarding genotoxicity, cells were classified into five categories according to their nucleus ratio (r = measure of tail/measure of the head). The r was classified as follows: (A) no DNA damage; (B) r ≤ 1, low damage; (C) 1 < r ≥ 2, medium damage; (D) r > 2, almost all DNA in the tail; and (E) all DNA in the tail, maximally damaged. Results were expressed as a “Migration Index” (MgI) value (directly proportional to DNA damage by strand-breaks). Here, MgI = [(A)1 + (B)2 + (C)3 + (D)4 + (E)5]/total cells analyzed (%), with A, B, C, D, and E as the percentages of cells in each category and the numbers (1–5) as arbitrary units represented by each category.
The Comet assay confirmed the cytotoxicity findings, where DNA damage was not significant except with the highest AgNP dose. In this regard, it has been reported that genomic damage could be induced by AgNP itself; evidence exists that Ag+ ions promote ROS generation by mitochondria that, in turn, cause genomic damage due to reactivity towards DNA (Asare et al. Citation2012; Ghosh et al. Citation2012). Another possibility is that Ag+ ions or Ag atoms (Ag0) that are released from the parent AgNP, interact with thiol moieties on proteins, events that often lead to inhibition/inactivation of many enzymes including those involved in DNA repair (Sharma et al. Citation2014; Liu et al. Citation2017). While DNA damage from AgNP (using the Comet assay) has been studied in different cell types, e.g. human lymphocytes and fibroblasts, RAW 264.7 murine macrophage cells, several cancer cell lines, and monocyte-derived macrophages (Herzog et al. Citation2014; El Yamani et al. Citation2017; Ahmed et al. Citation2017), different genotoxic behaviors were observed in these systems. At this point, it is not possible to explain these various outcomes since key features of the AgNP tested (i.e. metallic content or coating agent) were not provided in the paper. With regard to BMDC specifically, it does not appear to be any other studies to date that have evaluated DNA damage from AgNP in this cell type.
Regarding the phenotypic impact, expression of MHC Class II molecules (part of DC antigen-presentation machinery) on the BMDC was unaffected by the 12 h AgNP exposures. There was only a slight decrease in levels of CD11c+MHCII+ BMDC with the highest dose of the Argovit. This minor change was more likely due to the cytotoxicity of the AgNP than any impact on molecule expression per se. Normally, as a secondary response to foreign/inflammatory stimuli, DC enhance their capacity for antigen presentation via DC maturation in which phenotypic changes occur (Shin et al. Citation2006). This immature to mature state conversion is accompanied by increased surface expression of MHCII and co-stimulatory molecules like CD40, CD80, and CD86 to stimulate naïve T-cells (Villadangos et al. Citation2005). In DC, downstream signaling pathways initiated through CD40 activate multiple key genes critical to DC function, including those involved in cytokine production, and for even increasing expression of maturation markers (like MHCII, CD80, and CD86) (Ma and Clark Citation2009). In the current study, significant differences in CD40 expression on the BMDC after AgNP exposure were not found. Similarly, expression of CD273 (PD-L2 or B7-DC) was not changed. CD273 also is known to deliver inhibitory signals to T-cells (through PD-1) and thus, help DC act as negative regulators of T-cell activation (Chinai et al. Citation2015). As such, any increased presence of CD273 could be associated with blocking of T-cells responses.
In this regard, the current findings suggest that Argovit could contribute to the maintenance of the structural conservation of co-stimulatory/co-inhibitory surface molecules CD40 and CD273. Further, this possibly occurred without activation of any immunogenic response or inhibitory signals to T-cells.
Conclusions
The toxicological effects of AgNP on BMDC were restricted by the AgNP concentration administered. A level of 1.0 μg/ml (based on metallic silver content) was identified as the AgNP concentration where a cytotoxic effect and DNA damage began to be identifiable. This finding suggests that at concentrations lower than 1.0 μg/ml, AgNP could potentially be associated with low toxicity toward BMDC and could contribute to the possible maintenance of co-stimulatory/co-inhibitory surface molecules. This suggests a potential use of this AgNP formulation as a candidate to produce safe biomedical applications without toxicological effects in cells of the immune system. To our knowledge, this is the first study about the effects of AgNP on phenotype among BMDC.
Acknowledgments
The authors gratefully acknowledge Dr. Juan Carlos Garcia-Ramos, Coordinator of the Editorial Committee for providing English and technical advice.
Disclosure statement
The authors declare no conflicts of interest. The authors alone are responsible for the content of this manuscript.
Additional information
Funding
References
- Ahlberg S, Antonopulos A, Diendorf J, Dringen R, Epple M, Flöck R, Goedecke W, Graf C, Haberl N, Helmlinger J. 2014. PVP-coated, negatively-charged silver nanoparticles: A multi-center study of their physicochemical characteristics, cell culture and in vivo experiments. Beilstein J Nanotechnol. 5:1944.
- Ahmed L, Milić M, Pongrac I, Marjanović A, Mlinarić H, Pavičić I, Vrček I. 2017. Impact of surface functionalization on the uptake mechanism and toxicity effects of silver nanoparticles in HepG2 cells. Food Chem Toxicol. 107:349–361.
- Asare N, Instanes C, Sandberg W, Refsnes M, Schwarze P, Kruszewski M, Brunborg G. 2012. Cytotoxic and genotoxic effects of silver nanoparticles in testicular cells. Toxicology. 291:65–72.
- Asharani P, Wu Y, Gong Z, Valiyaveettil S. 2008. Toxicity of silver nanoparticles in zebrafish models. Nanotechnology. 19:255102.
- Aziz S, Aziz S, Akbarzadeh A. 2017. Advances in silver nanotechnology: Update on biomedical applications and future perspectives. Drug Res. 67:198–203.
- Beer C, Foldbjerg R, Hayashi Y, Sutherland D, Autrup H. 2012. Toxicity of silver nanoparticles or silver ion? Toxicol Lett. 208:286–292.
- Borrego B, Lorenzo G, Mota-Morales J, Almanza-Reyes H, Mateos F, López-Gil E, de la Loza N, Burmistrov V, Pestryakov A, Burn A, et al. 2016. Potential application of silver nano-particles to control infectivity of Rift Valley fever virus in vitro and in vivo. Nanomedicine. 12:1185–1192.
- Chinai J, Janakiram M, Chen F, Chen W, Kaplan M, Zang X. 2015. New immunotherapies targeting the PD-1 pathway. Trends Pharmacol Sci. 36:587–595.
- Collins A, El Yamani N, Dusinska M. 2017. Sensitive detection of DNA oxidation damage induced by nanomaterials. Free Radic Biol Med. 107:69–76.
- Dube A, Reynolds J, Law W, Maponga C, Prasad P, Morse G. 2014. Multimodal nanoparticles that provide immunomodulation and intracellular drug delivery for infectious diseases. Nano medicine. 10:831–838.
- El Badawy A, Silva R, Morris B, Scheckel K, Suidan M, Tolaymat T. 2011. Surface charge-dependent toxicity of silver nanoparticles. Environ Sci Technol. 45:283–287.
- El Yamani N, Collins AR, Rundén-Pran E, Fjellsbø LM, Shaposhnikov S, Zielonddiny S, Dusinska M. 2017. In vitro genotoxicity testing of four reference metal nanomaterials, titanium dioxide, zinc oxide, cerium oxide and silver: Towards reliable hazard assessment. Mutagenesis. 32:117–126.
- Fabbrizi M, Duff T, Oliver J, Wilde C. 2014. Advanced in vitro systems for efficacy and toxicity testing in nanomedicine. Eur J Nanomed. 6:171–183.
- Fortoul T, Valverde M, Lopez M, Avila-Costa M, Avila-Casado M, Mussali-Galante P, Gonzalez-Villalva A, Rojas E, Ostrosky-Shejet P. 2004. Genotoxic differences by sex in nasal epithelium and blood leukocytes in subjects residing in a highly polluted area. Environ Res. 94:243–248.
- Ge L, Li Q, Wang M, Ouyang J, Li X, Xing M. 2014. Nanosilver particles in medical applications: Synthesis, performance, and toxicity. Intl J Nanomed. 9:2399–2407.
- Ghislat G, Lawrence T. 2018. Autophagy in dendritic cells. Cell Mol Immunol Nat. 15:944–952.
- Ghosh M, Manivannan J, Sinha S, Chakraborty A, Mallick S, Bandyopadhyay M, Mukherjee A. 2012. In vitro and in vivo genotoxicity of silver nanoparticles. Mutat Res. 749:60–69.
- Herzog F, Loza K, Balog S, Clift M, Epple M, Gehr P, Petri-Fink A, Rothen-Rutishauser B. 2014. Mimicking exposures to acute and lifetime concentrations of inhaled silver nanoparticles by two different in vitro approaches. Beilstein J Nanotechnol. 5:1357–1370.
- Inaba K, Inaba M, Romani N, Aya H, Deguchi M, Ikehara S, Muramatsu S, Steinman R. 1992. Generation of large numbers of dendritic cells from mouse bone marrow cultures supplemented with granulocyte/macrophage colony-stimulating factor. J Exp Med. 176:1693–1702.
- Jiao Q, Li L, Mu Q, Zhang Q. 2014. Immunomodulation of nanoparticles in nanomedicine applications. BioMed Res Intl. 2014:1.
- Juarez-Moreno K, Gonzalez E, Girón-Vazquez N, Chávez-Santoscoy R, Mota-Morales J, Perez-Mozqueda L, Garcia-Garcia M, Pestryakov A, Bogdanchikova N. 2017. Comparison of cytotoxicity and genotoxicity effects of silver nanoparticles on human cervix and breast cancer cell lines. Human Exp Toxicol. 36:931–948.
- Kang K, Jung H, Lim J. 2012. Cell death by polyvinylpyrrolidine-coated silver nanoparticles is mediated by ROS-dependent signaling. Biomol Ther. 20:399.
- Kang K, Lim J. 2012. Induction of functional changes of dendritic cells by silica nanoparticles. Immune Net. 12:104–112.
- Klippstein R, Fernandez-Montesinos R, Castillo P, Zaderenko A, Pozo D. 2010. Silver nanoparticles interactions with the immune system: Implications for health and disease. Intech Open. 2010:309–324.
- Koike E, Takano H, Inoue K, Yanagisawa R, Kobayashi T. 2008. Carbon black nanoparticles promote the maturation and function of mouse bone marrow-derived dendritic cells. Chemosphere. 73:371–376.
- Levine B, Kroemer G. 2008. Autophagy in the pathogenesis of disease. Cell. 132:27–42.
- Lin J, Huang Z, Wu H, Zhou W, Jin P, Wei P, Zhang Y, Zheng F, Zhang J, Xu J, et al. 2014. Inhibition of autophagy enhances the anti-cancer activity of silver nanoparticles. Autophagy. 10:2006–2020.
- Liu W, Worms I, Herlin-Boime N, Truffier-Boutry D, Michaud-Soret I, Mintz E, Vidaud C, Rollin-Genetet F. 2017. Interaction of silver nanoparticles with metallothionein and ceruloplasmin: Impact on metal substitution by Ag(I), corona formation and enzymatic activity. Nanoscale. 9:6581–6594.
- Ma D, Clark E. 2009. The role of CD40 and CD154/CD40L in dendritic cells. Semin Immunol. 21:265–272.
- Piñón-Zárate G, Herrera-Enríquez M, Hernández-Téllez B, Jarquín-Yáñez K, Castell-Rodríguez A. 2014. GK-1 improves the immune response induced by bone marrow dendritic cells loaded with MAGE-AX in mice with melanoma. J Immunol Res. 2014:158980.
- Riaz Ahmed K, Nagy A, Brown R, Zhang Q, Malghan S, Goering P. 2017. Silver nanoparticles: Significance of physicochemical properties and assay interference on the interpretation of in vitro cytotoxicity studies. Toxicol In Vitro. 38:179–192.
- Sharma V, Siskova K, Zboril R, Gardea-Torresdey J. 2014. Organic-coated silver nanoparticles in biological and environmental conditions: Fate, stability and toxicity. Adv Colloid Inter-Face Sci. 204:15–34.
- Shin J, Ebersold M, Pypaert M, Delamarre L, Hartley A, Mellman I. 2006. Surface expression of MHC Class II in dendritic cells is controlled by regulated ubiquitination. Nature. 444:115.
- Steinman R, Banchereau J. 2007. Taking dendritic cells into medicine. Nature. 449:419.
- Strauss G. 1991. Non-random cell killing in cryopreservation: Implications for performance of the battery of leukocyte tests (BLT), I. Toxic and immunotoxic effects. Mutat Res. 252:1–15.
- van der Zande M, Vandebriel R, van Doren E, Kramer E, Herrera Rivera Z, Serrano-Rojero C, Gremmer E, Mast J, Peters R, Hollman P, et al. 2012. Distribution, elimination, and toxicity of silver nanoparticles and silver ions in rats after 28-day oral exposure. ACS Nano. 6:7427–7442.
- Vazquez-Muñoz R, Borrego B, Juárez-Moreno K, García-García M, Morales J, Bogdanchikova N, Huerta-Saquero A. 2017. Toxicity of silver nanoparticles in biological systems: Does the complexity of biological systems matter? Toxicol Lett. 276:11–20.
- Villadangos J, Schnorrer P, Wilson N. 2005. Control of MHC Class II antigen presentation in dendritic cells: A balance between creative and destructive forces. Immunol Rev. 207:191–205.
- Wei L, Lu J, Xu H, Patel A, Chen Z, Chen G. 2015. Silver nanoparticles: Synthesis, properties, and therapeutic applications. Drug Discov Today. 20:595–601.
- Zhang X, Liu Z, Shen W, Gurunathan S. 2016. Silver nanoparticles: synthesis, characterization, properties, applications, and therapeutic approaches. Intl J Mol Sci. 17:1534.
- Zhang T, Wang L, Chen Q, Chen C. 2014. Cytotoxic potential of silver nanoparticles. Yonsei Med J. 55:283–291.
- Zhou W, Liu Y, Stallworth A, Ye C, Lenhart J. 2016. Effects of pH, electrolyte, humic acid, and light exposure on the long-term fate of silver nanoparticles. Environ Sci Technol. 50:12214–12224.