
Abstract
Measurements of complement-bound circulating immune complexes (cCICs) in pre-clinical studies may provide important information about the etiology of certain pathology findings suggestive of being immune complex mediated. This article describes the development and qualification of a universal methodology to measure cCIC in mice after dosing with species foreign proteins. The assay is a sandwich enzyme-linked immunosorbent assay – exclusively based on commercially available reagents – that could detect mouse IgG bound to complement C3 independent of the test-substance present in the plasma sample. Heat-aggregated serum was used as positive control. The assay was qualified by assessment of acceptance criteria, stability of positive control, precision, and specificity. Finally, the performance of the assay was tested using plasma from mice administered either of three different proteins, i.e bovine serum albumin (BSA), a fully human monoclonal antibody, and a humanized monoclonal antibody.
Introduction
Anti-drug antibodies binding to administered test-substances may form circulating immune complexes (CICs) that can activate complement, resulting in complement fragments bound to CICs (cCIC) (Theofilopoulos and Dixon Citation1979; Brennan et al. Citation2010). Whereas complement C1q binding to CICs indicates activation early in the classical cascade, complement C3b fragments covalently attached to CICs indicate activation of later events in the complement cascade (Theofilopoulos and Dixon Citation1979; Murphy and Weaver Citation2016). Formation of cCICs may subsequently give rise to pathological changes due to cCIC deposition in the vasculature (Rojko et al. Citation2014), the inflammatory properties of complement fragments (Bourke et al. Citation1982), and recruitment of inflammatory cells (Mayadas et al. Citation2009; Krishna and Nadler Citation2016). Therefore, to explain any pathological findings when testing new therapeutics in animal models, it is very important to be able to detect various cCICs.
Several human-specific cCIC assays detecting endogenous IgG bound to C1q or C3 have been developed for clinical screening (Pereira et al. Citation1980; Soares et al. Citation2001; Stanilova and Slavov Citation2001). Similar assays are valuable for pre-clinical use. Compared to cCIC measurement in humans, few papers have described assays established for detection of cCIC in mice (Gabriel and Agnello Citation1977; Devey et al. Citation1980; Pereira et al. Citation1980; van Dam and Hack Citation1987; Hewicker et al. Citation1990; Machida et al. Citation2018). Qualified methods using a C3-IgG ELISA to measure cCIC in plasma from mice administered species-foreign proteins have not been described.
In this article, a simple sandwich ELISA was developed and qualified for detection of cCICs formed in vivo. The protocol employs a solid phase anti-C3 as a detecting antibody and a fluid phase horseradish peroxidase (HRP)-labeled anti-mouse (m)IgG antibody for capture; the entire assay is exclusively based on commercially available reagents. Assay performance/validity was tested using plasma isolated from mice that had been treated with human (h)IgG1, humanized (hz)IgG4, or bovine serum albumin (BSA).
Materials and methods
Preparation of positive controls
Aggregated IgG is known to stimulate complement activation by the classical complement pathway (Lutz et al. Citation1996). Upon complement activation additional monomeric IgG is able to bind the cCICs (Van Dam and Hack Citation1987). To closely resemble complement bound hIgG-mIgG complexes formed in vivo heat-aggregated human γ-globulin (HAGG) was used to stimulate complement activation in mouse serum. The material was used as a positive control ().
Figure 1. Preparation of the positive control. The positive control was used as quality control in the enzyme-linked immunosorbent assay (ELISA). Mouse serum containing mouse immunoglobulin (Ig) and inactivated complement was incubated with heat-aggregated human IgG (“Complement Activator”) to stimulate complement activation by the classical complement pathway. Monomeric mouse IgG was able to bind to aggregated human IgG, leading to formation of complement bound hIgG-mIgG complexes. ![]()
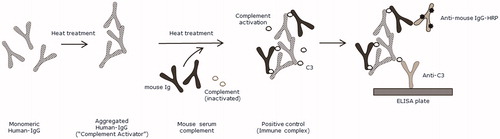
In brief, mouse serum complement (Innovative Research, Novi, MI, cat. no IMS-C57BL6-COMPL) was incubated at 37 °C for 90 min with 1:100 HAGG (Complement Activator, Quidel, San Diego, CA, cat. #A114), followed by inactivation by addition of ice-cold 500 mM ethylenediamine-tetraacetic acid (EDTA; to final concentration of 20 mM) and storage (undiluted) at −80 °C until analysis. In the early qualification process, the positive control diluted showed OD signal above 59% compared to signal from mouse serum complement without HAGG (data not shown). For quality controls (QCs), the positive control was diluted 1:20 (QChigh), 1:40 (QCmedium), or 1:80 (QClow) in phosphate-buffered saline ((PBST) [pH 7.2] containing 0.05% Tween 20 [Merck, Darmstadt, Germany]) dilution buffer. QCnegative(neg) was pooled plasma containing EDTA from 6 drug-naïve C57BL/6 mice (diluted 1:80 in dilution buffer).
cCIC ELISA
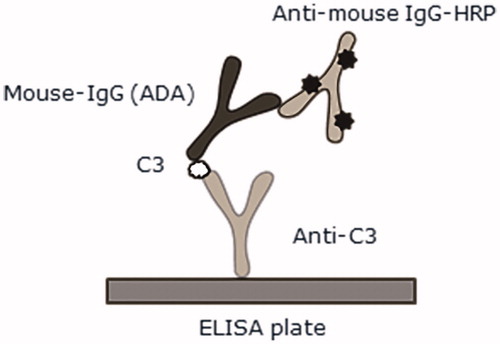
The assay principle is illustrated in . Polyclonal rabbit anti-mouse C3 antibody (Bioss Inc., Boston, MA, cat. #BS-2934R) was diluted to 1 µg/ml in carbonate buffer (0.1 M, pH 9.6) and coated (at 100 µl/well) overnight at 4 °C onto the walls of 96-well NUNC-Immuno MicroWell plates (Thermo Fisher Scientific, Roskilde, Denmark). Following washings (three wash cycles/300 µl dilution buffer/cycle) in an ELISA washer (Power Washer 384, Tecan, Grödig, Austria), each plate was blocked (on shaker set at 300 rpm) for 1 h at 21 °C using 200 µl dilution buffer/well. Blocking solution was then removed and 100 µl study samples/well (each diluted 1:80) and QCs were added to dedicated wells. The plates were then incubated 1 h at 21 °C on a shaker. Each plate was washed with buffer and then 100 µl HRP-labeled goat anti-mIgG (Jackson ImmunoResearch, Newmarket Suffolk, UK, diluted 1:10 000 in dilution buffer, cat. #115–035-174) was added to each well. After a 1 h incubation at 21 °C (on shaker), each plate was washed with buffer and the color reactions in each well initiated by addition of 100 µl trimethoprim (TMP One; Kem-En-Tec Diagnostics, Taastrup, Denmark) per well. Reactions were stopped after 6–7 min by addition of 100 µl 4 M o-phosphoric acid/well, and then spectrophotometric measurements of optical density (OD450–620) were measured in a Sunrise ELISA plate reader (Tecan) using Magellan Software (Tecan).
Figure 2. cCIC detected in a sandwich enzyme-linked immunosorbent assay (ELISA). Rabbit anti-C3 and goat anti-mIgG HRP were used for detection of complement C3 bound to mIgG. ![]()
Qualification of ELISA
The QCs were used for setting acceptance criteria; the calculation was based on QChigh, QCmedium, and QClow assayed in duplicate in seven independent assay runs. The lower limit acceptance criteria was calculated as: [Mean of OD] − [(one-sided t0.01,df = 3.365 for df:5)] × [SD of OD], leading to a 1% rejection rate. If the QC were above the criteria and QCneg below the assay cut-point, the assay was accepted. To check the stability of the positive control, undiluted positive control was stored under different conditions: at −80 °C for 5 d and 3 month, at 4 °C for 1 and 5 d, after four repeated freeze/thaw cycles, and after eight repeated freeze/thaw cycles, followed by a 1:80-dilution and analysis in duplicate in the cCIC ELISA. An OD signal change < 20% was considered acceptable. Evaluation of intra- and inter-plate variations were based on QC analyzed in 11 replicates on the same plate and in six independent assay runs performed over two days. All samples were measured in duplicate, and mean OD values were reported as percentage of the coefficient of variation (% CV).
Protein G elution was used to separate a mouse plasma pool (previously shown to have a high cCIC level; K2EDTA C57BL/6 mouse plasma; BioIVT, Westbury, NY) into IgG and non-IgG fractions and to determine the signal from these. Eluation was performed in NAb Protein G Spin Columns (Thermo Fisher Scientific) according to manufacturer instructions, followed by freezing of the non-IgG and IgG fractions at −20 °C until assayed. The two elution fractions, the positive controls and un-fractioned plasma pool, were then diluted 1:20, 1:40, 1:80, or 1:160 in dilution buffer. A negative control consisting of monoclonal mIgG2 (mouse anti-human IgG1, BD Pharmingen, San Jose, CA) was diluted to 10, 5, 2.5, or 1.25 μg/ml in dilution buffer. All samples were assayed in duplicate in the cCIC ELISA. All results are presented as mean OD values.
To assess potential signal disturbance between BSA and assay antibodies, BSA was diluted to 100 or 10 μg/ml in QChigh, QCmedium and QClow, or serially diluted from 2000 to 0.017 μg/ml in dilution buffer containing 1:80 plasma pool. The samples were assayed in duplicate and results given as mean OD values.
Assay cut-point determination
A panel of 36 drug-naïve murine plasma samples obtained from BALB/c and C57BL/6J mice (Charles River, Sulzfeld, Germany) were analyzed in duplicate in six independent assay runs. Data were analyzed using log-transformed S/N data and statistical information about distribution, means and variances were obtained using SAS.JMP version 13.0.0 (SAS, Cary, NC). A parametric cut-point approach allowing a false positive rate of 5% was based on the formula [Mean of S/N] + [(t0.05,df = 1.645 for df:∞) × [SD of S/N], followed by logarithmic back-transformation, as described by Devanarayan et al. (Citation2017).
Animals
C57BL/6J mice (48, female, 10–12 Week-of-age) mice were purchased from Charles River (Sulzfeld, Germany) and housed in pathogen-free facilities maintained at 21 °C with a 60% relative humidity and 12-h light/dark cycle. All mice had ad libitum access to standard rodent chow and filtered tapwater. After at least 1 Week of acclimatizing, the mice were randomly allocated into groups (n = 12/group) wherein they were injected subcutaneously twice weekly for 13 Weeks with vehicle, 10 mg/kg hIgG1 (adalimumab, human anti-TNFα: Humira, AbbVie, North Chicago, IL), 10 mg/kg hzIgG4 (antibody directed against trinitrophenyl [Novo Nordisk A/S, Måløv, Denmark]), or 50 mg/kg BSA (Sigma Aldrich, Schnelldorf, Germany). These animal experiments were approved by the Danish Animal Experiments Council under the Danish Ministry of Environment and Food, as well as the Novo Nordisk Ethical Research Committee.
Determination of cCIC in mouse plasma
One Day after the final injection, blood was collected from the periorbital plexus of each mouse and plasma obtained by centrifugation. The procedure was performed under isoflurane anesthesia and following sampling, the mice were euthanized by puncture of the abdominal aorta. Each isolated plasma sample was then stored at −80 °C until analysis. At that time, the sample was thawed and then diluted 1:80 in dilution buffer just prior to the analysis. Samples were considered cCIC positive if above the assay cut-point.
Results
Assay performance and cut-point evaluation
A lower-limit acceptance criterion for positive control quality samples was determined to an OD of 0.36, 0.19, and 0.08 for QChigh, QCmedium, and QClow, respectively; the OD mean of QCneg was 0.047 (). When maintained under different storage conditions, the positive control showed a stable OD signal, with changes of <20% CV (). The precision of the assay was considered acceptable with an intra-assay precision of QChigh, QCmedium, and QClow at 2.36, 3.48, and 4.48% CV, respectively, and an inter-assay precision of 20.36, 16.51, and 16.28% CV, respectively ().
Figure 3. cCIC assay performance. (A) Four quality controls (QC) (●) and lower acceptance criteria (—) of the positive controls were calculated based on six independent assay runs. (B) Stability of undiluted positive control following storage at −80 °C for 3 months or 5 d, at 4 °C for 1 or 5 d, or after four or eight repeated freeze/thaw cycles. Samples were diluted 1:80 and analyzed (in duplicate) in cCIC assay. (C) Specificity of a mouse plasma pool previously analyzed with high cCIC levels, following separation into IgG and non-IgG fractions using protein G columns. The non-IgG fraction shows minimal signal, whereas the IgG fraction, shows larger signal, similar to the un-fractioned mouse plasma. The IgG-fraction signal was comparable to the positive control itself at dilution factor 1:40–1:160. (D,E) No considerable changes in assay readout from 1:80 plasma (D) or QC (E) containing various concentrations of BSA were observed, which suggested no interference between BSA and assay antibodies. (F) Positive cCIC results were detected in 1/12, 12/12, 7/12, and 1/12 mice dosed subcutaneously twice weekly for 13 Weeks with either vehicle, 50 mg/kg BSA, 10 mg/kg hIgG1, or 10 mg/kg hzIgG4. Dotted line represents cut-point. Signal expressed as optical density (OD) signal (A–E), signal to noise (S/N; OD signal/QCneg) (F) and mean + SD (F).
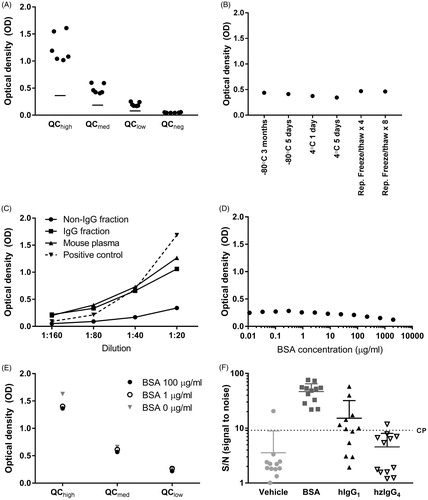
Table 1. Assay precision.
Protein G purification of a mouse plasma pool with high cCIC levels, showed that the majority of the signal in the cCIC assay derived from the IgG fraction (). In addition, the signal from the IgG-fraction was comparable to the positive control itself at 1:40–1:160 dilutions; at 1:20 dilution, the signal from the IgG fraction did not reach the same level as the positive control. In the non-IgG-fraction (mouse plasma after protein G purification), the cCIC signal had clearly been decreased. Further, to test that antibody by itself did not induce a signal, a monomer mIgG (without C3) was tested. A low signal (between 0.28 and 0.12 at 10 and 1.25 μg/ml dilution, respectively) was observed, confirming specificity to CIC (data not shown). To ensure BSA from the test samples did not interfere in the assay, QC or plasma pool containing various concentrations of BSA were tested. No considerable changes of OD signals were observed ().
A cut-point was determined in order to assign test samples as positive or negative for cCIC. The Shapiro–Wilk W test showed normal distribution of log10-transformed (S/N) data in 5 of 6 runs (Shapiro–Wilks, p > 0.05) analyzing a panel of 36 drug-naïve murine plasma samples obtained from BALB/c and C57BL/6J mice. A Welch ANOVA and a Levene’s test each showed homogeneity of means and variances (p > 0.05) and on pooled data from all six runs, a skewness coefficient at 0.43, suggesting a parametric cut-point approach was suitable after removal of two outliers. The cut-point was determined to 9.17 (100.936) S/N as calculated from the formula 0.455 + 1.684 × 0.301 = 0.936.
cCIC detection in mice
Mice were administered subcutaneously with BSA, hIgG1, or hzIgG4 twice weekly for 13 Weeks and a presence of cCIC was then determined. After the 13-Week regimen, cCIC were detected in, respectively, 12/12, 7/12, or 1/12 mice/group (). In vehicle-treated animals, only 1/12 mice were cCIC+.
Discussion
This article describes a generic method for measurement of in vivo-formed cCIC (consisting of C3 bound to CICs) in murine plasma samples. The assay was exclusively based on commercially available reagents, making it easy to set up in any department. Based on the performance qualifications, the assay was considered valid for detecting cCIC in mouse plasma. As previously described, heat-aggregated IgG was used as a positive control (van Dam and Hack Citation1987; Muratsugu Citation1996), and in order to mimic in vivo cCIC formation in mice administered with human proteins, the positive control was based on human HAGG in murine plasma.
The specificity of the assay was examined after protein G fractionation of plasma, showing that the signal was derived from the plasma IgG-fraction rather than the non-IgG fraction. Furthermore, limited signal was detected from monomer mIgG which confirms the specificity of the assay. The performance of the assay was tested using study samples from mice administered BSA or human(ized) antibodies. Different levels of cCIC in the different groups were observed, confirming the ability of the assay to detect cCIC in mouse plasma samples independently of the test-substance. However, cCIC was detected in one control mice, likely due to spontaneous hydrolysis of C3 independent of test substance, which may cause cCIC formation under normal circumstances (Pangburn and Muller-Eberhard Citation1983; Murphy and Weaver Citation2016). In addition, the cutpoint allowed for 5% to be false positive. All mice receiving BSA had considerable higher cCIC levels compared to the other test substances. The qualification showed no interference from BSA that could explain this and the higher level of cCIC observed was likely to be caused by higher immunogenic properties of BSA. The relatively high cut-point was due to individual vehicle mouse responses measuring higher than the pool and high variability in the responses across the mice. However, this did not hinder cCIC detection in the current study.
The current assay only detected cCIC activated by C3; to ensure detection of all CICs that interact with complement, supplemental application using other CIC assays may be optimal (Lambert et al. Citation1978; Stanilova and Slavov Citation2001), e.g. using a C1q-IgG assay frequently used for detection of cCIC opsonized with C1q (Gabriel and Agnello Citation1977; Abrass et al. Citation1980; Devey et al. Citation1980, Citation1982; Devey and Steward Citation1980; Hewicker et al. Citation1990; Hori and Abrass Citation1990; Chen et al. Citation2004) or CIC assays that are based on the ability of CIC to interact with complement receptors (Noble et al. Citation1987).
Conclusions
An assay for detection of cCICs – regardless of antigen – in murine plasma samples was successfully developed and qualified. The assay was shown to be specific, with high precision. Because it was based on commercially available reagents, this makes it easy to implement by other investigators.
Disclosure statement
The authors declare no conflicts of interest. The authors alone are responsible for the content of this article.
Additional information
Funding
References
- Abrass C, Border W, Glassock R. 1980. Circulating immune complexes in rats with autologous immune complex nephritis. Lab Invest. 43:18–27.
- Bourke B, Moss I, Mumford P, Horsfall A, Maini R. 1982. The complement fixing ability of putative circulating immune complexes in rheumatoid arthritis and its relationship to extra-articular disease. Clin Exp Immunol. 48:726–732.
- Brennan F, Morton L, Spindeldreher S, Kiessling A, Allenspach R, Hey A, Muller P, Frings W, Sims J. 2010. Safety and immunotoxicity assessment of immunomodulatory monoclonal antibodies. MAbs. 2:233–255.
- Chen J, Chen A, Chang L, Chang W, Lee H, Lin S, Lin Y. 2004. Mouse model of membranous nephropathy induced by cationic bovine serum albumin: Antigen dose-response relations and strain differences. Nephrol Dial Transplant. 19:2721–2728.
- Devanarayan V, Smith W, Brunelle R, Seger M, Krug K, Bowsher R. 2017. Recommendations for systematic statistical computation of immunogenicity cut points. AAPS J. 19:1487–1498.
- Devey M, Bleasdale K, Collins M, Steward M. 1982. Experimental antigen-antibody complex disease in mice. The role of antibody levels, antibody affinity and circulating antigen-antibody complexes. Int Arch Allergy Appl Immunol. 68:47–53.
- Devey M, Taylor J, Steward M. 1980. Measurement of antigen-antibody complexes in mouse sera by conglutinin, C1q and rheumatoid factor solid phase binding assays. J Immunol Meth. 34:191–203.
- Devey M, Steward M. 1980. The induction of chronic antigen-antibody complex disease in selectively bred mice producing either high or low affinity antibody to protein antigens. Immunology. 41:303–311.
- Gabriel A, Agnello V. 1977. Detection of immune complexes. The use of radioimmunoassays with Clq and monoclonal rheumatoid factor. J Clin Invest. 59:990–1001.
- Hewicker M, Kromschröder E, Trautwein G. 1990. Detection of circulating immune complexes in MRL mice with different forms of glomerulonephritis. Zeitsch Versuch. 33:149–156.
- Hori M, Abrass C. 1990. Isolation and characterization of circulating immune complexes from rats with experimental membranous nephropathy. J Immunol. 144:3849–3855.
- Krishna M, Nadler S. 2016. Immunogenicity to biotherapeutics - the role of anti-drug immune complexes. Front Immunol 7:21.
- Lambert P, Dixon F, Zubler R. 1978. A WHO collaborative study for the evaluation of eighteen methods for detecting immune complexes in serum. J Clin Lab Immunol. 1:1–15.
- Lutz H, Stammler P, Jelezarova E, Nater M, Späth P. 1996. High doses of immunoglobulin G attenuate immune aggregate-mediated complement activation by enhancing physiologic cleavage of C3b in C3bn-IgG complexes. Blood. 88:184–193.
- Machida T, Sakamoto N, Ishida Y, Takahashi M, Fujita T, Sekine H. 2018. Essential roles for mannose-binding lectin-associated serine protease-1/3 in the development of lupus-like glomerulonephritis in MRL/lpr mice. Front Immunol. 9:19911.
- Mayadas T, Tsokos G, Tsuboi N. 2009. Mechanisms of immune complex-mediated neutrophil recruitment and tissue injury. Circulation. 120:2012–2024.
- Muratsugu M. 1996. Mechanism of aggregates generated by heating human serum. Biol Pharm Bull. 19:132–135.
- Murphy K, Weaver C. (Eds). 2016. Janeway’s immunobiology. New York (NY): Garland Science.
- Noble B, Steward M, Vladutiu A, Brentjens J. 1987. Relationship of the quality and quantity of circulating anti-BSA antibodies to the severity of glomerulonephritis in rats with chronic serum sickness. Clin Exp Immunol. 67:277–282.
- Pangburn M, Muller-Eberhard H. 1983. Initiation of the alternative complement pathway due to spontaneous hydrolysis of the thioester of C3. Ann NY Acad Sci. 421:291–298.
- Pereira A, Theofilopoulos A, Dixon F. 1980. Detection and partial characterization of circulating immune complexes with solid-phase anti-C3. J Immunol. 125:763–770.
- Rojko JL, Evans MG, Price SA, Han B, Waine G, DeWitte M, Haynes J, Freimark B, Martin P, Raymond JT, et al. 2014. Formation, clearance, deposition, pathogenicity, and identification of biopharmaceutical-related immune complexes: Review and case studies. Toxicol Pathol. 42:725–764.
- Soares N, Santiago M, deCarvalho L. 2001. An improved anti-C3/IgG ELISA for quantification of soluble immune complexes. J Immunol Methods. 249:199–205.
- Stanilova S, Slavov E. 2001. Comparative study of circulating immune complexes quantity detection by three assays-CIF-ELISA, C1q-ELISA, and anti-C3 ELISA. J Immunol Meth. 253:13–21.
- Theofilopoulos A, Dixon F. 1979. The biology and detection of immune complexes. Adv Immunol. 28:89–220.
- van Dam A, Hack C. 1987. Formation of C3-IgG complexes in serum by aggregated IgG and by non-immunoglobulin activators of complement. Immunology. 61:105–110.