
Abstract
Monoclonal antibody (mAb) drugs offer a number of valuable treatments. Many newly developed mAb drugs include artificial modification of amino acid sequences from human origin, which may cause higher immunogenicity to induce anti-drug antibodies (ADA). If the immunogenicity of a new candidate can be understood in the nonclinical phase, clinical studies will be safer and the success rate of development improved. Empirically, in vitro immunogenicity assays with human cells have proved to be sufficiently sensitive to nonhuman proteins, but not to human/humanized mAb. To detect the weaker immunogenicity of human-based mAb, a more sensitive biomarker for in vitro assays is needed. The in vitro study here developed a proliferation assay (TH cell assay) using flow cytometry analysis that can detect a slight increase in proliferating TH cells. Samples from 218 donors treated with a low-immunogenic drug (etanercept) were measured to determine a positive threshold level. With this threshold, positive donor percentages among PBMC after treatment with higher-immunogenicity mAb drugs were noted, that is, 39.5% with humanized anti-human A33 antibody (hA33), 27.3% with abciximab, 25.9% with adalimumab, and 14.8% with infliximab. Biotherapeutics with low immunogenicity yielded values of 0% for basiliximab and 3.7% for etanercept. These data showed a good comparability with previously reported incidences of clinical ADA with the evaluated drugs. Calculations based on the data here showed that a TH cell assay with 40 donors could provide statistically significant differences when comparing low- (etanercept) versus highly immunogenic mAb (except for infliximab). Based on the outcomes here, for screening purposes, a practical cutoff point of 3/20 positives with 20 donors was proposed to alert immunogenicity of mAb drug candidates.
Introduction
Concerns about the immunogenicity of monoclonal antibody (mAb) drugs have been returned recently. Induction of anti-drug antibodies (ADA) against an mAb drug often reduces the therapeutic effects by neutralizing the pharmaceutical activity, altering its pharmacokinetics, or enhancing the drug clearance rates (Li et al. Citation2001; Schellekens Citation2003; Anderson et al. Citation2005). Later generations of mAb drugs, such as humanized or human mAb, were less immunogenic than former murine or chimeric mAb (Hwang and Foote Citation2005). Recently emerging mAb drugs, for example, bi-specific and/or Fc function-engineered IgG formats, include amino acid sequences artificially modified from their original human form. Because these engineered mAb are expected to provide unique and improved efficacy that cannot be achieved with natural mAb, the number of this type of mAb drug being developed has increased.
Tools that predict the clinical immunogenicity of biotherapeutics may reduce the number of drugs found to produce ADA in the later stages of drug development. Although various assay systems have been reported (Chirino et al. Citation2004; Baker et al. Citation2010), they have yet to be fully validated. The in vitro T cells culture assays reported by Baker and Jones (Citation2007) provided some of the most successful results in which the positive donor percentages of market biotherapeutics in the assay correlated well with those that occurred in clinical studies. However, those authors did not disclose details of their experimental procedures, actual measurement values, data handling, and interpretation. Despite several reports of useful assays and the commercial availability of some assays in various Contract Research Organizations (CRO) (Baker and Jones Citation2007; van Walle et al. Citation2007; Joubert et al. Citation2016), none of the in vitro assays has been reported as being successfully applied to recently-marketed humanized mAb pharmaceuticals.
Compared to exogenous proteins, the immunogenicity of human IgG-based mAb is very low. Although in vitro immunogenicity assays in human cells elicited clear positive responses to mouse mAb or nonhuman proteins, the results for human/humanized mAb were ambiguous or negative (Delluc et al. Citation2011), even when the mAb caused a high incidence of formation of ADA in clinical studies. The fundamental process used in various in vitro assays is to incubate peripheral blood mononuclear cells (PBMC) with cytokines to enhance cell viability, then expose the cells to a test article to prime antigen-presenting cells (APC) in the cell mixture and finally observe subsequent activation of any T-cells present by measuring thymidine incorporation and/or cytokine production (Anthony and Lehmann Citation2003; Stickler et al. Citation2004; van Walle et al. Citation2007; Schultz et al. Citation2017). However, thymidine or cytokine readouts after treatment with drug candidate mAb might be compromised by high background signals from various activated cells other than T-cells.
Because helper T-cells (TH cells) are also involved in inducing mAb immunogenicity (Baker et al. Citation2010), we previously suggested that proliferation – specifically of TH cells – was a potentially useful biomarker for use in in vitro immunogenicity assays against mAb pharmaceuticals (Kubo et al. Citation2010). This TH cell proliferation assay (TH cell assay) is a sophisticated in vitro immunogenicity assay based on one developed by Schultz et al. (Citation2017) that focused on examining TH cell proliferation and IL-2 secretion (that was induced by infliximab, adalimumab, rituximab and natalizumab). Schultz et al. (Citation2017) described that the use of enriched CD4+ T cells improved the assay sensitivity. Depletion of CD8+ T cells contributes to an increase of interactions between APC and CD4+ T-cells (Jawa et al. Citation2013). Depletion of CD25+ cells, including T-regulatory (Treg) cells, enhances T cells responses to factor VIII biotherapeutics (Kamaté et al. Citation2007). In the present study, either CD8+ cells or CD25+ cells were depleted to achieve higher sensitivity. By utilizing the TH cell assay here, the current study sought to assess the applicability of the assay in estimating immunogenicity of human/humanized mAb.
Materials and methods
Human cells
Peripheral blood was donated by a total of 319 healthy volunteers after informed consent, as approved by the Research Ethics Committee of Chugai Pharmaceutical Co., Ltd. Blood was collected into 50 ml polystyrene tubes containing heparin sodium (AY Pharmaceuticals, Tokyo, Japan) and anonymized. From each sample, peripheral blood mononuclear cells (PBMC) were isolated using Ficoll-Paque PLUS (GE Healthcare, Chicago, IL) according to manufacturer protocols. Via a magnetic cell-sorting system that employed anti-CD8-conjugated beads (Thermo Fisher Scientific, Waltham, MA), CD8+ cells were removed from the isolated PBMC. From these, cells highly expressing CD25 were then removed using anti-CD25-conjugated beads (Thermo Fisher Scientific). After harvesting, cells were counted using an ADAM MC Auto Cell Counter (Digital Bio Technology, Seoul, South Korea).
While this study collected cells from a total of 319 donors, not all test compounds were evaluated with all 319 donor sets because of differences in the number of PBMC collected from each donor and the importance of using duplicates of a single donor’s PBMC as internal controls when evaluating control substances. Thus, for the study of effects from etanercept, the assay evaluated PBMC from 218 donors. For basiliximab, infliximab, adalimumab, abciximab, and hA33, cells from 20, 54, 54, 22, and 256 donors, respectively, were evaluated. Lastly, to evaluate effects of a positive control (i.e. keyhole limpet hemocyanin [KLH]), a total of 81 samples of PBMC from among the original 319 donor sets was evaluated.
Monoclonal antibodies
The following mAb were purchased for use here: anti-TNFα humanized IgG1 conjugate etanercept (Enbrel, Pfizer Inc., New York, NY), anti-TNFα chimeric IgG1κ infliximab (Remicade, Mitsubishi Tanabe Pharma Corporation, Osaka, Japan), anti-TNFα human IgG1κ adalimumab (Humira, AbbVie GK, Tokyo, Japan), anti-IL-2 receptor chimeric IgG1κ basiliximab (Simulect, Novartis Pharmaceuticals, Basel, Switzerland), and anti-GPIIb/IIIa humanized IgG1κ abciximab (Reopro, Eli Lilly, Indianapolis, IN). Humanized A33 (hA33; anti-human A33 humanized IgG1κ) was generated in-house according to the previously disclosed amino acid sequence of hA33 (International Publication Number. WO94/13805). Solutions in distilled water (Otsuka) were prepared as etanercept (10 mg/ml), infliximab (5 mg/ml), and basiliximab (4.3 mg/ml) and each was stored at −80 °C until use. Adalimumab and abciximab were purchased as working solutions (5.0 and 2.0 mg/ml, respectively). hA33 was prepared at 54.0 mg/ml in a solution of 20 mM histidine/150 mM NaCl (pH 6.0).
Treatment
As the bead-isolated cells, CD8-CD25low PBMC were seeded on a 24-well plate at 2 × 10⁶ cells/ml/well in AIM-V Medium (Life Technologies) containing 3% AB-serum (Sigma, St. Louis, MO) and incubated in a humidified atmosphere of 5% CO2 at 37 °C for 2 hr. Test mAb (diluted in AIM-V Medium containing 3% AB-serum just before use) was then added to designated wells; final assay concentrations tested were 10–100 μg/ml. In assays that used KLH, Mariculture KLH (Thermo Fisher Scientific, Waltham, MA) was used and added to other wells; the final assay concentrations tested were 10–100 μg/ml. Control wells received AIM-V/3% AB-serum medium only. All cells were then cultured for 7 days without changes of the medium.
Measurement of proliferating TH cells
The proliferation of TH cells was scored with a BrdU Flow kit (BD Biosciences, Franklin Lakes, NJ) and one of two flow cytometers, that is, BD FACSCanto™ II or BD FACSCalibur™ (BD Biosciences). The kit consisted of BrdU reagent, fixation solution, permeabilization solution, DNase, and anti-BrdU antibody. On Days 5, 6, and 7 of incubation with the test mAb, 150 μl cell suspension was transferred to a 96-well round-bottomed plate and 10 μM (3 μl/well) of BrdU reagent was added. After a 24-hr incubation, cells in the wells were tagged with anti-CD3, anti-CD4, and anti-CD14 antibody (all BD Biosciences; each at 1:20–1:50 dilution based on manufacturer recommendations). BrdU that had been incorporated into the cells was stained with the kit-provided anti-BrdU antibody.
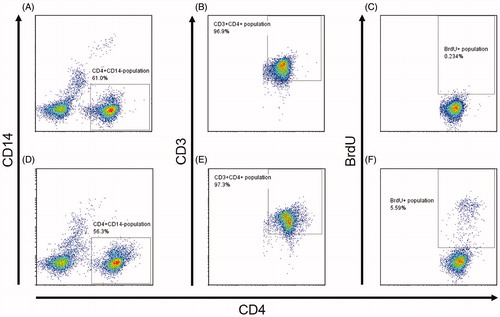
With each test article-treated PBMC population, cells were selected using CD3+CD14-, CD3+CD4+, and BrdU+ gates in the flow systems. This meant all proliferating TH cells were BrdU+CD4+CD3+CD14- (). The BrdU+ gate was located at slightly above the major population of CD4+CD3+CD14-, where BrdU+ cell percentages were ≈ 0.2–0.5% in almost all of non-treatment control wells. In each case, a minimum of 10 000 events/sample was acquired. Throughout, FlowJo v.7.6.2 software (Tomy Digital Biology, Tokyo) was used for data analysis.
Figure 1. Gating strategy of flow cytometry for BrdU+ TH cells in PBMC stained with antibodies against CD3, CD4, and BrdU. (A–C) Representative results for cells with nontreatment control. (D–F) Representative results for cells treated with hA33. (A and D) PBMC gated for CD4+CD14− cells. (B and E) Cells from A and D gated for CD3+. (C and F) Cells from B and E gated for BrdU+. (F) Final selected population is BrdU+CD3+CD4+CD14− that correspond to TH cells that might proliferate in the assays.
Data processing
Stimulation index (SI) values were defined here as the highest quotient of treated wells calculated as the (% proliferating TH cells in each mAb drug-treated well)/(% mean proliferating TH cells in nontreated wells). Based on the distribution of SI values of 218 donor samples that had been treated with etanercept, the values corresponding to the 95% quartile with order statistics was used as the positive threshold in this study. The percentage of samples exceeding the threshold was detected for each mAb drug. Mean or median of the SI for each mAb drug-treated sample was calculated and compared with the threshold. Assuming that the data distribution shows heteroscedasticity, a Chi-square test (p < 0.05) was employed to examine the statistical significance of differences in positive donor percentages between each mAb drug and etanercept. Statistical power analysis was done in order to estimate the number of donors one would need to have a chance of >80% provability to attain statistical significance (p < 0.05) between a given highly-immunogenic mAb and etanercept. Statistical analysis was carried out using JMP Version 11 (SAS Institute Japan Ltd., Tokyo).
Results
Detection of proliferating TH cells by flow cytometry
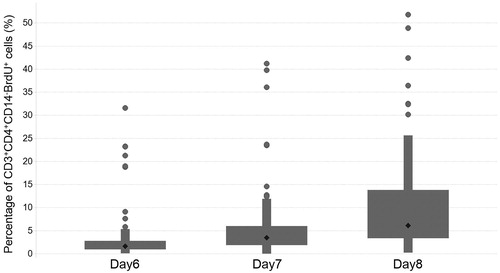
Proliferating TH cells here were recognized as CD3+CD4+CD14-BrdU+ cells. Among the TH cells, the background percentage that were proliferating was < 0.5% (data not shown). In the donors treated with a highly immunogenic protein, that is, keyhole limpet hemocyanin (KLH), the percentage increased in a time-dependent manner (i.e. on Days 6, 7 and 8 of culture) and raised this level to > 1.0% in a total of 81 donor sets tested ().
Figure 2. Time dependency for proliferation of TH cells among PBMC treated with KLH (n = 81 donor samples total tested).
Background levels of BrdU+ TH cells
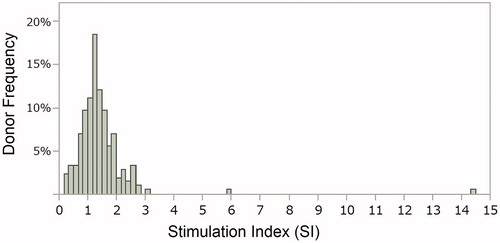
To reduce interference by background signal, a stimulation index (SI) was calculated from the flow cytometric (FCM) values reflecting levels of BrdU+ cells after treatment with etanercept which has a slightly low immunogenic potential. The distribution of the SI in samples from 218 donors used for evaluation of etanercept is shown in . The distribution was examined using the variance test for normality by Shapiro–Wilk, and the p values was less than 0.0001, meaning that the data were not in accordance with normal distribution. The median of the data was 1.29, and the first and third quartile points were 0.98 and 1.63. In a box-and-whisker plot (not shown), there were seven outliers that were > 1.5 times the interquartile range; the SI of these outliers ranged from 2.63–14.47. The 95th percentile of the data was calculated as SI = 2.6; this was used as the positive criterion in this study. Using the criterion, 8/218 donors were classified as positive after treatment with etanercept.
Figure 3. Frequency distribution of Stimulation Index (SI) in response to treatment with etanercept. (n = 218 donor samples total tested).
Responses to mAb with high and low immunogenicity
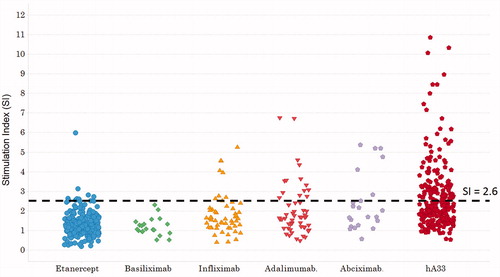
The SI values for cells treated with KLH is indicated in ; those for cells treated with mAb drugs are shown in . The SI in PBMC samples treated with mAb drugs tended to be lower than those treated with KLH. In addition, the percentages of BrdU+ TH cells did not increase in a time-dependent manner over 6–8 days for all the antibody drugs evaluated (data not shown). The SI in the majority of the PBMC samples treated with the each mAb drug stayed within the negative range; none of the SI distributions associated with the mAb was normal. The mean SI value for the weakly-immunogenic mAb drug basiliximab was 1.86, while those for the highly-immunogenic mAb drugs were 1.86 (infliximab), 2.02 (adalimumab), 2.43 (abciximab), and 3.33 (hA33). The median SI after basiliximab, infliximab, adalimumab, abciximab, or hA33 treatment was, respectively, 1.07, 1.64, 1.65, 1.87, or 2.18. The SI achieved with all the highly-immunogenic mAb drugs tested here tended to be highest at treatment concentrations using doses of 100 μg/ml (data not shown). The SI values of samples treated with any mAb drug tested here did not time-dependently increase over 6–8 days. No PBMC samples treated with basiliximab were seen to be positive; the proportion of positive samples attained with infliximab, adalimumab, abciximab, and hA33 was 14.8 (8/54), 25.9 (14/54), 27.3 (6/22), and 39.5% (101/256), respectively. Therefore, the frequency of positive SI ranged from 0–3.7% with the weakly-immunogenic mAb drugs evaluated, whereas it ranged from 14.8–39.5% with the highly-immunogenic ones. When the frequency of positive results was compared (using Chi-square test) between cells treated with etanercept (3.7%) and those with the highly-immunogenic antibodies, the difference was seen to be significant.
Figure 4. Stimulation index (SI) distribution in donor samples treated with KLH (n = 81 donor samples total tested).
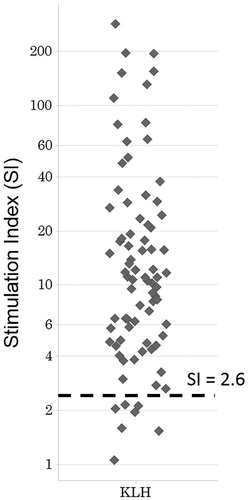
Figure 5. Stimulation index (SI) distribution among PBMC treated with therapeutic mAb. There were n = 218, 20, 54, 54, 22, 256 donor samples total treated with Etanercept, Basiliximab, Infliximab, Adalimumab, Abcicimab, and hA33, respectively.
Calculation of sample size required for statistical significance
Statistical power analysis was performed to compare the percentage of positive samples between the negative reference etanercept and the positive highly-immunogenic mAb drugs (). The number of donors required to achieve statistical significance in the positive responses at 80% statistical power was n = 104 for infliximab, n = 39 for adalimumab, n = 36 for abciximab, and n = 19 for hA33. When 90% power is desired, the required sizes are n = 136 (infliximab), 49 (adalimumab), 45 (abciximab), and 25 (hA33).
Table 1. Estimated sample size for statistical significance of positive response.
Discussion
The results of the current study showed that the positive percentages in the TH cell assay were useful as a helpful parameter to screen for immunogenicity. The mean or median of the SI was not useful because there were little increases evident after treatment with the immunogenic mAb drugs. Considering the reality of mAb drug development, an ADA incidence of < 10% would be acceptable, > 30% would often be unacceptable, and 10–30% would require an evaluation on a case-by-case basis. Thus, values of < 10% could be defined as reflecting low immunogenicity and > 10% as reflecting high immunogenicity in the current study. The highly immunogenic mAb drugs infliximab, adalimumab, abciximab, and hA33 elicited higher positive percentages than the low-immunogenic etanercept and basiliximab (). When the immunogenicity of anti-TNFα mAb in humans was compared with reports of results in healthy volunteers, the incidence of ADA was 0% (0/36) for etanercept, 50% (16/32) for infliximab, and 29% (22/75) for adalimumab (Pharmaceuticals and Medical Devices Agency Citation2002, Citation2005, Citation2008). In the current study, the percentages of positive outcomes in the TH cell assay were 3.7 (8/218), 14.8 (8/54), and 25.9% (14/54), respectively, for these same three agents. The ranking of positive percentages in the TH cell assay did not correspond with the incidence of ADA in clinical studies.
Table 2. Frequency of positive samples for each mAb in the TH cell assay.
Whereas KLH caused a positive response in almost all the donors, there were considerable individual differences in the responses to human/humanized mAb in the TH cell assay. This was consistent with previously reported observations that in most of the clinical studies even a highly immunogenic human/humanized mAb induced ADA in < 50% of patients (). Because the numbers of non-responders is high, many donors were needed in the TH cell assay to find a statistically significant difference between high and low immunogenic mAb. Although 19 donors in each group was sufficient to provide statistical significance for positive percentages between etanercept and hA33 (with 80% reproducibility), it would be necessary to have 49 donors per group to predict the immunogenicity of adalimumab or abciximab at 90% statistical power (). If statistical power is compromised down to 80%, results for hA33, adalimumab, or abciximab will be statistically significant with 40 donors in each group (). Infliximab will need 104 donors for results to be considered statistically significant.
Table 3. Clinical ADA incidence of mAb drugs.
For the practical purpose of screening mAb drug candidates, it seems a highly sensitive assay would be needed to reveal the immunogenic potential of infliximab. Infliximab is a chimeric mAb that consists of murine variable regions and human Fc regions, and ≈ 25% of the whole protein contains non-human amino acid sequences (Elliott et al. Citation1993; Knight et al. Citation1993). In clinical trials, infliximab-derived ADA caused loss of efficacy or hypersensitive reactions (Arora et al. Citation2009; Horiuchi et al. Citation2010; Matucci et al. Citation2013). Whereas the positive frequency in healthy volunteers was 50% (Pharmaceuticals and Medical Devices Agency, Citation2002), infliximab induced a positive response in 14.8% of cases in the TH cell assay here; this was the lowest positive percentage in mAb drugs with high immunogenicity tested (). Therefore, when trying to use the TH cell assay to select drug candidates, donor numbers and the screening threshold should be considered, along with statistical significance.
In comparison, for drug screening, a more practical cutoff point is needed rather than basing decisions solely on statistical significance, a value that is highly dependent on sample size. Based on the outcomes seen in the current study, it is proposed that a more practical cutoff point would be of < 3/20 positives when using 20 donors. The probability of having > 2/20 positives was calculated as 0.04 and 0.00 with weakly immunogenic etanercept and basiliximab, and as 0.59, 0.92, 0.94 and 1.00 with the more highly immunogenic infliximab, adalimumab, abciximab, and hA33, respectively, based on the results in this study. Thus, it was deemed that this cutoff point provided acceptable prediction for screening purposes. When using a 2/20 cutoff point, the calculated positive predictability was improved to 0.82 for infliximab; however, the false positive was elevated to 0.17 for etanercept. Because positive and negative predictability are tradeoffs, the 3/20 cutoff point would appear to be more useful to prevent misdisposition of potential valuable candidate agents/compounds during early screening steps.
The in vitro immunogenicity assay that focuses on the activation of TH cells recently reported by Schultz et al. (Citation2017) was developed by optimizing a standard T-cell assay. The assay provided positive donor percentages of 4% for infliximab, 8% for adalimumab, 19% for rituximab, and 27% for natalizumab. Because the report did not include a low immunogenic reference, it is difficult to compare results with those of the current TH cell assay. However, the results in this and the Schultz study were in good agreement on the following points: (1) focusing on TH cell activation resulted in good sensitivity and (2) infliximab caused a relatively low percentage of positive responses in vitro compared to clinical outcomes reported in the literature. The assay in this study could be a useful tool to screen for highly-immunogenic candidates, though it remains difficult to estimate clinical ADA frequency. The TH cell dependent immune response plays an important role in the induction of ADA (Chirino et al. Citation2004). The results in this study support the usefulness of TH cell specific activation markers in the in vitro immunogenicity assays used to screen mAb drug candidates.
Conclusions
The highly immunogenic mAb drugs that were examined, that is, infliximab, adalimumab, abciximab, and hA33, elicited higher positive percentages than the low-immunogenic test articles etanercept and basiliximab. The results of the studies here suggested TH cell assay could be a useful screening tool to alert investigators to high immunogenicity in mAb drug development.
Acknowledgements
The authors would like to acknowledge Dr. Tomoaki Inoue of Chugai Pharmaceutical and Dr. Tomoyuki Igawa of Chugai Pharmabody Research for invaluable suggestions. The authors also would like to acknowledge Ms. Sally Matsuura of Chugai Pharmaceutical for her technical editing.
Disclosure statement
The authors declare no conflicts of interest. The authors alone are responsible for the content of this manuscript.
References
- Adişen E, Aral A, Aybay C, Gürer MA. 2010. Anti-infliximab antibody status and its relation to clinical response in psoriatic patients: A pilot study. J. Dermatol. 37:708–713.
- Anderson P, Louie J, Lau A, Broder M. 2005. Mechanisms of differential immunogenicity of tumor necrosis factor inhibitors. Curr Rheumatol Rep. 7:3–9.
- Anthony D, Lehmann P. 2003. T-Cell epitope mapping using the elispot approach. Methods. 29:260–269.
- Arora T, Padaki R, Liu L, Hamburger A, Ellison A, Stevens S, Louie J, Kohno T. 2009. Differences in binding and effector functions between classes of TNF antagonists. Cytokine. 45:124–131.
- Asahina A, Nakagawa H, Etoh T, Ohtsuki M. Adalimumab M04-688 Study Group. 2010. Adalimumab in Japanese patients with moderate to severe chronic plaque psoriasis: Efficacy and safety results from a Phase II/III randomized controlled study. J Dermatol. 37:299–310.
- Baert F, Noman M, Vermeire S, Van Assche G, D' Haens G, Carbonez A, Rutgeerts P. 2003. Influence of immunogenicity on the long-term efficacy of infliximab in Crohn's Disease. N Engl J Med. 348:601–608.
- Baker M, Jones T. 2007. Identification and removal of immunogenicity in therapeutic proteins. Curr Opin Drug Discov Devel. 10:219–227.
- Baker M, Reynolds H, Lumicisi B, Bryson C. 2010. Immunogenicity of protein therapeutics: The key causes, consequences and challenges. Self Nonself. 1:314–322.
- Bartelds G, Wijbrandts C, Nurmohamed M, Stapel S, Lems W, Aarden L, Dijkmans B, Tak P, Wolbink G. 2007. Clinical response to adalimumab: Relationship to anti-adalimumab antibodies and serum adalimumab concentrations in rheumatoid arthritis. Ann Rheum Dis. 66:921–926.
- Bendtzen K, Geborek P, Svenson M, Larsson L, Kapetanovic M, Saxne T. 2006. Individualized monitoring of drug bioavailability and immunogenicity in rheumatoid arthritis patients treated with the TNFα inhibitor infliximab. Arthritis Rheum. 54:3782–3789.
- Chirino A, Ary M, Marshall S. 2004. Minimizing the immunogenicity of protein therapeutics. Drug Discov Today. 9:82–90.
- de Vries M, Brouwer E, van der Horst-Bruinsma I, Spoorenberg A, van Denderen J, Jamnitski A, Nurmohamed M, Dijkmans B, Aarden L, Wolbink G. 2009. Decreased clinical response to adalimumab in ankylosing spondylitis is associated with antibody formation. Ann Rheum Dis. 68:1787–1788.
- de Vries M, van der Horst-Bruinsma I, Nurmohamed M, Aarden L, Stapel S, Peters M, van Denderen J, Dijkmans B, Wolbink G. 2009. Immunogenicity does not influence treatment with etanercept in patients with ankylosing spondylitis. Ann Rheum Dis. 68:531–535.
- Delluc S, Ravot G, Maillere B. 2011. Quantitative analysis of the CD4 T-cell repertoire specific to therapeutic antibodies in healthy donors. FASEB J. 25:2040–2048.
- Dery J-P, Braden GA, Lincoff AM, Kereiakes DJ, Browne K, Little T, George BS, Sane DC, Cines DB, Effron MB, et al. 2004. Final results of the ReoPro readministration registry. Am J Cardiol. 93:979–984.
- Elliott M, Maini R, Feldmann M, Long-Fox A, Charles P, Katsikis P, Brennan F, Walker J, Bijl H, Ghrayeb J. 1993. Treatment of rheumatoid arthritis with chimeric monoclonal antibodies to tumor necrosis factor alpha. Arthritis Rheum. 36:1681–1690.
- Gordon K, Gottlieb A, Leonardi C, Elewski B, Wang A, Jahreis A, Zitnik R. 2006. Clinical response in psoriasis patients discontinued from and then reinitiated on etanercept therapy. J Dermatolog Treat. 17:9–17.
- Gottlieb A, Evans R, Li S, Dooley L, Guzzo C, Baker D, Bala M, Marano C, Menter A. 2004. Infliximab induction therapy for patients with severe plaque-type psoriasis: A randomized, double-blind, placebo-controlled trial. J Am Acad Dermatol. 51:534–542.
- Gottlieb AB, Kalb RE, Blauvelt A, Heffernan MP, Sofen HL, Ferris LK, Kerdel FA, Calabro S, Wang J, Kerkmann U, et al. 2012. The efficacy and safety of infliximab in patients with plaque psoriasis who had an inadequate response to etanercept: Results of a prospective, multi-center, open-label study. J Am Acad Dermatol. 67:642–650.
- Hanauer S, Feagan B, Lichtenstein G, Mayer L, Schreiber S, Colombel J, Rachmilewitz D, Wolf D, Olson A, Bao W, et al. 2002. Maintenance infliximab for Crohn's disease: The ACCENT I randomised trial. Lancet. 359:1541–1549.
- Hoffmann J, Hartmann M, Enk A, Hadaschik E. 2011. Autoantibodies in psoriasis as predictors for loss of response and anti-infliximab antibody induction. Br J Dermatol. 165:1355–1358.
- Horiuchi T, Mitoma H, Harashima S, Tsukamoto H, Shimoda T. 2010. Transmembrane TNF-α: Structure, function and interaction with anti-TNF agents. Rheumatology (Oxford). 49:1215–1228.
- Hwang W, Foote J. 2005. Immunogenicity of engineered antibodies. Methods. 36:3–10.
- Jawa V, Cousens L, Awwad M, Wakshull E, Kropshofer H, de Groot A. 2013. T-Cell-dependent immunogenicity of protein therapeutics: Pre-clinical assessment and mitigation. Clin Immunol. 149:534–555.
- Joubert M, Deshpande M, Yang J, Reynolds H, Bryson C, Fogg M, Baker M, Herskovitz J, Goletz T, Zhou L, et al. 2016. Use of in vitro assays to assess immunogenicity risk of antibody-based biotherapeutics. PLoS One. 11:e0159328.
- Kamaté C, Lenting P, van den Berg H, Mutis T. 2007. Depletion of CD4+/CD35hi regulatory T-cells may enhance or uncover factor VIII-specific T-cell responses in healthy individuals. J Thromb Haemost. 5:611–613.
- Knight D, Trinh H, Le J, Siegel S, Shealy D, McDonough M, Scallon B, Moore M, Vilcek J, Daddona P. 1993. Construction and initial characterization of a mouse-human chimeric anti-TNF antibody. Mol Immunol. 30:1443–1453.
- Krathen R, Berthelot C, Hsu S. 2006. Sustained efficacy and safety of infliximab in psoriasis: a retrospective study of 73 patients. J Drugs Dermatol. 5:251–254.
- Krieckaert C, Jamnitski A, Nurmohamed M, Kostense P, Boers M, Wolbink G. 2012. Comparison of long-term clinical outcome with etanercept treatment and adalimumab treat-ment of rheumatoid arthritis with respect to immunogenicity. Arthritis Rheum. 64:3850–3855.
- Kubo C, Hayakawa M, Ito S, Kuramochi T, Iwata Y, Shioda A, Hara T, Inoue T, Mishima M. 2010. Helper T-cell proliferation assay to measure T-cell response to various antibody pharmaceuti-cals. 17th Annual Meeting of Japanese Society of Immunotoxicology; Tsukuba, Japan.
- Lecluse L, Driessen R, Spuls P, de Jong E, Stapel S, van Doorn M, Bos J, Wolbink G. 2010. Extent and clinical consequences of antibody formation against adalimumab in patients with plaque psoriasis. Arch Dermatol. 146:127–132.
- Leonardi C, Strober B, Gottlieb A, Elewski B, Ortonne J, van de Kerkhof P, Chiou C, Dunn M, Jahreis A. 2010. Long-term safety and efficacy of etanercept in patients with psoriasis: An open-label study. J Drugs Dermatol. 9:928–937.
- Li J, Yang C, Xia Y, Bertino A, Glaspy J, Roberts M, Kuter D. 2001. Thrombocytopenia caused by the development of antibodies to thrombopoietin. Blood. 98:3241–3248.
- Mahil S, Arkir Z, Richards G, Lewis C, Barker J, Smith C. 2013. Predicting treatment response in psoriasis using serum levels of adalimumab and etanercept: A single-centre, cohort study. Br J Dermatol. 169:306–313.
- Maini R, Breedveld F, Kalden J, Smolen J, Davis D, Macfarlane J, Antoni C, Leeb B, Elliott M, Woody J, et al. 1998. Therapeutic efficacy of multiple intravenous infusions of anti-TNFα monoclonal antibody combined with low-dose weekly methotrexate in rheumatoid arthritis. Arthritis Rheum. 41:1552–1563.
- Matucci A, Pratesi S, Petroni G, Nencini F, Virgili G, Milla M, Maggi E, Vultaggio A. 2013. Allergological in vitro and in vivo evaluation of patients with hypersensitivity reactions to infliximab. Clin Exp Allergy. 43:659–664.
- Mazilu D, Opriş D, Gainaru C, Iliuta M, Apetrei N, Luca G, Borangiu A, Gudu T, Peltea A, Groseanu L, et al. 2014. Monitoring drug and anti-drug levels: A rational approach in rheu-matoid arthritis patients treated with biologic agents who experience inadequate response while being on a stable biologic treatment. Biomed Res Intl. 2014:1.
- Menter A, Feldman S, Weinstein G, Papp K, Evans R, Guzzo C, Li S, Dooley L, Arnold C, Gottlieb A. 2007. A randomized comparison of continuous vs. Intermittent infliximab maintenance regimens over 1 year in the treatment of moderate-to-severe plaque psoriasis. J Am Acad Dermatol. 56:e1–15.
- Menter A, Tyring S, Gordon K, Kimball A, Leonardi C, Langley R, Strober B, Kaul M, Gu Y, Okun M, et al. 2008. Adalimumab therapy for moderate to severe psoriasis: A randomized, controlled Phase III trial. J Am Acad Dermatol. 58:106–115.
- Papp K, Tyring S, Lahfa M, Prinz J, Griffiths C, Nakanishi A, Zitnik R, van de Kerkhof P, Melvin L. 2005. A global Phase III randomized controlled trial of etanercept in psoriasis: Safety, efficacy, and effect of dose reduction. Br J Dermatol. 152:1304–1312.
- Paramarta J, Baeten D. 2014. Adalimumab serum levels and antidrug antibodies towards adalimumab in peripheral spondyloarthritis: No association with clinical response to treatment or with disease relapse upon treatment discontinuation. Arthritis Res Ther. 16:R160.
- Pharmaceuticals and Medical Devices Agency. Summary of Common Technical Document for Etanercept. Approved January 19, 2005.
- Pharmaceuticals and Medical Devices Agency. Summary of Common Technical Document for Infliximab. Approved January 17, 2002.
- Pharmaceuticals and Medical Devices Agency. Summary of Common Technical Document for Adalimumab. Approved April 16, 2008.
- Reich K, Nestle F, Papp K, Ortonne J, Evans R, Guzzo C, Li S, Dooley L, Griffiths C. 2005. Infliximab induction and maintenance therapy for moderate-to-severe psoriasis: A phase III, multicentre, double-blind trial. Lancet. 366:1367–1374.
- Ritter G, Cohen L, Williams C, Richards E, Old L, Welt S. 2001. Serological analysis of human anti-human antibody responses in colon cancer patients treated with repeated doses of humanized monoclonal antibody A33. Cancer Res. 61:6851–6859.
- Sandborn W, Hanauer S, Rutgeerts P, Fedorak R, Lukas M, MacIntosh D, Panaccione R, Wolf D, Kent J, Bittle B, et al. 2007. Adalimumab for maintenance treatment of Crohn's disease: Results of the CLASSIC II trial. Gut. 56:1232–1239.
- Sands B, Anderson F, Bernstein C, Chey W, Feagan B, Fedorak R, Kamm M, Korzenik J, Lashner B, Onken J, et al. 2004. Infliximab maintenance therapy for fistulizing Crohn's Disease. N Engl J Med. 350:876–885.
- Schellekens H. 2003. Immunogenicity of therapeutic proteins. Nephrol Dial Transplant. 18:1257–1259.
- Schultz H, Reedtz-Runge S, Backstrom B, Lamberth K, Pedersen C, Kvarnhammar A, Consortium A. 2017. Quantitative analysis of the CD4+ T-cell response to therapeutic antibodies in healthy donors using a novel T-cell: PBMC assay. PLoS One. 12:e0178544.
- Stickler M, Rochanayon N, Razo O, Mucha J, Gebel W, Faravashi N, Chin R, Holmes S, Harding F. 2004. An in vitro human cell-based assay to rank the relative immunogenicity of proteins. Toxicol. Sci. 77:280–289.
- Takahashi H, Tsuji H, Ishida-Yamamoto A, Iizuka H. 2013. Plasma trough levels of adalimumab and infliximab in terms of clinical efficacy during the treatment of psoriasis. J Dermatol. 40:39–42.
- Tcheng J, Kereiakes D, Lincoff A, George B, Kleiman N, Sane D, Cines D, Jordan R, Mascelli M, Langrall M, et al. 2001. Abciximab readministration: Results of ReoPro re-administration registry. Circulation. 104:870–875.
- Torii H, Nakagawa H. Japanese Infliximab Study investigators. 2010. Infliximab monotherapy in Japanese patients with moderate-to-severe plaque psoriasis and psoriatic arthritis. A random-ized, double-blind, placebo-controlled multicenter trial. J Dermatol Sci. 59:40–49.
- Torii H, Nakagawa H. Japanese Infliximab Study investigators. 2011. Long-term study of infliximab in Japanese patients with plaque psoriasis, psoriatic arthritis, pustular psoriasis and psoriatic erythroderma. J Dermatol. 38:321–334.
- Tyring S, Gordon K, Poulin Y, Langley R, Gottlieb A, Dunn M, Jahreis A. 2007. Long-term safety and efficacy of 50 mg of etanercept twice weekly in patients with psoriasis. Arch Dermatol. 143:719–726.
- US Food and Drug Administration. 2001. SIMULECT Supplement BLA, Proposed Labeling. Released March 19, 2001.
- US Food and Drug Administration. 2013. Reopro, Abciximab, Label information. November 26, 2013.
- van Kuijk A, de Groot M, Stapel S, Dijkmans B, Wolbink G, Tak P. 2010. Relationship between the clinical response to adalimumab treatment and serum levels of adalimumab and anti-adalimumab antibodies in patients with psoriatic arthritis. Ann Rheum Dis. 69:624–625.
- van Walle I, Gansemans Y, Parren P, Stas P, Lasters I. 2007. Immunogenicity screening in protein drug development. Expert Opin Biol Ther. 7:405–418.
- Vermeire S, Noman M, van Assche G, Baert F, D'Haens G, Rutgeerts P. 2007. Effectiveness of concomitant immunosuppressive therapy in suppressing formation of antibodies to infliximab in Crohn's disease. Gut. 56:1226–1231.
- Welt S, Ritter G, Williams C, Cohen LS, Jungbluth A, Richards EA, Old LJ, Kemeny NE. 2003. Preliminary report of a Phase I study of combination chemotherapy and humanized A33 antibody immunotherapy in patients with advanced colorectal cancer. Clin Cancer Res. 9:1347–1353.
- West R, Zelinkova Z, Wolbink G, Kuipers E, Stokkers P, van der Woude C. 2008. Immunogenicity negatively influences the outcome of adalimumab treatment in Crohn's disease. Aliment Pharmacol Ther. 28:1122–1126.
- Wolbink G, Vis M, Lems W, Voskuyl A, de Groot E, Nurmohamed M, Stapel S, Tak P, Aarden L, Dijkmans B. 2006. Development of anti-infliximab antibodies and relationship to clinical response in patients with rheumatoid arthritis. Arthritis Rheum. 54:711–715.
- Zisapel M, Zisman D, Madar-Balakirski N, Arad U, Padova H, Matz H, Maman-Sarvagyl H, Kaufman I, Paran D, Feld J, et al. 2015. Prevalence of TNF-α blocker immunogenicity in psoriatic arthritis. J Rheumatol. 42:73–78.