
Abstract
Germ-free animals (GF) are those without a microbiome since birth. This particular biological model has become one of special interest with the growing evidence of importance of the microbiome in the life, development, adaptation, and immunity of humans and animals in the environments in which they live. Anatomical differences observed in GF compared with conventionally-reared animals (CV) has given rise to the question of the influence of commensal microflora on the development of structure and function (even immunological) of the bowel. Only recently, thanks to achievements in microscopy and associated methods, structural differences can be better evaluated and put in perspective with the immunological characteristics of GF vs. CV animals. This study, using a GF rat model, describes for the first time the possible influence that the presence of commensal microflora, continuously stimulating mucosal immunity, has on the collagen scaffold organization of the colon mucosa. Significant differences were found between CV and GF mucosa structure with higher complexity in the CV rats associated to a more activated immune environment. The immunological data suggest that, in response to the presence of a microbiome, an effective homeostatic regulation in developed by the CV rats in healthy conditions to avoid inflammation and maintain cytokine levels near the spontaneous production found in the GF animals. The results indicated that collagen scaffold adapted to the immune microenvironment; therefore, it is apparent that the microbiome was able to condition the structure of the colon mucosa.
Introduction
The role of intestinal microbiota both in healthy conditions and in various human diseases, including inflammatory bowel diseases (IBD), cancer, autoimmune disorders and increased susceptibility to infections, has started to be intensively studied in recent decades. Many reports underline how the combined action of the various bacteria that colonize the bowel, through their antigens and metabolic products, can play multiple roles in the body, including immune regulation and possible prevention/acceleration of diseases (Guarner and Malagelada Citation2003; Tojo et al. Citation2014; Blander et al. Citation2017). Altered composition of the colon microflora, termed dysbiosis, is associated with modulation of differentiation, migration, and function of mucosal and immune cells in the large bowel that increase the risk of colorectal cancer or IBD (Ni et al. Citation2017; Roy and Trinchieri Citation2017). On the other hand, selected types of bacteria were found to have a positive impact on functions of gut-associated lymphoid tissue (Tlaskalová-Hogenová et al. Citation1983; Cebra Citation1999; Christensen et al. Citation2002; Umesaki Citation2014). Therefore, an evaluation of the microbiome and its effects on the tissues, organs and, globally, on the organism, represents an important field of investigation in human and animal physiopathology (Barko et al. Citation2018).
Under normal physiological conditions, the mucosa-associated immune system is continously activated in conventional animals (CV) because of the presence of commensal microflora. This is demonstrated by the constant cellular infiltration in the CV bowel mucosa (also indicated as a “physiological inflammation”), not present at that level in the mucosa of germ-free (GF) animals (Tlaskalova-Hogenova et al. Citation2005). To prevent damage to a host’s own tissues, the mucosal system has an ability to maintain local homeostasis by impeding commensal bacteria translocation through the mucosa (which, in turn, would generate a classic inflammatory response). This homeostasis also permits the tolerance of immunogenic products of non-pathogenic microflora and so mitigates effects at both the local and systemic levels (Haneberg et al. Citation1995; Maaser and Kagnoff Citation2002; Tlaskalová-Hogenová et al. Citation2004, Citation2011; Dubois et al. Citation2005). Reflective of this is that in the first days after the birth of CV animals, the lymphatic tissue is intensively activated––as evident by the increasing presence of immune cells in the appendix and in Peyer´s patches (Carter and Collins Citation1975; Waksman and Ozer Citation1976). In turn, cells from Peyer´s patches migrate in the mucosa, ultimately leading to formation of the so-called “gut-associated lymphoid tissue (GALT)” (Mestecky et al. Citation1978; Citation1980; Hall Citation1980).
A different route of evolution of GALT occurs in GF animals due to the absence of a microbiome (Sterzl Citation1979). In GF animals, Peyer´s patches are underdeveloped and show a lower intra-mucosal lymphocyte infiltration due to the lower antigenic stimulation compared to that in CV animals (Tlaskalová-Hogenová et al. Citation1983). Further, compared to under CV conditions, in these GF hosts, the lymph nodes, spleen and liver display lower weight, while the cecum is much larger and with a thin wall (Khlystova Citation1976; Vannucci et al. Citation2008). The stimulation of GF animals using known antigens or bacterial strains, with consequent activation of immunity, has become an important tool to studying the adaptation of immune structures and the development of immune responses under the selected conditions (i.e., gnotobiology) (Pollard and Sharon Citation1970; Sterzl et al. Citation1987).
Interestingly, since the early years of GF animal preparation and study, it appeared that when a bacterial colonization was occurring, the bowel acquired an aspect and activity like in the CV animals. This illustrated the importance of microbiota in sustaining bowel structure and function, effects that at the beginning were considered secondary to metabolic modifications (Freter and Abrams Citation1972; Pesti Citation1979; Koopman et al. Citation1984). At present, with the continuously growing knowledge about the mucosal immune system, the importance of investigating the relationships between structures and immunity in the colon appears more relevant.
Accordingly, we hypothesized that immune stimulation chronically induced by commensal microflora may directly influence local tissue structure, with effects on both gross morphology of the bowel and on the microscopic structure of the mucosa, in particular influencing collagen organization. The latter (re: deposition and re-organization) is involved in tissue re-modelling under inflammatory conditions (especially chronic inflammation), as well as in wound healing, and cancer (Diegelmann and Evans Citation2004; von Lampe et al. Citation2000; Madsen et al. Citation2017). The studies reported here document that commensal microflora in CV rats increase the complexity of the collagen scaffold. These studies also, for the first time, show that the collagen architecture significantly differs in CV rats from that in GF rats, and links the differences to the microbiome-activated immunity in the bowel mucosa of CV animals.
Materials and methods
Experimental animals
All experiments were performed using inbred male Wistar-AVN (F89) rats, reared in the animal colony of the Institute of Physiology of the Czech Academy of Sciences (CAS) in Prague under pathogen-free conditions (Zidek Citation1968; Jurcovicova et al. Citation1984; Stepankova et al. Citation1995). Part of these rats was used to produce germ-free animals in the Laboratory of Gnotobiology of the Institute of Microbiology of the CAS (Nový Hrádek, Czech Republic). The CV rats were housed under normal conditions in the animal facility of the Institute of Microbiology of the CAS in Prague. Nutrition by standard ST-1 pellet diet and water intake were without restrictions. The GF rats were obtained by the standard procedure developed by the Laboratory of Gnotobiology (Khlystova Citation1976; Vannucci et al. Citation2008). In brief, this consisted of the harvest of the uterus of a pregnant rat female at term, under general anesthesia and with subsequent sacrifice. After washing in antiseptic solution, the uterus was transferred to a sterile transparent Trexler-type plastic incubator. Here the new-borns were delivered by Cesarean section and then immediately passed into a communicating sterile incubator (definitive place of their rearing). Initially, the rats were hand-fed every 3-4 hr with a specifically formulated milk diet; this was subsequently substituted with a standard pellet diet with controlled endotoxin content that had been sterilized by irradiation (59 kGy). Throughout the entire experiment, the GF rats were maintained inside the sterile incubators at a constant 60% relative humidity and temperature of 22 °C, under filtered air flux. The GF rats had ad libitum access to the diet and filtered water. Weekly tests for sterility were regularly performed on samples of feces/other materials that were collected and cultivated for the presence of bacteria and fungi (Stepankova Citation1979; Sterzl Citation1979; Vannucci et al. Citation2008). All experiments were performed according to the rules of the European Convention for the Care and Use of Laboratory Animals as approved by the Czech Animal Care and Use Committee and by the Institutional Ethical Committee.
Design of experiment
At 6-8-wk-of-age, rats (≈150 g BW; 15 CV and 10 GF) were euthanized by exanguination under general anesthesia (0.8% chloralium hydrate). The collected blood was used for mononuclear cell separation and flow cytometric (FACS) analysis of lymphocyte sub-populations. Gross examination of internal organs was performed and spleen and mesenteric lymph nodes (MLN) were harvested. Part of each sample was used for obtaining immune cells for FACS analysis and part was snap-frozen in liquid N2 for later tissue analysis. The large bowel was isolated, removed, longitudinally opened to remove stools, and washed with cold saline. Colon samples were taken either for immediate confocal microscopy evaluation on fresh tissue or fixed in 10% buffered formalin for standard histology. Colon mucosa samples were collected by gentle scraping with a glass slide and put into cryo-centrifuge tubes, snap-frozen in liquid N2 and stored at −80 °C for use later in protein analysis.
Peripheral blood mononuclear cell (PBMC) and splenic mononuclear cell preparation
Spleen and heparinized peripheral blood samples were collected at sacrifice and kept on ice before isolation of leukocytes. Spleen samples were homogenized in 3 ml of FACS PBS (PBS + 0.1% gelatin and 0.02% sodium azide) solution. All samples, including blood, were then centrifuged in QUICK mode (1000 rpm) and supernatants were removed. The pelleted cells in each sample were then washed three times with H-MEMD (10 ml) and then centrifuged at 1550 rpm for 5 min. The pelleted cells were re-suspended in H-MEMD and then separated over a Telebrix-Ficoll mix by centrifugation (2080 rpm, 25 min, 25 °C). The layer/buffy coat containing lymphocytes was removed, washed three times in H-MEMD, and then re-suspended in 5 ml H-MEMD. The cells were then counted using Turk´s solution (50 µl suspension to 950 µl Turk´s solution) and counted in a Bürker chamber.
Fluorescence-activated cell sorting (FACS) analysis
Aliquots of the cell suspensions were placed in wells of 96-well plates (at 5 × 10⁵ cells/well). FACS-PBS containing 10% rat serum autologous (10 µl) was added to each well and the plates were incubated for 20 min on ice. The plate was centrifuged (1680 rpm, 2 min, 25 °C) and resulting supernatants removed. The pellets were then treated with a panel of primary monoclonal antibodies against rat CD3, CD4, CD8a, and CD25 (BD Pharmingen, San Diego, CA) as well as NKRP-1 (Invitrogen, Boston, MA), each with distinct fluorescent labeling. After a 30-min incubation on ice, the plates were centrifuged (1680 rpm, 2 min, 25 °C), well super-natant was removed, and the pelleted cells in each well washed three times each with 200 µl FACS PBS. For labeling with a secondary antibody, the same steps were performed, followed by three washings. Finally, the pellets in each well were re-suspended in 60 µl FACS PBS before 10 µl propidium iodide (PI; Sigma, St. Louis, MO) was added to visualize dead cells before flow cytometry was performed on a Becton-Dickinson LSR II system (Becton-Dickinson, Princeton, NJ) using system associated software. A minimum of 50,000 events/sample was acquired.
For the evaluation of lymphocyte sub-populations, all single cells were gated for live cells; lymphogate was then applied by scattering cell type identification, and ultimately the cells were then gated for CD3± and NKR-P1± cells. Sub-populations were then gated and analyzed for specific marker expression as: NK cells (CD3−NKRP-1+), CD4+ NKT cells (CD3+NKRP-1+CD4+CD8−), all T-cells (CD3+NKRP-1−), T-helper (TH) cells (CD3+NKRP-1−CD4+CD25−), T-cytotoxic CD8+ cells (CD3+NKRP-1−CD4−CD8+), and T-regulatory (Treg) cells (CD3+NKRP-1−CD4+CD25high).
Confocal microscopy analysis
Second harmonic generation (SHG) technique was used for investigation of collagen fiber structures. For this, a Leica TCSSP2 AOBS confocal laser scanning microscope (based on a DM IRE2 inverted microscope) equipped with an argon laser (Leica Microsystems, Wetzlar, Germany) was employed. A 20X magnification by water immersion plan apochromatic objective HC PL APO CS (WD 5 250 lm, NA 5 0.7) was applied; this yielded sufficient resolution while offering a relatively large field of view for general structure evaluation. A 43X apochromatic objective was used for obtaining images at higher magnification. In some cases, to further analyze particular fields of interest found during the 20X observations, a digital zoom was used. For visualization of reflection (reflectance mode-RM) in the tissues, excitation wavelengths of 488, 514, and 633 nm were applied, singularly or in various combinations. The triple combination permitted to obtain histology-like images from unstained, fresh tissue. The reflected signal was detected in up to three corresponding channels, using a detection wavelength range of 478-498, 504-524, or 623-643 nm, respectively. Auto-fluorescence of non-stained tissues was detected by 2-photon microscopy at 860 nm, which implied an expected detection of SHG signal at a 430 nm wavelength (Chernyavski et al. 2009). The detection of an SHG signal was checked by changing the excitation wavelength to 800 nm, and then detecting the emitting signal by setting up a band pass filter for 400 nm.
Finally, image analysis was performed to obtain objective measurement of the collagen scaffold organization (Levy et al. Citation2015; Gao et al. Citation2018). The intensity of each pixel in a given microscopic field was analyzed using Image J software (NIH, Bethesda, MD). The analysis was applied for defining various parameters (integrated density [ID], inter-cryptal space, distance between centers of crypts, and skewness) characterizing the mucosal structure and the collagen scaffold. At least five representative fields were examined in each image; a minimum of five samples were taken for each colon.
Isolation of proteins and ELISA assay
Protein lysates were prepared according to the manufacturer´s protocol. In brief, 400 µl of tissue extraction buffer T-PER (Thermo Scientific, Waltham, MA) containing the protease inhibitors Complete Mini and Pierce Protease Inhibitor to protect samples from spontaneous degradation (1 tablet/10 ml T-PER buffer [Roche Diagnostics GmbH, Mannheim, Germany and Thermo Scientific). Tissue samples were then homogenized on Lysing Matrix D ceramic balls (MP Biomedicals, Irvine, CA) using a FastPrep-24 Instrument (MP Biomedicals) in two cycles of 60-sec homogenization at 6.5 m/s. The vials were then centrifuged (15,000 rpm, 15 min) and resultant supernatants collected and stored at −80 °C for later analysis.
The analyses were performed according to manufacturer protocols in a reaction volume of 100 µl/well and measured in a doublet. For this, all samples were weighed and lysed with 400 µl lysing buffer/mg sample. The concentration of proteins in the lysate was checked using a UV/VIS NanoPhotometer P300 system (Implen GmbH, Munich, Germany) and adjusted by addition of lysing buffer to achieve a final concentration of 2.5 mg/ml. Results for each sample were then extrapolated from standard curves, and presented as pg/ml. The ELISA kits used were for rat: interleukin (IL)-1α (eBioscience, San Diego, CA), IL-6 (R&D Systems, Minneapolis, MN), transforming growth factor (TGF)-β1 (Thermo Scientific), and interferon (IFN)-γ (PeproTech, Cranbury, NJ). All plates were analyzed using a Multiskan Ascent ELISA plate reader (Thermo Scientific).
Histology and immunohistochemistry
Samples were fixed with in 10% buffered formalin solution for 24 hr before paraffin embedding. Slices (3-5-μm thick) were cut from each sample using a microtome, transferred to standard slides (Bamed, Litvínovice, Czech Republic), and stained with haematoxylin-eosin solution (DiaPath, Martinengo, Italy). Serial slices were cut and transferred to special silanized positive slides (DAKO, Glostrup, Denmark). Collagen structures were detected using picrosirius staining (Sirius Red kit, DiaPath). All final preparations were evaluated by two independent certified pathologists using an Olympus Provis BX50 light microscope (Tokyo, Japan); pictures were taken using an Olympus DP 70 camera with QuickPhoto Micro 23 program (Promicra, Prague, CZ).
Statistical evaluation
All results are expressed as means ± SEM. Differences in distributed parameters between groups were compared using a non-parametric unpaired Mann-Whitney test with a two-tailed P-value calculation. Differences were considered statistically significant at p ≤ 0.05. All data were analyzed using Prism software (v.5.0, GraphPad, San Diego, CA).
Results
Microscopic aspects of the Colon mucosa in GF versus CV rats
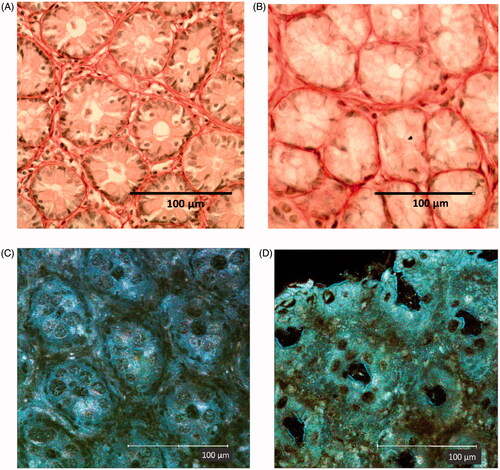
Differences in the colon mucosa of rats reared under either GF or CV conditions were evaluated using classical histology, including picrosirius staining to visualize the collagen matrix in the samples and by direct imaging of unstained fresh samples using laser scanning confocal microscopy. In this case, the reflectance mode (RM) in 1-photon confocal microscopy was used to obtain histology-like images; the second harmonic generation (SHG) in multi-photon confocal imaging was used to assess the collagen mucosal scaffold. The results showed the different impact of microbiome on the constitution of the colon mucosa. In RM imaging, looking to the most superficial aspect of the mucosa not washed of the mucus (immediately in contact with the glass) it was possible to distinguish a presence of bacteria within the mucus in the CV rat () that was not present in the GF hosts (). The different mucosal environment induced differences in the immune cell distribution and in the stroma organization (). In the inter-cryptal spaces, a larger number of immune cells could be seen in the colon with microbiota in comparison with the section of the axenic colon mucosa, with a ratio around 3:1. The picrosirius staining evidenced a better organized and more complex network of the collagen scaffold under CV than under GF conditions where it appeared to be less regular and with lower complexity. Using the RM technique in confocal microscopy on fresh tissue, it was possible to see similar aspects of the crypts—with a larger opening subtly layered by mucus in the GF mucosa (). The inter-cryptal spaces were better defined and more symmetric in the mucosa samples from the CV hosts than from the GF ones.
Figure 1. Surface of rat colon mucosa with mucus in CV- and GF-reared animals. (A) CV rat colon mucosa with evidence of bacteria (also evidenced in circle and by arrows). (B) GF rat colon mucosa with no evidence of bacteria. Confocal microscopy was performed on fresh samples using RM imaging. Original magnification = 43X.
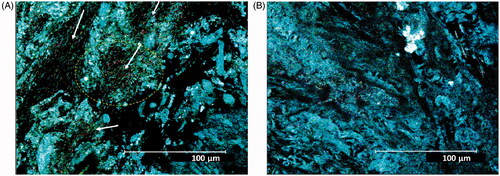
Figure 2. Transversal section of colon mucosa in (A, C) CV and (B, D) GF rats. The represent-ative images show differences in the inter-cryptal spaces and organization of the collagen fibers (see text). The immune cells in the spaces within the crypts (A,B: dark dots) are more represented in the CV rat mucosa (in accordance with a presence of commensal microflora) than in the GF rat mucosa. (C,D) Aspect of mucosa in fresh samples examined by confocal microscopy reflectance mode technique. (A and B) Samples are colon mucosa sections with picrosirius staining of collagen (red). Magnification = 40X.
Better confirmation of the histological findings was obtained by further evaluation of the collagen scaffold characteristics using the SHG in multi-photon confocal microscopy to evaluate freshly harvested, unfixed, and unstained samples (), and subsequent image analysis (). The images confirmed a well-developed and regular organization of the collagen scaffold in the mucosa of the CV rats, while less elaborated structures were seen in samples from the GF rats. In CV rats, the collagen architecture appears constituted by a tiny and complex network of collagen fibers producing a diffuse sustain around the crypts. The structure was also organized to create slots that could allow positioning of immune cell inside inter-cryptal spaces. The scaffold organization in the GF mucosa similarly appeared as a fiber networking around and within the crypts, but with less complexity in its general architecture, with a more rough constitution (). This disparity is well illustrated also by different aspect of the largely developed and complicated framework of the intra-mucosal lymphatic follicles in the CV rat versus a less developed and structurally less elaborated architecture in the GF rats. This could be put in relation to the larger accumulation of lymphatic cells in the CV rat colon than in the GF colon ().
Figure 3. Collagen scaffold of left colon mucosa in (A, C) CV and (B, D) GF rats using SHG in multiphoton confocal microscopy. (A,B) Structure of collagen scaffold sustaining crypts is shown. (C,D) Intra-mucosal lymphatic follicles are shown. Different complexity and collagen fiber conformation is evident between microbiome-trained mucosa vs. axenic mucosa. (E,F) Same place in RM in 1-photon confocal microscopy. (G,H) Other intra-mucosal follicles confirming the lower complexity and dimension of the structure in (H) GF rat mucosa are shown. (I) Sample in A is imaged by RM, and then merged with SHG image (here in yellow). Degree to which immune cells are in relation with/oriented by disposition of the scaffold fibrous structure is evident. (J) Immune cells can find a place in limited numbers and in tight contact inside slots created by complex structure of well-developed intra-mucosal follicles of CV rats. (A, I) CV left colon mucosa, magnification 43X. (B) GF left colon mucosa (43X). (C, E) CV Left colon follicle (20X). (D, F) GF Left colon follicle (43X). (G) CV Right colon follicle (20X). (H) GF right colon follicle (43X). (I) RM imaging, 1-photon confocal microscopy merged with SHG image (original magnification 43X). (J) Merged RM, SHG imaging and fluorescence detection of Draq5 nuclear staining of immune cells performed on fresh tissue: particular of a lymphatic follicle in CV left colon mucosa (original magnification 63X).
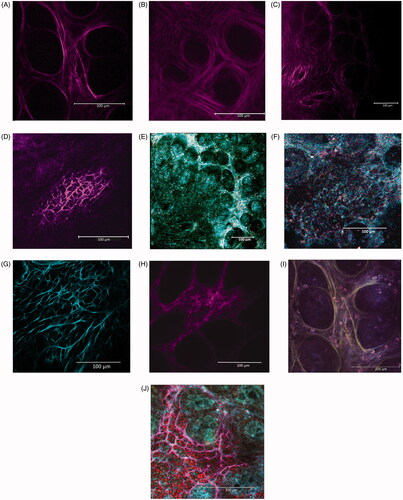
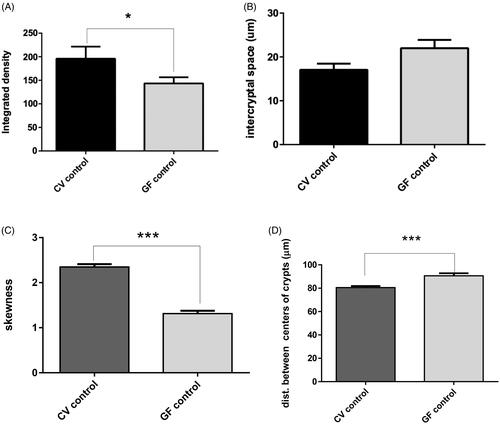
Figure 4. Imaging results. Confocal imaging was analyzed by various criteria, from which integrated density values were found to be significantly higher in CV rats (p = 0.0209). Distances between centers of the crypts were significantly higher in GF rats (p = 0.0007). The opposite trend was found in skewness, which was higher in CV rats (p < 0.0001). Differences in inter-cryptal spaces between CV and GF rats were non-significant. Significance: *p < 0.05, **p < 0.01, and ***p < 0.001.
The organization of the collagen scaffold in the CV rat mucosa can offer a suitable support to the locally active immune cells () and the subdivision of follicles in small chambers could allow grouping of a limited number of cells together. The images suggest the importance that the structural organization of the collagen net may have to facilitate activated cell migration as well as cell-cell interactions (). It would seem that the relationship between immunity and tissue structure development appears to allow for more efficient immune cell activity and interactions.
Image analysis confirmed the microscopy observations showing significant values for the collagen fiber signal (integrated density) and its matrix complexity (skewness), both being greater in the CV vs. in the GF rat mucosa (). Tighter inter-cryptal spaces and consequently a reduced distance between the centers of the crypts indicated a more compact organization of the colon mucosa in the CV rats (). These results indicated that the continuous presence of bacteria and the constant immune activation due to their presence have influence on the structural organization of the colon mucosa.
Baseline production of cytokines in Colon mucosa, spleen, and mesenteric lymph nodes
Select cytokines involved in inflammatory (e.g., IL-1α, IFNγ, IL-6) and regulatory (e.g., TGFβ1) responses—as well as involved in induction of tissue re-modelling, were evaluated by ELISA. Specifically, these analyses sought to quantify the spontaneous, natural, unstimulated production of cytokines in the healthy animals. Proteins were extracted from samples of the right and left colon mucosa, spleen and mesenteric lymph nodes (see Methods). Full mucosa samples were used to globally evaluate the local microenvironment. Comparison between right and left colon in CV and GF hosts was done to detect possible constitutive differences unrelated to any presence of a local microbiome.
Colon mucosa
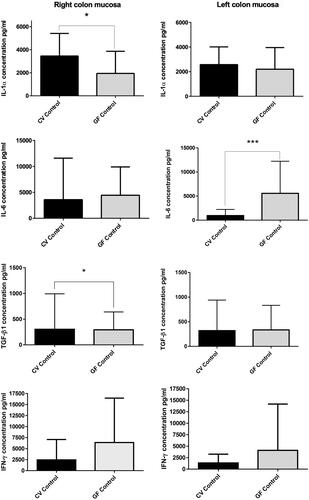
The production of the evaluated cytokines () did not show significant differences between the right and left colon mucosa either under CV or GF conditions, except for the IL-6 in the CV rats. In that case, the IL-6 level in the CV left colon was lower than in the right colon, but the difference was not significant. In contrast, when comparing the CV and GF rats, levels of IL-1α were significantly higher in the CV right colon. Levels of IFNγ were down-regulated in the CV in comparison to GF rats in both compartments, but the change did not reach significance. Compared to in the GF rats, IL-6 was found at similar levels in the right colon, but significantly down-regulated in the CV left colon (p = 0.0006). TGFβ1 was found at almost the same levels in both sites and under both conditions, albeit though that it was seen to be significantly increased in the CV right colon vs. in the GF counterpart (p = 0.0305).
Figure 5. Spontaneous cytokine levels. Right and left colon of CV and GF rats (full mucosa samples). IL-1α production was significantly higher in right colon mucosa of CV rats (p = 0.0131); same trend was found in TGFβ1 production (p = 0.0305), while IL-6 was significantly higher in left colon mucosa of GF rats. Differences in the production of other cytokines were non-significant. Data reported as pg/ml. Significance: *p < 0.05, **p < 0.010 and ***p < 0.001.
Spleen
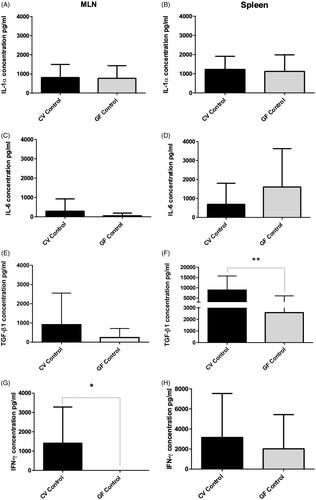
Levels of IL-1α, IL-6, IFNγ, and TGFβ1 were also in the spleen homogenates (). While no significant differences were found in levels of the pro-inflammatory cytokines between the CV and GF rats, a significant difference was found for TGFβ1, with much higher levels in the CV than in the GF rats (p = 0.0016). The elevated TGFβ1 production could explain a non-increase in pro-inflammatory cytokines (especially IL-6) in the CV hosts, despite any ongoing stimulations by intestinal microflora. Consequently, it could be suggested that the spleen might be involved in the general homeostatic regulation that permits a co-existence of the microbiome with the host organism.
Figure 6. Spontaneous cytokine levels. (A, C, E, G) Mesenteric lymph nodes and (B, D, F, H) Spleen of CV and GF rats. Significant differences in production were found for TGFβ1 and IFNγ; TGFβ1 was higher in spleen of CV rats (p = 0.0016) and IFNγ was higher in MLN of CV rats (p = 0.021). Data reported as pg/ml. Differences in production of cytokines in other tissues were non-significant. Significance: *p < 0.05, **p < 0.01, and ***p < 0.001.
Mesenteric lymph nodes (MLN)
Levels of IL-1α, IL-6, and TGFβ1 evaluated in MLN isolated from the rats did not reveal any significant differences between the CV and GF rats () even though there was more variability among their levels in the CV than in the GF rats. A sign of immune activation by microbiota resulted in increased IFNγ production in the CV rats as compared with a negligible production seen in the GF hosts (p = 0.0211). The levels of IL6 in the CV rat MLN were relatively higher than in GF animals, though the difference was not significant.
FACS analysis
Blood
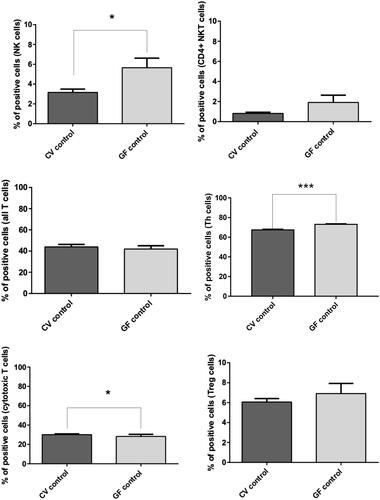
The main differences in lymphocyte sub-populations in the peripheral blood () of CV and GF rats was a prevalence of NK and NKT cells in the GF animals (p = 0.0191 for NK cells). In the T-cell compartment, no differences were found in CD3+ cell population (All T-cells), while CD8+ cells were slightly more represented in the CV rats (p = 0.0465) and CD4+ cells were significantly higher in the GF rats (p < 0.0001). No significant differences were found for CD4+CD25high Treg cell values.
Figure 7. FACS analysis of immune cell sub-populations in peripheral blood of CV and GF rats. Analysis of immune cells showed significantly higher populations of NK cells in GF rats (p = 0.019); same trend was found for TH cells (p < 0.0001), while levels of cytotoxic T-cells were slightly higher in CV rats (p = 0.0465). Differences in other immune cell sub-populations were not significant. Significance: *p < 0.05, **p < 0.01, and ***p < 0.001.
Spleen
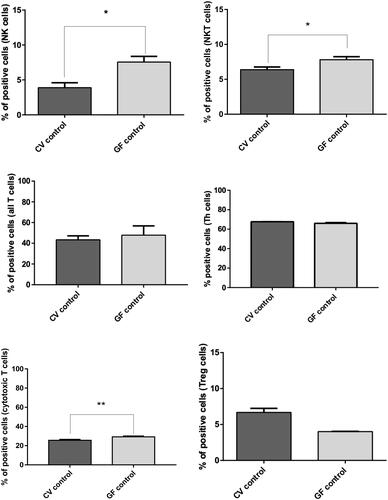
Compared to in the spleens of CV rats (), GF rats presented with a significantly higher number of NK cells (p = 0.0381) and NKT cells (p = 0.0221). No significant differences were found at the T-cell level, with the exception of CD8+ cells (p = 0.0095). The levels of Treg cells were greater in spleens of the CV animals, though the difference did not reach statistical significance (still suggesting a role for immune homeostasis in the presence of microbiome).
Figure 8. FACS analysis of immune cell sub-populations in spleens of CV and GF rats. Analysis of immune cells revealed a significantly higher population of NK (p = 0.038) and NKT (p = 0.022) cells in the GF rats. The opposite trend was observed for cytotoxic T-cells, i.e., higher in CV rats (p = 0.0095). Differences in other immune cell sub-populations were non-significant, even though Treg cells appeared basically more represented in CV rats. Significance: *p < 0.05, **p < 0.01, and ***p < 0.001.
Discussion
The anatomical differences in the bowel under CV and GF conditions suggest that dynamic relationships between the intestinal microbiota and both local and systemic immunity are able to influence the structures of the intestinal wall. Previous observations by various authors showed changes in the GF bowel anatomy after bacterial colonization, with conversion to CV animal characteristics. Therefore, the presence of the commensal microflora was considered an efficient factor for shaping the bowel anatomy (Freter and Abrams Citation1972; Pesti Citation1979; Koopman et al. Citation1984). The idea of a relationship between different bacterial strains and collagenolytic activity was also recently reported by Guyton et al. (Citation2019). In the present study, whether in GF or CV hosts immunological conditions may have a possible role in shaping the colon mucosa structure was investigated.
The current study also looked at possible immunological differences between the right and left colon, due to their different physiology and microflora (Donaldson et al. Citation2016; Flynn et al. Citation2018; James et al. Citation2020). Spontaneous cytokine production in the colon mucosa of CV and GF rats only displayed mild differences. Similar results were found in the comparisons between the two parts of the colon under each condition. The most relevant variation noted was a down-regulation of pro-inflammatory cytokines IL-6 and IFNγ especially in the CV left colon mucosa and the higher production of TGFβ1 in the CV spleen. What was new and significantly different here were the findings about the organization of the collagen scaffold, i.e., it was less structured in the colon of GF rats than in CV rats, especially at the level of intra-mucosal lymphatic follicles. Taken together, these results indicated that the microbiome could influence cytokine production at the local and systemic level (spleen) and had effects on the organization of the collagen scaffold in the colon mucosa. Moreover, the mild differences found between the two conditions suggested intensive regulatory activity in the healthy CV colon that is able to avoid inflammation (approaching the basic cytokine production seen in the GF rats).
Many studies have described how gut microflora can impact on the immunological asset of the bowel mucosa, even with effects on the whole organism (Cebra Citation1999; Haneberg et al. Citation1995; Biancone et al. Citation2002; Pickard et al. Citation2004; Tlaskalová-Hogenová et al. Citation2004). Gut immune maturation depends on the composition of microbiota (Chung et al. Citation2012). Collagen is an important component of the mucosa structure and furnishing a scaffold able to be re-modelled by microenvironmental changes, including inflammatory processes that, when chronic, can bring about fibrosis. A difference in collagen synthesis between CV and GF rats was already described in a bowel anastomosis model by Mastboom et al. (Citation1989). After performing an ileal anastomosis, those authors found hydroxyproline concentration was increased in CV but not in GF rats, where it was even reduced. One may hypothesize that metabolic and signaling products of the bacteria were able to influence fibroblasts in the colon mucosa, which are the main source of collagen fibers (Hooper et al. Citation2012 Narayanan et al. 1989; Wang et al. Citation2019; Jurgensen et al. Citation2020). Bacteria and their strain can differently affect the intestinal fibrosis process and fibroblast activation as shown by Jacob et al. (Citation2018) in an experimental model where stool from mice with defined microflora was transplanted into GF mice. This model also indicated the importance of the microbiome in influencing collagen deposition and how it may be associated with immuno-logical modulation.
The second harmonic generation (SHG) in multiphoton confocal microscopy technique has contributed greatly to the evaluation of collagen (and elastin) components in tissues (Chernyavski et al. 2009). SHG permits a direct approach to fresh (unfixed and unstained) samples to obtain more realistic picture of structures in their natural context. By image analysis, it is also possible to reveal measurable differences in collagen scaffold organization (Strupler et al. Citation2007; Campagnola Citation2011). Applied to the samples in the present study, the analyses confirmed there was a significantly lower complexity of collagen architecture in the GF rat colon mucosa compared to the more elaborated structures in the CV rats (already suggested by picrosirius staining in regular histology). Interestingly, the SHG imaging revealed that the collagen fibers in the CV rats created a fibrous network with free spaces, like slots, in which a limited number of immune cell infiltrates could evolve. These structures, never described before, were less represented in the GF inter-cryptal spaces and were more evident in the well-developed CV lymphatic follicles (see ). These novel data further underscore that the intestinal microbiome and activated immunity can have an impact on colon tissue development and structural organization. It is plausible to hypothesize these spaces may allow more efficient migration and homing of immune cells in CV rats, possibly enhancing cell-cell interactions and providing a support to the immune responses elicited by microbes that are present.
A greater presence of IL-1α was found in the CV colon mucosa, while that for TGFβ1 was almost similar in both CV and GF rats. The opposite trend was found regarding IL-6 and IFNγ levels—which were lower in CV than in GF rats, indicating a down-regulation of these inflammatory cytokines in the presence of commensal microflora. These differences in cytokine expression in the CV rats may be explained even by a direct effect of bacteria which play an important role in regulation of immune responses (Levy et al. Citation2015; Gao et al Citation2018). Interest-ingly, the presence of these cytokines in distal immune organs (spleen, MLN) was higher in the CV rats; the only exception appeared to be IL-6 in the spleen (values were lower in CV than in GF rats samples). Such data suggest that IL-6, important in gut inflammation, is intensively inhibited in CV animals; the same explanation may be applied to IFNγ expression in the colon mucosa. Based on the present results, the mechanism of this local inhibition does not appear directly dependant on the presence of TGFβ1, as might be expected; therefore, a more complex network remains to be clarified.
The levels of TGFβ1—an important regulatory cytokine with inhibitory effects—were similar in both the CV and GF rat mucosa. This suggests to us that the regulatory network controlling “physiological inflammation” in the mucosa of CV rats required a more integrated intervention by other cytokines and molecular processes than only TGFβ1 (e.g., IL-10, IL-4, IL-13). Nevertheless, the higher TGFβ1 levels measured in the spleen of CV rats indicated this organ was involved in systemic immune regulation that allowed for a co-existence of the microbiome in the host. Lastly, no significant differences in cytokine presence between the left and right colon mucosa were noted, except for IL-6, which was lower in the CV left colon than in the right side. This may be associated to the microbiota colonizing the left colon, since in GF rats no differences at all were observed between the two compartments. The influence of how different compositions of the microbiome in the left and right colon could give rise to variations in local levels of cytokines has previously been reported (Samanta et al. Citation2012; Donaldson et al. Citation2016; Flynn et al. Citation2018; Tropini et al. Citation2017; James et al. Citation2020).
The FACS analyses performed here confirmed there was a higher proportion of NK, NKT and CD4+ cells in the blood of GF rats, indicating a more prevalent innate cell immunity. Another Wistar-AVN model displayed the same trend in higher NK cells population in GF rats (Vannucci et al. Citation2008). This observation may be explained by the fact that GF animals have less stimulated adaptive immunity in the absence of continuous challenge by microbiota and related metabolites. As some authors have noted, microbiota can regulate the immune and inflammatory responses of diverse cellular compartments in the gut both directly and indirectly (Kabat et al. Citation2014; Palm et al. Citation2015).
Conclusions
The data here show for the first time that the presence of bacteria in the bowel mucosa of CV rats has a direct impact on microscopic scaffolds in the tissue in relation to the local immune environment. They also suggest that in this rat model, there is a presence of an effective immune regulation in the colon mucosa of CV animals likely required to avoid host inflammatory responses to the local microbiota. These findings can help investigators to better understand the microflora-induced modulation of the local immunity in association with any impact on colon tissue structure, both under physiologic and pathologic conditions. The interaction of the colon mucosa with the intestinal microbiome in CV rats—since birth, the continuous challenge by bacterial antigens and, consequently, a constant immune activation in the mucosa, may “educate” both local immunity and the collagen scaffold (with evident effects on its structure). It would be reasonable to suggest that the collagen scaffold complexity in CV rats could provide for better mucosal barrier functions, and even support more efficient immune cell homing and interactions.
Disclosure statement
No potential conflict of interest was reported by the authors.
Correction Statement
This article has been corrected with minor changes. These changes do not impact the academic content of the article.
Additional information
Funding
References
- Barko P, McMichael M, Swanson K, Williams D. 2018. The gastrointestinal microbiome: A review. J Vet Intern Med. 32(1):9–25.
- Biancone L, Monteleone I, del Vecchio Blanco G, Vavassori P, Pallone F. 2002. Resident bacterial flora and immune system. Digest. Liver Dis. 34(S2):S37–S43.
- Blander J, Longman R, Iliev I, Sonnenberg G, Artis D. 2017. Regulation of inflammation by microbiota interactions with the host. Nat Immunol. 18(8):851–860.
- Campagnola P. 2011. Second harmonic generation imaging microscopy: Applications to diseases diagnostics. Anal Chem. 83(9):3224–3231.
- Carter P, Collins F. 1975. Peyer's patch responsiveness to Salmonella in mice. J. Reticulo-Endothel. Soc. 17:38–46.
- Cebra J. 1999. Influences of microbiota on intestinal immune system development. Am J Clin Nutr. 69(5):1046S–1051S.
- Chernyavski O, Vannucci L, Bianchini P, Difato F, Saieh M, Kubinova L. ́ 2009. Imaging of mouse experimental melanoma in vivo and ex vivo by combination of confocal and nonlinear microscopy. Microsc Res Tech. 72(6):411–423.
- Christensen H, Frokiaer H, Pestka J. 2002. Lactobacilli differentially modulate expression of cytokines and maturation surface markers in murine dendritic cells. J Immunol. 168(1):171–178.
- Chung H, Pamp S, Hill J, Surana N, Edelman S, B, Troy E, Reading N, Villablanca E, Wang S, Mora J, et al. 2012. Gut immune maturation depends on colonization with a host-specific microbiota. Cell. 149(7):1578–1593.
- Diegelmann R, Evans M. 2004. Wound healing: An overview of acute, fibrotic and delayed healing. Front Biosci. 9:283–289.
- Donaldson G, Lee S, Mazmanian S. 2016. Gut biogeography of the bacterial microbiota . Nat Rev Microbiol. 14(1):20–32.
- Dubois B, Goubier A, Joubert G, Kaiserlian D. 2005. Oral tolerance and regulation of mucosal immunity. Cell Mol Life Sci. 62(12):1322–1332.
- Flynn K, Ruffin M, Turgeon D, Schloss P. 2018. Spatial variation of the native colon microbiota in healthy adults. Cancer Prev Res (Phila)). 11(7):393–402.
- Freter R, Abrams G. 1972. Function of various intestinal bacteria in converting germfree mice to the normal state . Infect Immun. 6(2):119–126.
- Gao J, Xu K, Liu H, Liu G, Bai M, Peng C, Li T, Yin Y. 2018. Impact of the gut microbiota on intestinal immunity mediated by tryptophan metabolism. Front Cell Infect Microbiol. 8:13
- Guarner F, Malagelada J. 2003. Gut flora in health and disease. Lancet. 361(9356):512–519.
- Guyton K, Levine Z, Lowry A, Lambert L, Gribovskaja-Rupp I, Hyman N, Zaborina O, Alverdy J. 2019. Identification of collagenolytic bacteria in human samples: screening methods and clinical implications for resolving and preventing anastomotic leaks and wound Complications. Dis Colon Rectum. 62(8):972–979.
- Hall J. 1980. An essay on lymphocyte circulation and the gut. Monogr Allergy. 16:100–111.
- Haneberg B, Kendall D, Amerongen H, Apter F, Neutra M. 1995. The colon and rectum as inductor sites for local and distant mucosal immunity. Adv Exp Med Biol. 371A:107–109.
- Hooper L, Littman D, Macpherson A. 2012. Interactions between the microbiota and the immune system. Science. 336(6086):1268–1273.
- Jacob N, Jacobs JP, Kumagai K, Ha CWY, Kanazawa Y, Lagishetty V, Altmayer K, Hamill AM, Von Arx A, Sartor RB, et al. 2018. Inflammation-independent TL1A-mediated intestinal fibrosis is dependent on the gut microbiome. Mucosal Immunol. 11(5):1466–1476.
- James K, Gomes T, Elmentaite R, Kumar N, Gulliver E, King H, Stares M, Bareham B, Ferdinand J, Petrova V, et al. 2020. Distinct microbial and immune niches of the human colon. Nat Immunol. 21(3):343–353.
- Jurcovicova J, Vigas M, Klir P, Jezova D. 1984. Response of prolactin, growth hormone and corticosterone secretion to morphine administration or stress exposure in Wistar-AVN and Long Evans rats. Endocrinol Exp. 18(4):209–214.
- Jurgensen H, van Putten S, Norregaard K, Bugge T, Engelholm L, Behrendt N, Madsen D. 2020. Cellular uptake of collagens and implications for immune cell regulation in disease. Cell Mol Life Sci. 77(16):3161–3176.
- Kabat A, Srinivasan N, Maloy K. 2014. Modulation of immune development and function by intestinal microbiota. Trends Immunol. 35(11):507–517.
- Khlystova Z. 1976. Lymph node and spleen morphology in gnotobiotic rats. Biull Eksp Biol Med. 81(5):619–621.
- Koopman JP, Kennis HM, Mullink JW, Prins RA, Stadhouders AM, De Boer H, Hectors MP. 1984. 'Normalization' of germfree mice with anaerobically cultured caecal flora of 'normal' mice. Lab Anim. 18(2):188–194.
- Levy M, Thaiss CA, Zeevi D, Dohnalová L, Zilberman-Schapira G, Mahdi JA, David E, Savidor A, Korem T, Herzig Y, et al. 2015. Microbiota-modulated metabolites shape the intestinal microenvironment by regulating NLRP6 inflammasome signaling. Cell. 163(6):1428–1443.
- Maaser C, Kagnoff M. 2002. Role of the intestinal epithelium in orchestrating innate and adaptive mucosal immunity. Z Gastroenterol. 40(7):525–529.
- Madsen D, Jürgensen H, Siersbaek M, Kuczek D, Cloud L, Liu S, Behrendt N, Grøntved L, Weigert R, Bugge T. 2017. Tumor-associated macrophages derived from circulating inflammatory monocytes degrade collagen through cellular uptake. Cell Rep. 21(13):3662–3671.
- Mastboom W, Hendriks T, de Boer H. 1989. Collagen changes around intestinal anastomoses in germ-free rats. Br J Surg. 76(8):797–801.
- Mestecky J, McGhee J, Crago S, Jackson S, Kilian M, Kiyono H, Babb J, Michalek S. 1980. Molecular-cellular interactions in secretory IgA response. J Reticuloendothel Soc. 28(Suppl):45s–60s.
- Mestecky J, McGhee J, Michalek S, Arnold R, Crago S, Babb J. 1978. Concept of the local and common mucosal immune response. Adv Exp Med Biol. 107:185–192.
- Narayanan A, Page R, Swanson J. 1989. Collagen synthesis by human fibroblasts. Regulation by transforming growth factor-beta in the presence of other inflammatory mediators. Biochem J. 260(2):463–469.
- Ni J, Wu J, Albenberg L, Tomov V. 2017. Gut microbiota and IBD: Causation or correlation? Nat Rev Gastroenterol Hepatol. 14(10):573–584.
- Palm N, de Zoete M, Flavell R. 2015. Immune-microbiota interactions in health and disease. Clin Immunol. 159(2):122–127.
- Pesti L. 1979. Intestinal microflora: Elimination of germ-free characteristics by components of the normal microbial flora. Comp Immunol Microbiol Infect Dis. 1(3):141–152.
- Pickard K, Bremner A, Gordon J, MacDonald T. 2004. Microbial-gut interactions in health and disease. Immune responses. Best Pract Res Clin Gastroenterol. 18(2):271–285.
- Pollard M, Sharon N. 1970. Responses of the Peyer's Patches in germ-free mice to antigenic stimulation. Infect Immun. 2(1):96–100.
- Roy S, Trinchieri G. 2017. Microbiota: A key orchestrator of cancer therapy. Nat Rev Cancer. 17(5):271–285.
- Samanta A, Torok V, Percy N, Abimosleh S, Howarth G. 2012. Microbial fingerprinting detects unique bacterial communities in the fecal microbiota of rats with experimentally-induced colitis. J Microbiol. 50(2):218–225.
- Stepankova R. 1979. Rearing germ-free rats and rabbits. Folia Microbiol. (Praha). 24:11–15.
- Stepankova R, Mara M, Ocenaskova J. 1995. Prolonged survival of AVN Wistar rats with transplanted Yoshida sarcoma and increase of granular lymphocytes after administration of Bacillus firmus and their crude lipids. Folia Microbiol. (Praha). 40:413–416.
- Sterzl J. 1979. Gnotobiological models and methods in immunology. Folia Microbiol (Praha)). 24(1):58–69.
- Sterzl J, Mandel L, Stĕpánková R. 1987. The use of gnotobiological models for the studies of immune mechanisms. Nahrung. 31(5-6):599–608.
- Strupler M, Pena A, Hernest M, Tharaux P, Martin J, Beaurepaire E, Schanne-Klein M. 2007. Second harmonic imaging and scoring of collagen in fibrotic tissues. Opt Express. 15(7):4054–4065.
- Tlaskalová-Hogenová H, Stepánková R, Hudcovic T, Tucková L, Cukrowska B, Lodinová-Zádníková R, Kozáková H, Rossmann P, Bártová J, Sokol D, et al. 2004. Commensal bacteria (normal microflora), mucosal immunity and chronic inflammatory and autoimmune diseases. Immunol Lett. 93(2-3):97–108.
- Tlaskalová-Hogenová H, Stěpánková R, Kozáková H, Hudcovic T, Vannucci L, Tučková L, Rossmann P, Hrnčíř T, Kverka M, Zákostelská Z, et al. 2011. The role of gut microbiota (commensal bacteria) and the mucosal barrier in the pathogenesis of inflammatory and autoimmune diseases and cancer: contribution of germ-free and gnotobiotic animal models of human diseases . Cell Mol Immunol. 8(2):110–120.
- Tlaskalová-Hogenová H, Sterzl J, Stĕpánkova R, Dlabac V, Vĕticka V, Rossmann P, Mandel L, Rejnek J. 1983. Development of immunological capacity under germfree and conventional conditions . Ann N Y Acad Sci. 409:96–113.
- Tlaskalova-Hogenova H, Tuckova L, Mestecky J, Kolinska J, Rossmann P, Stepankova R, Kozakova H, Hudcovic T, Hrncir T, Frolova L, et al. 2005. Interaction of mucosal microbiota with the innate immune system. Scand J Immunol. 62(S1):106–113.
- Tojo R, Suárez A, Clemente M, de los Reyes-Gavilán C, Margolles A, Gueimonde M, Ruas-Madiedo P. 2014. Intestinal microbiota in health and disease: Role of bifidobacteria in gut homeostasis. World J Gastroenterol. 20(41):15163–15176.
- Tropini C, Earle K, Huang K, Sonnenburg J. 2017. The gut microbiome: Connecting spatial organization to function. Cell Host Microbe. 21(4):433–442.
- Umesaki Y. 2014. Use of gnotobiotic mice to identify and characterize key microbes responsible for the development of the intestinal immune system. Proc Jpn Acad Ser B Phys Biol Sci. 90(9):313–332.
- Vannucci L, Stepankova R, Kozáková H, Fiserova A, Rossmann P, Tlaskalova-Hogenova H. 2008. Colorectal carcinogenesis in germ-free and conventionally-reared rats: Different intestinal environments affect the systemic immunity. Intl J Oncol. 32(3):609–617.
- von Lampe B, Barthel B, Coupland S, Riecken E, Rosewicz S. 2000. Differential expression of matrix metalloproteinases and their tissue inhibitors in colon mucosa of patients with inflammatory bowel disease . Gut. 47(1):63–73.
- Waksman B, Ozer H. 1976. Specialized amplification elements in the immune system. The role of nodular lymphoid organs in the mucous membranes. Prog Allergy. 21:1–113.
- Wang G, Huang S, Wang Y, Cai S, Yu H, Liu H, Zeng X, Zhang G, Qiao S. 2019. Bridging intestinal immunity and gut microbiota by metabolites. Cell Mol Life Sci. 76(20):3917–3937.
- Zidek Z. 1968. Karyotypes of four inbred strains of rats: AVN, BP, LEW, WP. Folia Microbiol. (Praha). 14:74–79.