
Abstract
Multiple sclerosis (MS) causes neurologic disabilities that effect musculature, sensory systems, and vision. This is largely due to demyelination of nerve fibers caused by chronic inflammation. Corticosteroid treatments ameliorate symptoms of MS, but do not successfully cure the disease itself. In the current study, the application of galangin, a phytochemical flavonoid extracted from the ginger family of Alpinis officinarum, on experimental autoimmune encephalomyelitis (EAE; mouse model for MS) was explored. This study investigated prophylactic and therapeutic activity of the drug and mechanisms by which it acts. The results revealed that galangin at 40 and 80 mg/kg could lower the incidence rate of MS, and alleviate clinical/pathological manifestations. Mice administered galangin presented with less limb paralysis, lower levels of inflammatory cell infiltrates, and decreased demyelination compared to vehicle controls. Levels of CD4+IFNγ+ (TH1) and CD4+IL-17A+ (TH17) cells in the spinal cords of EAE mice administered galangin were reduced and both cell types were not capable of expansion. More surprisingly, galangin inhibited antigen presentation and cytokine production by dendritic cells (DC). Formation of cytokines like IL-6, IL-12, and IL-23 were significantly decreased due to galangin in co-culture models of DC and T-cells. Taken together, the data lead one to conclude that galangin could potentially be used as a potent immunoregulatory agent to alleviate clinical symptoms and reduce the prevalence of MS.
Introduction
Multiple sclerosis (MS) is an autoimmune disease where central nervous system (CNS) nerve cells are damaged due to a chronic inflammation that leads to of nerve fiber demyelination. MS patients, typically between ages 20 and 40, present with various neurologic disabilities that can impact vision, muscle function, sensation, and coordination (Reich et al. Citation2018). The precise pathogenesis of MS is not clear, but studies suggest that intrinsic (e.g. genetic) and environmental (e.g. viral infection) factors could contribute to its onset (Kadowaki and Quintana Citation2020). Specific MS effectors include, human leukocyte antigen (HLA) loci (such as HLA-DRB1 on chromosome 6), viral infections, or Vitamin D deficiency (Amirzargar et al. Citation1998; Sintzel et al. Citation2018; Tarlinton et al. Citation2020). Regardless of the risk factors that initiate the onset of MS, the disease progression is always mediated and enhanced by aberrant immune responses in the CNS.
Dendritic cells (DC) play a crucial role in modulating and orchestrating human immune responses, particularly cellular immunity. In the context of MS pathogenesis, DC could trigger auto-reactive T-cell responses via presentation of myelin-derived epitopes and through secretion of cytokines that polarize T-cell differentiation into T-helper (TH)-1 and TH17 cells (Fletcher et al. Citation2010). Myelin-reactive T-cells migrate from the peripheral tissue to the CNS where they are reactivated by resident antigen-presenting cells (APC) like microglial cells and astrocytes. Upon activation, these APC release more pro-inflammatory cytokines, such as interferon (IFN)-γ and interleukin (IL)-17, ultimately resulting in the continuing damage to/destruction of the myelin on axons (Wang et al. Citation2018).
Galangin (3,5,7-trihydroxyflavone) is a phytochemical flavonoid isolated from Alpinis officinarum, a plant of the ginger family, and also from honeybee propolis (Quiroga et al. Citation2006). It was previously shown that galangin could impart neuroprotective/anti-inflammatory effects in the CNS. Specifically, galangin was reported to inhibit production of tumor necrosis factor (TNF)-α, IL-6, nitric oxide, and reactive oxygen species (ROS) from poly(I:C)-stimulated microglia cells, events that simulate RNA viral infection in the CNS; this was achieved via suppression of NF-κB activity and phosphorylation of Akt pathways (Choi et al. Citation2017). Other studies revealed galangin could reduce production of IL-1β and induce nitric oxide synthase in microglia cells activated by lipopolysaccharide via suppression of NF-κB and MAPK pathways (Jung et al. Citation2014; Kim et al. Citation2019). In fact, the NF-κB pathway has been shown to be activated in MS patients and EAE animals and contributes substantially to MS pathogenesis (Pahan and Schmid Citation2000; Housley et al. Citation2015). Because oxidative stress also has an implied role in the pathogenesis and severity of MS, this emphasizes the potential need for identifying effective anti-oxidants to combat MS (Gilgun-Sherki et al. Citation2004; Ohl et al. Citation2016). Considering the molecular bases associated with MS pathogenesis, galangin stood out as a promising therapeutic to explore in an MS model.
When rodent models were treated with galangin, the drug acted as a neuroprotection agent that reduced the breakdown of the blood-brain barrier, enhanced cortical blood flow, and improved neurological behaviors following induction of acute ischemic stroke. This could be related to the ability of galangin to cause vasodilation as well as due to its anti-oxidant activity (Li et al. Citation2012; Wu et al. Citation2015). Given these activities associated with galangin, it was hypothesized here that galangin could be a potential agent to alleviate MS. Accordingly, the present study investigated the interplay between immune cells (including DC and T-cells) in response to galangin. This study also evaluated the potential neuroprotective effects of galangin in vivo in a myelin oligodendrocyte glycoprotein (MOG)-induced experimental autoimmune encephalomyelitis (EAE) murine model
Materials and methods
Chemicals and reagents
Galangin (> 98% purity) was purchased from Guangdong Huanan Pharmaceutical Group (Guangdong, China). MOG 35-55 peptide (MEVGWYRSPFSRVVHLYRNGK) used to induce experimental autoimmune encephalomyelitis (EAE) in mice was synthesized by Genescript (Piscataway, NJ). Complete Freund’s adjuvant (CFA), pertussis toxin (PTX), glyceryl trioctanoate (GT), and dimethyl sulfoxide (DMSO) were all purchased from Sigma (St. Louis, MO). Mycobacterium tuberculosis H37RA was purchased from BD Biosciences (Franklin Lakes, NJ, USA).
Animals
C57BL/6 mice (female, 8-wk-old, 18–20 g) were purchased from the National Laboratory Animal Center (Taipei, Taiwan). All mice were housed in pathogen-free facilities maintained at 23 °C with a 60% relative humidity and a 12-hr light:dark cycle, and had ad libitum access to standard rodent chow and filtered water. All mice were acclimatized for 1 wk prior to use in the studies. All experimental procedures were approved by and conducted under the regulations of the National Chung Hsing University Committee on Animal Research and Care (#109-085).
Experimental design
To induce EAE, MOG peptide (200 µg/mouse) was first emulsified with 200 μl CFA containing 5 mg/ml of M. tuberculosis H37Ra. A volume of 200 µl of the emulsified peptide solution was then subcutaneously injected into the dorsal epidermis of the mice. Thereafter, on Days 0 and 2 post-immunization (dpi), mice received a dose of 200 ng pertussis toxin via intra- peritoneal (IP) injection. One dedicated set of mice was not treated to induce EAE. The EAE mice were then randomly allocated into four groups and orally administrated vehicle solvent or galangin once daily from 0 to 28 dpi depending on the experimental design: vehicle control EAE mice (10% DMSO + 90% GT), and galangin-treated EAE mice (galangin in DMSO-GT) to achieve body burdens of 20, 40, or 80 mg galangin/kg body weight. The normal healthy control mice only received the DMSO-GT regimen in parallel. During the treatment, vital signs (such as body weight, issues with movement, etc.) were examined daily and the mice were scored for disease severity ranging from 0 to 5: i.e. 0 = no deficit; 1 = tail paralysis; 2 = incomplete hind limb paralysis; 3 = complete hind limb paralysis; 4 = complete hind limb paralysis and partial forelimb paralysis; and, 5 = moribund state/death (Urban et al. Citation1988). All mice were euthanized by asphyxiation with CO2 on Day 28 dpi and biosamples were collected for analyses.
Cytokine measurements
At necropsy, the spleen of each mouse was aseptically-harvested and single-cell suspension prepared. In brief, each spleen was filtered through a sterile 50-mesh stainless steel mesh and then red blood cells present were lysed using commercial RBC lysing buffer (Sigma). After washing by centrifugation, the splenocytes were re-suspended in RPMI 1640 supplemented with 10% fetal bovine serum (FBS) and 50 μg gentamicin/ml (all ThermoFisher Scientific, Waltham, MA), as well as with 2-mM glutamine (Sigma), and 50-μM 2-mercaptoethanol (Amresco, Cleve- land, OH, USA). Cell concentrations were determined in a hemocytometer. Thereafter, aliquots of splenocytes were placed in 6-well plates (2 × 10⁶/well) and received either medium or were stimulated by addition of 25 µg MOG 35–55/ml for 3 d at 37 °C. At the end of this period, culture supernatants were collected and levels of cytokines (TNFα, IL-6, IL-12 p70) and chemokines (MCP-1, MIP-1α) in the medium were analyzed using specific anti-mouse ELISA kits from PeproTech (London, UK).
Reverse transcription-quantitative PCR (RT-qPCR)
Splenic CD11c+ dendritic cells (DC) were isolated from the starting suspensions using positive selection with CD11c microbeads (Miltenyi Biotec, Auburn, CA, USA) according to manufacturer protocols. After the isolation, the total RNA from the cells was extracted using an RNeasy Plus Mini Kit (QIAGEN, Valencia, CA). Levels of specific cytokine mRNA were evaluated in an ABI Prism 7500 Sequence Detection System (Applied Biosystems, Foster City, CA, USA) using SYBR Green Master Mix (Roche, Basel, Switzerland). All data were normalized to glyceraldehyde 3-phosphate dehydrogenase (GAPDH) expression levels and evaluated using the 2−ΔΔCt method (Schmittgen and Livak Citation2008). Primers used to amplify the cDNA of IL-6, IL-12, IL-10, and IL-23 were designed based upon previous published sequences (listed in Supplemental Table 1; Siwkowski et al. Citation2004; Bleau et al. Citation2016; Li et al. Citation2015, Citation2016; Ma et al. Citation2017).
Histological analysis
At necropsy, spinal cord tissues were collected from the mice. While some of the material was used for flow cytometry (see below), remaining tissue was fixed in 4% paraformaldehyde in 0.1 M PBS (phosphate-buffered saline, pH 7.4). After de-paraffinization and re-hydration, the samples were embedded in paraffin and tissue sections (5 μm) prepared. The sections were then stained with hematoxylin and eosin (H&E) or luxol fast blue (LFB) to permit evaluation of inflammatory cell infiltration or demyelination, respectively, using a light microscope. All slides were examined for outcome severity levels in a blinded manner.
Flow cytometry
Infiltrating mononuclear cells (MNC) were from the isolated spinal cord tissues following perfusion with PBS to remove peripheral blood. The single MNC suspensions were separated over 70–30% Percoll (Sigma) gradients as described in Pino and Cardona (Citation2011). After washing by centrifugation, re-suspension in RPMI medium and counting, aliquots containing 2 × 10⁵ MNC were placed in wells of 6-well culture plates. To each well, phorbol 12-myristate 13 acetate (50 ng/ml) and ionomycin (500 ng/ml) (both Sigma) were then added and the plates were cultured at 37 °C for 6 hr. At the end of this period, the cells received brefeldin A (10 μg/ml; Sigma) and were cultured a further 4 hr. The non-adherent cells in each well were then harvested in Cell Dissociation Buffer (ThermoFisher Scientific) and counted. Aliquots of the cells were then stained with phycoerythrin (PE)-conjugated anti-mouse CD4 (clone GK1.5; BioLegend, San Diego, CA) before permeabilization and fixation using a Cytofix/Cytoperm kit (BD Biosciences), as recommended by the manufacturer. Dedicated subsets of these cells were then intracellularly- stained with one of three fluorescein isothiocyanate (FITC)-conjugated antibodies specific to murine IL-17A (TC11-18H10.1), IFNγ (Poly5164), or Foxp3 (clone FLK16S, eBioscience, San Diego). The stained cells were then analyzed in a BD Accuri C5 cytometer (BD Biosciences) using associated C6 software (v.1.0264.21). A minimum of 10,000 events/sample was acquired. All samples were assayed in triplicate.
For analysis of co-stimulatory molecule expressions, dedicated sets of the murine splenocytes (aliquots containing 4 × 10⁴ DC cells, isolated as above) were stained with anti-mouse antibodies, i.e. FITC-anti-CD11c (clone N418), PE-CD40 (clone 3/23), PE-CD80 (clone 16- 10A1), or PE-CD86 (clone GL-1) (Biolegend). After staining, the cells were analyzed in the C5 flow cytometer. CD40, CD80 and CD86 expression histograms were generated using forward side-scatter and screening for CD11c+ cells. Mean fluorescence intensity (MFI) values for each cell type were acquired. A minimum of 10,000 events/sample was acquired. All samples were assayed in triplicate.
Effects of galangin on T-cell polarization
TH1 and TH17 cells were induced in vitro using standardized polarization methods as previously described (Shi et al. Citation2008). In brief, murine CD4+ cells were positively-purified from spleens of naive female C57BL/6 mice using an EasySep™ Mouse CD4+ T-Cell Isolation Kit (Stemcell, Grenoble, France), according to manufacturer instructions. The purified naïve T-cells were counted and then aliquots containing 4 × 10⁵ cells were activated by placing them into wells containing plate-bound anti-CD3 and soluble anti-CD28 antibodies (both at 1 µg/ml; BioLegend) and then incubating for 72 hr at 37 °C. These activated CD4+ cells were then polarized to a TH1 type by treatment with IL-4 (10 μg/ml) and IL-12 (10 ng/ml) or to a TH17 type by treatment with anti-IL-4 (10 μg/ml), anti-IFNγ (10 μg/ml), IL-6 (10 ng/ml), IL-1β (10 ng/ml), and TGF-β1 (2 ng/ml) (all from BioLegend) for 72 hr at 37 °C in the presence of 40 mg/kg of galangin (in 0.1% DMSO carrier). Galangin-free cells received 0.1% DMSO carrier only along with the noted cytokines. After the 72 hr, cells were then intracellularly-stained with FITC-conjugated anti- bodies to murine IL-17A (TC11-18H10.1) or IFNγ (Poly5164), as above, to determine differential levels of TH17 or TH1 cells in the cultures.
Analysis of surface molecules and cytokine expression of bone marrow‐derived DC
Bone marrow‐derived DC (BMDC) were generated from bone marrow of naïve C57BL/6 mice as described previously (Chen, Lin, et al. Citation2017). In brief, the intact tibia and fibia were isolated and placed in 75% alcohol for 5 min to disinfect. The BM cells from each were then flushed using a syringe, red blood cells present in the washouts were lysed with commercial RBC lysing buffer, and the final BM cell suspensions were washed by centrifugation using PBS. After counting, aliquots of 2 × 10⁵ cells were placed in RPMI 1640 supplemented with 10% heat-inactivated FBS, 100 U penicillin/ml, and 100 µg streptomycin/ml, as well as recombinant mouse granulocyte-monocyte colony-stimulating factor (20 ng/ml) and recombinant mouse IL-4 (20 ng/ml) (both Peprotech, Rehovot, Israel) and cultured at 37 °C under. Fresh medium was added to each well every 2 days for 6 days. On Day 7, non-adherent cells were collected as immature BMDC.
To analyze potential effects on surface marker expressions, the isolated BMDC were seeded at 106 cells/well in 6-well plates and then pretreated with 10 or 20 μM of galangin (or vehicle) for 2 hr. Thereafter, all cells were stimulated by addition of medium containing 100 ng LPS/ml (lipopolysaccharide Type O111:B4 from Escherichia coli; Sigma) for 18 hr. At the end of this period, CD40, CD80, and CD86 expression was analyzed by flow cytometry as described earlier. To examine stimulated cytokine production, IL-6, IL-12, p70 and IL-23 levels in the supernatants were evaluated using commercial ELISA kits (eBioscience).
Co-culture of DC and splenic T-cells
Splenic CD11c+ DC from only the 40 mg galangin/kg or vehicle-treated EAE mice were isolated as above (MicroBeads); CD4+ T-cells from vehicle-treated EAE mice were positively- purified using the EasySep Isolation Kit (StemCell,). The CD11c+ DC were then combined with the CD4+ T-cells at a 1:5 ratio (total cell number/well = 5 × 10⁵) and then incubated in the presence/absence of 20 mg MOG35-55 peptide/ml for 72 hr at 37 °C. The medium was then removed and T-cell proliferation examined using a BrdU-incorporation test (BrdU Cell Prolifera- tion ELISA Kit, Abcam, Cambridge, UK). The isolated medium was measured for IFNγ, IL-10, and IL-17 content using commercial mouse ELISA kits (R&D Systems, Minneapolis, MN, USA).
Statistical analysis
All results are expressed as means ± SD (in triplicates) unless indicated elsewise. All experiments were repeated at least three times to ensure results were consistent. An unpaired two-sample t-test was applied to compare means of two independent groups. One- or two-way analysis of variance (ANOVA) with a post-hoc Tukey HSD (Honest Significant Differences) test was used to compare multiple groups. All analyses were performed with Prism software (v 5.0, GraphPad, San Diego, CA, USA). A p-value ≤ 0.05 was considered to be statistically significant.
Results
Galangin treatment reduced clinical symptoms and delayed the onset of EAE
To assess any neuroprotective effect of galangin, EAE was induced in C57BL/6 mice using MOG peptide and galangin was provided at different dose levels (20, 40, and 80 mg/kg/d). Vital signs and clinical symptoms were monitored daily during the 28-day period (). The results indicate that EAE mice treated with 40 or 80 mg galangin/kg exhibited significantly lower clinical scores () and greater body weights () compared to vehicle-treated control EAE mice. In addition, these two groups of mice showed lower rates of disease incidence (up to 67% lower), lower mean maximal scores (up to 30% lower), and exhibited delayed disease onset (up to 77% longer) (). Mice dosed at 20 mg galangin/kg did not display any significant relief from EAE symptoms.
Figure 1. Effects of galangin on EAE symptoms in C57BL/6 mice. Galangin was given by oral gavage at 20, 40, or 80 mg/kg daily for 28 consecutive days; throughout, mice were monitored for (A) EAE clinical scores and (B) body weights. (C) Histological analyses of coronal sections of spinal cords obtained from the mice on Day 28; staining performed with hematoxylin and eosin (H&E) and luxol fast blue (LFB). Magnification 100×. Data expressed as means ± SD (n = 6) from three independent experiments with similar results. Different letters indicate a significant difference between two given groups (p < 0.05); same letters mean no significant difference.
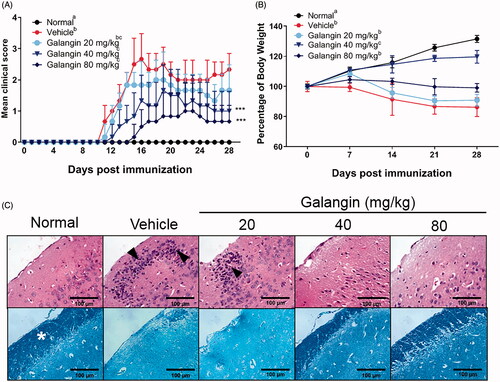
Table 1. Clinical features of EAE in mice for prophylaxis of galangin.
To elucidate how galangin might impart neuroprotection, on Day 28, spinal cord tissues from EAE mice following administration of 20, 40, and 80 mg/kg galangin on Day 28 were examined for severity of neuropathology. Infiltrated inflammatory cells and demyelination were evaluated by H&E and LFB staining, respectively. The results show spinal cords from vehicle mice were infiltrated with more inflammatory cells (black arrows) and their myelin layer (star symbols) was drastically thinner (vs. in healthy control mice). In comparison to the vehicle-treated mice, hosts treated with 40 or 80 mg galangin/kg presented tissues with less numbers of infiltrated cells and more-retained myelin layers (). Despite improvement in clinical scores for both higher dose treatments, the 40 mg/kg dose was selected as an adequate concentration for use in the remainder of these studies. This decision was based on the fact that mice treated with 40 mg galangin/kg exhibited the most significant amelioration of EAE severity while still maintaining weight gain (compared to the normal mice).
Galangin suppresses peripheral inflammation and CNS infiltration in EAE mice
A major features of MS is that infiltrating and resident antigen-presenting cells (like microglia and DC) activate migration of mononuclear cells (MNC) to the CNS to exacerbate neuroinflammation and intensify demyelination/axonal damage (Bynoe et al. Citation2007). In general, numbers of MNC that infiltrate into a spinal cord correlate with severity of EAE. In the study here, the total number of MNC in the spinal cords of EAE control mice were markedly elevated by ≈55-fold vs. levels noted with the healthy mice; however, due to the 40 mg galangin/kg treatment, the MNC count was significantly decreased to a level just ≈ 20-fold higher than in the healthy controls (). The other doses of galangin had no significant impact on this endpoint. As T-cells are a major group of infiltrating MNC in the EAE spinal cords (He et al. Citation2014), percentages of infiltrated CD4+ T-cells in the galangin-treated and control EAE samples were evaluated (flow cytometry). The results in showed that while levels of CD4+ T-cells were drastically increased (≈4.8-fold higher vs. in healthy controls) in the spinal cords of control EAE mice, galangin treatment (at 40 mg/kg) significantly reversed this increase in CD4+ T-cells in EAE mice back to an ≈ 2.5-fold increase vs. in healthy mice.
Figure 2. Effects of galangin on EAE mice. (A) Mononuclear cell counts in spinal cords of EAE mice with/without galangin (light microscopy). Representative histograms (B) and percentages of CD4+ T-cells (C) in spinal cords (flow cytometry). (D) T-Cell proliferation stimulated ex vivo with MOG peptide (BrdU incorporation). Populations (E) and representative bivariate graphs (F) of IFNγ+, IL-17A+, and Foxp3+ CD4+ T-cells from spinal cord cell suspensions (intracellular staining and flow cytometry). Data presented as means ± SD from (n = 6/group). Representative results are shown. Different letters indicate a significant difference between two given groups (p < 0.05); same letters mean no significant difference.
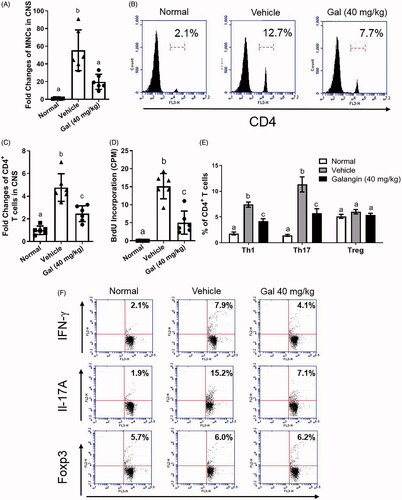
EAE mice exhibit strong TH1 (CD4+IFNγ+) and TH17 (CD4+IL-17A+) responses and reduced T-regulatory (Treg) CD4+Foxp3+ populations (Eisenstein and Williams Citation2009). Thus, analyses of T-cell subtypes among the splenocytes recovered from EAE mice were done to assess potential effects from galangin. The results showed that the spleens of EAE mice in general had increased increases of 7.4% TH1 and 11.3% TH17 cell populations (from corresponding levels of 1.8% and 1.4%, respectively, in control mice spleens), and that these elevations were somewhat mitigated to final levels of 4.1% and 5.8%, respectively, as a result of the galangin treatment (). In contrast, there no remarkable changes in Treg cell populations.
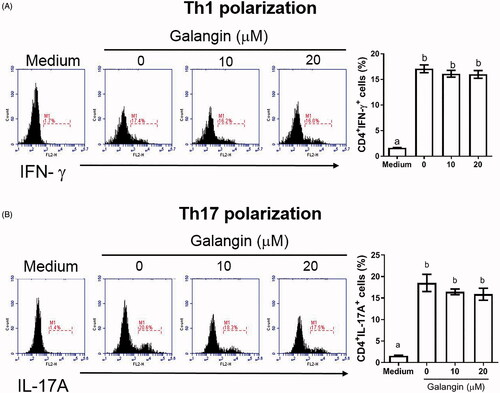
In ex vivo studies, after re-stimulation of the co-culture of splenic T-cells/DC with MOG peptide, the proliferative ability of T-cells was seen to be significantly suppressed by 33% due to the galangin () This outcome suggested that T-cell polarization and proliferation in the EAE mice might be reduced by galangin. Interestingly, when T-cells were polarized toward TH1 and TH17 types in vitro, galangin- reduced polarization appeared to be limited ().
Figure 3. In vitro effects of galangin on CD4+ T-cell polarization. Naïve T cells from naive C57BL/6 mouse spleens were activated with anti-CD3 and anti-CD28 antibodies and then assessed (with or without galangin treatment) for (A) TH1- and (B) TH17-polarized states based on intracellular IFNγ and IL-17A levels. Data is expressed as means ± SD from three samples. Significance compared with activated CD4+ T-cells without galangin treatment. Different letters indicate a significant difference between two given groups (p < 0.05); same letters mean no significant difference.
Galangin suppresses co-stimulatory molecule expression and cytokine production of DC
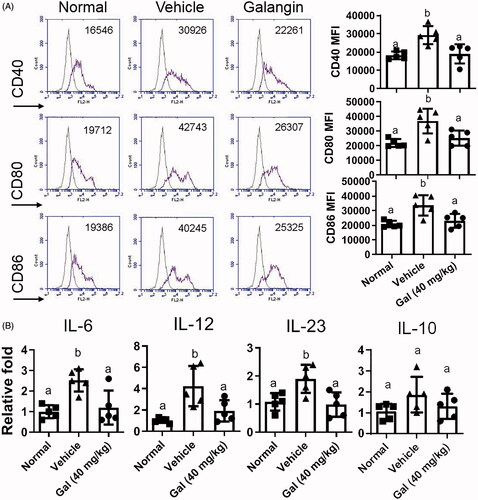
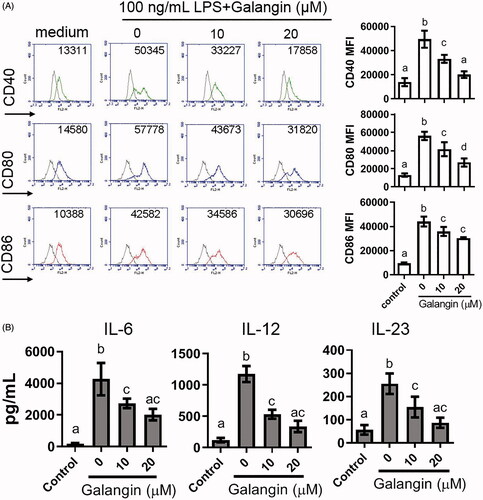
DC also play an important role in MS pathogenesis by priming T-cells (Giles et al. Citation2018). To ascertain if galangin might impact the function of DC, splenic DC were isolated from control and EAE mice (with or without galangin treatment) and co-stimulatory CD40, CD80, and CD86 molecule expression was assessed. It was seen that while MFI values for CD40, CD80, and CD86 on DC from EAE mice were significantly increased (on average, were 160% higher compared to cells from normal mice), these expression levels were suppressed by 40 mg galangin/kg treatment - to the point that the levels were comparable to those seen with the DC from normal mice (). Cell levels of for IL-6, IL-12, IL-23, but not IL-10, mRNA were also significantly reduced to 1.20-, 1.92-, 0.98-, and 1.30-fold higher, respectively, than those in normal control groups due to the galangin treatment ().
Figure 4. Effects of galangin on DC from EAE mice. (A) CD11c+ splenocytes from EAE mice were analyzed for expression of CD80, CD86, and CD40 (flow cytometry). (B) mRNA levels of IL-6, IL-12, IL-23, and IL-10 in CD11c+ DC (real-time qPCR). Data is expressed as means ± SEM combined from three independent experiments (n = 8/group). Different letters indicate a significant difference between two given groups (p < 0.05); same letters mean no significant difference.
To confirm the findings, purified bone marrow-derived DC (BMDC) from naïve mice were activated with LPS and then treated with different concentrations of galangin (to assess anti-inflammatory activity). These in vitro results showed that LPS-activated DC exhibited 3.55-, 4.31-, and 4.62-fold increases in CD40, CD80, and CD86 expression, respectively, whereas galangin treatments (10 or 20 μM) led to 1.2-2.5-fold decreases in these elevated expressions seen in the EAE mice – but these values were still above control levels (). These same trends (vs. control) were evident with regard to LPS-induced effects on secretion of IL-6, IL-12, and IL-23 (). Overall, these effects appeared dose-related and, moreover, were consistent with the other data shown in .
Figure 5. Effects of galangin on LPS-stimulated BMDC from naïve mice. (A) LPS-activated CD11c+ DC were analyzed for changes in expression of CD80, CD86, and CD40 by indicated concentrations of galangin. (B) Production of IL-6, IL-12, and IL-23 from activated DC, with or without galangin treatment (ELISA). Data expressed as means ± SEM. Different letters indicate a significant difference between two given groups (p < 0.05); same letters mean no significant difference.
Galangin inhibits stimulatory capacity of pathogenic DC to activate T-cells
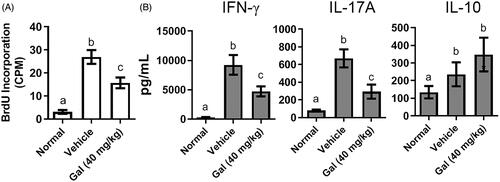
To investigate the interplay between pathogenic DC and T-cells, a co-culture system of splenic CD11c+ DC from experimental mice and MOG-reactive T-cells from EAE mice was generated. Addition of the MOG peptide to stimulate DC would then allow for evaluation of cell proliferation and cytokine production (and to clarify how galangin might affect DC and T-cells). The results shown in indicate that MOG-treated CD11c+ DC from vehicle-treated EAE mice exhibited higher cell proliferation and more active functions than MOG-treated CD11c+ DC cells from healthy mice, i.e. increased BrdU incorporation (27 CPM, average) and cytokine production (9253 pg IFNγ/ml and 671 pg IL-17A/ml, average). The results showed that treatment of the mice with 40 mg galangin/kg reduced MOG-induced BrdU incorporation, and both IFNγ and IL-17A secretion, by 59, 51, and 43%, respectively, vs. levels seen with when MOG-treated CD11c+ DC from vehicle-treated EAE mice were used in the assay. This indicated proliferation and T-cell differentiation that was being mediated by these DC were likely now being inhibited by prior host treatment with galangin (source of the CD11c+ DC for assay). Interestingly, while levels of IL-10 were also increased when CD11c+ DC from the vehicle-treated EAE mice were used, the CD11c+ DC from the galangin-treated hosts imparted no significant effect on this parameter.
Figure 6. Effects of galangin on DC-T cell co-cultures. Splenic CD11c+ DC from EAE mice (with or without galangin treatment) were cultured with CD4+ T-cells from EAE mice, then stimulated with MOG peptide. (A) T-Cell proliferation (BrdU incorporation) and (B) cytokine levels in culture media (ELISA). Representative data is from at least three independent experiments. Data expressed as means ± SEM. *p < 0.05; **p < 0.01; ***p < 0.001.
Discussion
In this study, the potential therapeutic efficacy of the flavonoid, galangin was tested in an EAE mouse model. The results shown in the current study suggest that galangin could alleviate clinical/pathological symptoms of EAE by limiting the infiltration of MNC into the CNS. Galangin is also capable of suppressing T-cell proliferation and differentiation and reducing DC functions (i.e. antigen presentation and cytokine production) which in turn likely contributed to the improved clinical signs. However, a positive control to alleviate EAE symptoms can be included in the following studies.
To facilitate the potential application of galangin in clinical MS patients, the bioactivity of galangin on immune cells requires more research. A previous study by Noureddine et al. (Citation2017) reported that crude propolis extracts containing galangin exhibited cytotoxicity toward Jurkat T-cells in part via induction of PARP cleavage and changes in p53 expression. The present study showed that, in an encephalomyelitis setting, galangin imparted inhibitory effects on T-cell expansion-induction and inflammatory cytokine formation/release from host DC. Here, splenic populations of TH1 and TH17 in EAE hosts were significantly reduced by galangin; however, in vitro, the effects on T-cell polarization toward TH1 or TH17 subtypes by galangin was limited. It is presumed that this discrepancy in outcomes may be due to the fact that splenic T-cells were over-activated by the CD3 and CD28 stimulation in vitro, which in turn led to insignificant effects being achievable by the galangin.
Throughout this study, neither EAE-related changes in splenic Treg cell population levels nor IL-10 production was significantly impacted by galangin. It is known that IL-10 plays a crucial role in negative regulation of EAE susceptibility (Bettelli et al. Citation1998; Cua et al. Citation1999) and that Treg cells have a major role in regulating IL-10 production (Rynda-Apple et al. Citation2011). It thus seems reasonable to assume, based on the above, that Treg cells in these hosts could be targeted by galangin. However, the present results suggest otherwise, i.e. instead implying that the anti- inflammatory effect of galangin against EAE was not caused by interactions with the Treg cell-IL-10 axis. Dai et al. (Citation2012) previously reported that the tissues used to harvest/provide mononuclear cells could be key to observations about IL-10 production in an EAE mouse model. Specifically, those authors found that IL-10 production induced by Bowman-Birk inhibitor was not affected when spleens were the cell source, but there were significant increases induced when the source was lymph nodes. Apart from tissue source being able to explain these unexpected outcomes, since Treg cell levels and IL-10 production were evaluated here at 28 dpi, this may have been too late to observe any induced change.
DC also play a critical role in the pathophysiology of EAE and MS, as evidenced by an accumulation of these types of cell in the CNS (Sagar et al. Citation2012; Clarkson et al. Citation2014). Previous reports have identified that the replenishment of DC in mouse brain tissues – where DC could communicate with infiltrating immune cells such as T-cells – resulted from a recruitment of CD11c+ DC from the peripheral circulation system (done by tracing yellow fluorescent protein- expressing CD11c cells, i.e. CD11c-eYFP DC, in the CNS) (Chinnery et al. Citation2010; Clarkson et al. Citation2012). In line with the previous research, the current study also documented activation of CD11c+ DC from the spleen and bone marrow of EAE mice. Such cells exhibited a higher expression of co-stimulatory molecules and secreted increased amounts of inflammatory cytokines. Indeed, crosstalk between DC and T-cells in the CNS not only contributes to the severity of neuroinflammation, but also helps to skew the T-cell response toward TH1 and TH17 types that are associated with EAE pathogenesis (Carbajal et al. Citation2015). The current data from the co-cultures of DC and T-cells also helped to indicate that CD11c+ DC could exacerbate IFNγ and IL-17A responses associated with inflammation. Of note, the current studies also showed that galangin, either used in vitro or under in vitro conditions, had a potential to mitigate many of these outcomes. Thus, the data support our contention that in time, galangin might possibly be useful for the treatments of MS and potentially other neuroinflammation-based pathologies. Further studies are clearly warranted.
In the current study, three different dosages of galangin; 20, 40, and 80 mg/kg, were provided to mice via oral gavage. Any neuroprotective effects at 20 mg/kg were only marginal. Other studies investigating therapeutic applications of galangin in different disease models, including LPS-induced Parkinson’s Disease in rats, also found that any effects appear to be more significant at doses only ≥ 40 mg/kg (Chen, Liu et al. Citation2017; Gerges et al. Citation2020). Previous studies regarding galangin bioavailability compared plasma concentrations of galangin in rats and after oral and intravenous administrations (Chen et al. Citation2015; Ye et al. Citation2017). Of note, it was found that galangin rapidly decayed and was undetectable within 2 hr of oral dosing when 5 or 10 mg galangin/kg was given; data for 20 mg/kg were not provided. This suggests that higher doses of galangin would likely be necessary to observe any pharmacological effects in vivo, at least in rodent models. In contrast, it was found here that doses as high as 80 mg galangin/kg when administered to the mice suppressed their normal weight gain. This might suggest potential adverse effects in response to a “high dose” of galangin despite any improvements attained with regard to clinical scores and spinal cord tissue histology. Compared to the normal mice at the end of the present study, there was > 20% difference of body weights in high-dose 80 mg/kg mice. In consideration of animal welfare and the 3 R concept for performing animal studies (Talbot et al. Citation2020), testing with doses > 40 mg/kg were not continued.
Conclusions
The current study using oral treatment of mice with galangin demonstrated the neuroprotective effects of this flavonoid to ameliorate EAE symptoms. These outcomes appeared to be mediated, in part, by effects of galangin on both DC and T-cells in these hosts. The findings also conveyed the possibility that galangin might eventually serve as a potential drug for treatment of a neurologic disease like multiple sclerosis. This study highlights the importance of further research into the clinical potential for this flavonoid.
Supplemental Material
Download MS Word (42 KB)Acknowledgments
We would like to thank Dr. Mitchell Cohen for editing and providing instructive suggestions to improve this manuscript.
Disclosure statement
No potential conflict of interest was reported by the author(s).
Additional information
Funding
References
- Amirzargar A, Mytilineos J, Yousefipour A, Farjadian S, Scherer S, Opelz G, Ghader A. 1998. HLA Class II (DRB1, DQA1 and DQB1) associated genetic susceptibility in Iranian multiple sclerosis (MS) patients. Eur J Immunogenet. 25(4):297–301.
- Bettelli E, Das M, Howard E, Weiner H, Sobel R, Kuchroo V. 1998. IL-10 is critical in the regulation of autoimmune encephalomyelitis as demonstrated by studies of IL-10- and IL-4- deficient and transgenic mice. J Immunol. 161(7):3299–3306.
- Bleau C, Filliol A, Samson M, Lamontagne L. 2016. Mouse hepatitis virus infection induces a Toll-like receptor 2-dependent activation of inflammatory functions in liver sinusoidal endothelial cells during acute hepatitis. J Virol. 90(20):9096–9113.
- Bynoe M, Bonorino P, Viret C. 2007. Control of experimental autoimmune encephalomyelitis by CD4+ suppressor T-cells: Peripheral versus in situ immunoregulation. J Neuroimmunol. 191(1–2):61–69.
- Carbajal K, Mironova Y, Ulrich-Lewis J, Kulkarni D, Grifka-Walk H, Huber A, Shrager P, Giger R, Segal B. 2015. TH cell diversity in experimental autoimmune encephalomyelitis and multiple sclerosis. J Immunol. 195(6):2552–2559.
- Chen D, Lin C, Chen Y, Chao Y, Yang D. 2017. Dextromethorphan exhibits anti-inflammatory and immunomodulatory effects in a murine model of collagen-induced arthritis and in human rheumatoid arthritis. Sci. Rep. 7:11353.
- Chen F, Tan Y, Li H, Qin Z, Cai H, Lai W, Zhang X, Li Y, Guan W, Li Y, et al. 2015. Differential systemic exposure to galangin after oral and intravenous administration to rats. Chem Cent J. 9:14.
- Chen G, Liu J, Jiang L, Ran X, He D, Li Y, Huang B, Wang W, Fu S. 2017. Galangin reduces the loss of dopaminergic neurons in an LPS-evoked model of Parkinson's disease in rats. Intl J Mol Sci. 19:12.
- Chinnery H, Ruitenberg M, McMenamin P. 2010. Novel characterization of monocyte-derived cell populations in the meninges and choroid plexus and their rates of replenishment in bone marrow chimeric mice. J Neuropathol Exp Neurol. 69(9):896–909.
- Choi M, Park J, Park J, Kim H, Kim H. 2017. Galangin suppresses pro-inflammatory gene expression in polyinosinic-polycytidylic acid-stimulated microglial cells. Biomol Ther. 25(6):641–647.
- Clarkson B, Heninger E, Harris M, Lee J, Sandor M, Fabry Z. 2012. Innate-adaptive crosstalk: How dendritic cells shape immune responses in the CNS. Adv Exp Med Biol. 946:309–333.
- Clarkson B, Walker A, Harris M, Rayasam A, Sandor M, Fabry Z. 2014. Mapping the accumulation of co-infiltrating CNS dendritic cells and encephalitogenic T-cells during EAE. J Neuroimmunol. 277(1–2):39–49.
- Cua D, Groux H, Hinton D, Stohlman S, Coffman R. 1999. Transgenic IL-10 prevents induction of experimental autoimmune encephalomyelitis. J Exp Med. 189(6):1005–1010.
- Dai H, Ciric B, Zhang G, Rostami A. 2012. Interleukin-10 plays a crucial role in suppression of experimental autoimmune encephalomyelitis by Bowman-Birk inhibitor. J Neuroimmunol. 245(1–2):1–7.
- Eisenstein E, Williams C. 2009. The Treg/TH17 cell balance: A new paradigm for autoimmunity. Pediatr Res. 65(5 Pt 2):26R–31R.
- Fletcher J, Lalor S, Sweeney C, Tubridy N, Mills K. 2010. T-cells in multiple sclerosis and experimental autoimmune encephalomyelitis. Clin Exp Immunol. 162(1):1–11.
- Gerges S, Tolba M, Elsherbiny D, El-Demerdash E. 2020. The natural flavonoid galangin ameliorates dextran sulphate sodium-induced ulcerative colitis in mice: Effect on Toll-like receptor-4, inflammation and oxidative stress. Basic Clin Pharmacol Toxicol. 127(1):10–20.
- Giles D, Duncker P, Wilkinson N, Washnock-Schmid J, Segal B. 2018. CNS-resident classical DCs play a critical role in CNS autoimmune disease. J Clin Invest. 128(12):5322–5334.
- Gilgun-Sherki Y, Melamed E, Offen D. 2004. The role of oxidative stress in the pathogenesis of multiple sclerosis: The need for effective antioxidant therapy. J Neurol. 251(3):261–268.
- He J, Hsuchou H, He Y, Kastin A, Mishra P, Fang J, Pan W. 2014. Leukocyte infiltration across the blood-spinal cord barrier is modulated by sleep fragmentation in mice with experimental autoimmune encephalomyelitis. Fluids Barriers Cns. 11(1):27.
- Housley W, Fernandez S, Vera K, Murikinati S, Grutzendler J, Cuerdon N, Glick L, de Jager P, Mitrovic M, Cotsapas C, et al. 2015. Genetic variants associated with autoimmunity drive NF-κB signaling and responses to inflammatory stimuli. Sci Transl Med. 7(291):291ra93–291r293.
- Jung Y, Kim M, Yoon J, Park P, Youn H, Lee H, Lee J. 2014. Anti-inflammatory effects of galangin on lipopolysaccharide-activated macrophages via ERK and NF-κB pathway regulation. Immunopharmacol Immunotoxicol. 36(6):426–432.
- Kadowaki A, Quintana F. 2020. The gut-CNS axis in multiple sclerosis. Trends Neurosci. 43(8):622–634.
- Kim M, Park P, Na J, Jung I, Cho J, Lee J. 2019. Anti-neuroinflammatory effects of galangin in LPS-stimulated BV-2 microglia through regulation of IL-1β production and the NF-κB signaling pathways. Mol Cell Biochem. 451(1–2):145–153.
- Li J, D'Amelio P, Robinson J, Walker L, Vaccaro C, Luo T, Tyagi A, Yu M, Reott M, Sassi F, et al. 2015. IL-17A is increased in humans with primary hyperparathyroidism and mediates PTH-induced bone loss in mice. Cell Metab. 22(5):799–810.
- Li J, Du Y, Yan Z, Yan J, Zhuansun Y, Chen R, Zhang W, Feng S, Ran P. 2016. CD80 and CD86 knockdown in dendritic cells regulates TH1/TH2 cytokine production in asthmatic mice. Exp Ther Med. 11(3):878–884.
- Li S, Wu C, Zhu L, Gao J, Fang J, Li D, Fu M, Liang R, Wang L, Cheng M, et al. 2012. By improving regional cortical blood flow, attenuating mitochondrial dysfunction and sequential apoptosis galangin acts as a potential neuroprotective agent after acute ischemic stroke. Molecules. 17(11):13403–13423.
- Ma S, Ming Z, Gong A, Wang Y, X, Chen X, Hu G, Zhou R, Shibata A, Swanson P, Chen X. 2017. A long noncoding RNA, lincRNA-Tnfaip3, acts as a co-regulator of NF-κB to modulate inflammatory gene transcription in mouse macrophages. Faseb J. 31(3):1215–1225.
- Noureddine H, Hage-Sleiman R, Wehbi B, Fayyad-Kazan H, Hayar S, Traboulssi M, Alyamani O, Faour W, ElMakhour Y. 2017. Chemical characterization and cytotoxic activity evaluation of Lebanese propolis. Biomed Pharmacother. 95:298–307.
- Ohl K, Tenbrock K, Kipp M. 2016. Oxidative stress in multiple sclerosis: Central and peripheral mode of action. Exp Neurol. 277:58–67.
- Pahan K, Schmid M. 2000. Activation of NF-κB in the spinal cord of experimental allergic encephalomyelitis. Neurosci. Lett. 287(1):17–20.
- Pino P, Cardona A. 2011. Isolation of brain and spinal cord mononuclear cells using percoll gradients. J. Vis. Exp. 48:2348.
- Quiroga E, Sampietro D, Soberon J, Sgariglia M, Vattuone M. 2006. Propolis from the northwest of Argentina as a source of anti-fungal principles. J Appl Microbiol. 101(1):103–110.
- Reich D, Lucchinetti C, Calabresi P. 2018. Multiple sclerosis. N Engl J Med. 378(2):169–180.
- Rynda-Apple A, Huarte E, Maddaloni M, Callis G, Skyberg J, Pascual D. 2011. Active immunization using a single dose immunotherapeutic abates established EAE via IL-10 and regulatory T-cells. Eur J Immunol. 41(2):313–323.
- Sagar D, Lamontagne A, Foss C, Khan Z, Pomper M, Jain P. 2012. Dendritic cell CNS recruitment correlates with disease severity in EAE via CCL2 chemotaxis at the blood-brain barrier through paracellular transmigration and ERK activation. J Neuroinflam. 9:245.
- Schmittgen T, Livak K. 2008. Analyzing real-time PCR data by the comparative C(T) method. Nat Protoc. 3(6):1101–1198.
- Shi G, Cox C, Vistica B, Tan C, Wawrousek E, Gery I. 2008. Phenotype switching by inflammation-inducing polarized TH17 cells, but not by TH17 cells. J Immunol. 181(10):7205–7213.
- Sintzel M, Rametta M, Reder A. 2018. Vitamin D and multiple sclerosis: A comprehensive review. Neurol Ther. 7(1):59–85.
- Siwkowski A, Malik L, Esau C, Maier M, Wancewicz E, Albertshofer K, Monia B, Bennett C, Eldrup A. 2004. Identification and functional validation of PNAs that inhibit murine CD40 expression by redirection of splicing. Nucleic Acids Res. 32(9):2695–2706.
- Talbot S, Biernot S, Bleich A, van Dijk R, Ernst L, Hager C, Helgers S, Koegel B, Koska I, Kuhla K, et al. 2020. Defining body-weight reduction as a humane endpoint: A critical appraisal. Lab Anim. 54(1):99–110.
- Tarlinton R, Martynova E, Rizvanov A, Khaiboullina S, Verma S. 2020. Role of viruses in the pathogenesis of multiple sclerosis. Viruses. 12(6):643.
- Urban J, Kumar V, Kono D, Gomez C, Horvath S, Clayton J, Ando D, Sercarz E, Hood L. 1988. Restricted use of T-cell receptor V genes in murine autoimmune encephalomyelitis raises possibilities for antibody therapy. Cell. 54(4):577–592.
- Wang K, Song F, Fernandez-Escobar A, Luo G, Wang J, Sun Y. 2018. The properties of cytokines in multiple sclerosis: Pros and cons. Am J Med Sci. 356(6):552–560.
- Wu C, Chen J, Chen C, Wang W, Wen L, Gao K, Chen X, Xiong S, Zhao H, Li S. 2015. Wnt/β-catenin coupled with HIF-1α/VEGF signaling pathways involved in galangin neurovascular unit protection from focal cerebral ischemia. Sci. Rep. 5:16151.
- Ye W, Sun W, Chen R, Wang Z, Cui X, Zhang H, Qian S, Zheng Q, Zhou Y, Wan J, et al. 2017. Pharmacokinetics in rat plasma and tissue distribution in mice of galangin determined by UHPLC-MS/MS. Acta Chromatogr. 31:1–6.