
Abstract
Trichloroethylene (TCE) hypersensitivity syndrome (THS), called occupational medicamentosa-like dermatitis due to TCE (OMDT) in China, is a fatal occupational disorder caused by TCE exposure. Visceral damage, including kidney injury, is one of the major complications. Necroptosis is a regulated cell death form linked to local inflammatory response. This study aimed to investigate whether renal cell necroptosis was involved in TCE-induced kidney injury. A Balb/c mouse model of TCE sensitization was utilized to study mechanisms of modulation of TCE-induced renal necroptosis. Renal histology (using light and transmission electron microscopy) and renal tubular impairment indexes, including α1-microglobulin (α1-MG), and β2-microglobulin (β2-MG), were evaluated. In addition, tissue expression of necroptosis-related proteins, including tumor necrosis factor (TNF)-α, TNF receptor 1 (TNFR1), receptor-interacting protein kinase 3 (RIPK3), p-RIK3, mixed lineage kinase domain-like protein (MLKL), and p-MLKL, were also evaluated. The study here confirmed TCE sensitization caused damage to renal tubules and renal tubular epithelial cell (RTEC) necroptosis. In mice treated with R7050 (a specific TNFα antagonist), it was also seen that inhibition of TNFα expression could effectively inhibit RTEC necroptosis and improve renal function in the TCE-sensitized mice. Taken together, these results help to define a novel mechanism by which RTEC necroptosis plays a key role in TCE-induced kidney damage.
Introduction
Trichloroethylene (TCE) is an environmental contaminant frequently detected in air, soil, and groundwater (Wang, Yu et al. Citation2019; de Miranda and Greenamyre Citation2020). After accumulating in the human body, TCE causes a series of health problems, including autoimmune diseases and cancer (Morten et al. Citation2016; Phillips et al. Citation2019). Occupational exposure to TCE has been linked to TCE hypersensitivity syndrome (THS) (Ministry of Health of China Citation2006); THS is also called occupational medicamentosa-like dermatitis due to TCE (OMDT) in China. In fact, OMDT is a major occupational disorder in China, and patients often present with extensive dermatitis and multiple organ failure, especially of the liver and kidney (Liu Citation2009; Zhang et al. Citation2011).
OMDT-associated kidney failure, although not as common and fatal as the associated hepatitis, still seriously affects patient quality-of-life (Zhang et al. Citation2011). In OMDT patients, a diffuse inflammation of both kidneys and renal dysfunction is present (Liu Citation2009). Such outcomes are in line with animal studies that have shown that renal tubules are sensitive to inflammatory factors that are induced during TCE sensitization (Zhang et al. Citation2016; Wang, Huang, Dai et al. Citation2019; Wang, Huang, Yang et al. Citation2019). Nevertheless, even with these findings in patients and animal models, detailed mechanisms of TCE-induced renal inflammatory responses remain largely undefined.
Emerging studies have demonstrated a crucial role for necroptosis in many renal pathologies, such as renal ischemia-reperfusion injury (Shen et al. Citation2019) and chronic kidney disease (Chen et al. Citation2018). Necroptosis is an immunogenic programed cell death that is initiated by tumor necrosis factor (TNF)-α (Dondelinger et al. Citation2016). Specifically, after TNFα binding to the TNF receptor 1 (TNFR1; death receptor), two effector molecules, i.e. receptor-interacting protein kinase 3 (RIPK3) and its substrate mixed lineage kinase domain-like protein (MLKL) are phosphorylated (Li et al. Citation2012; Dondelinger et al. Citation2014; Duan et al. Citation2020). Subsequently, a series of morphological changes, including plasma membrane rupture, organelle swelling, cell lysis, and release of pro-inflammatory mediators occurs (Shlomovitz et al. Citation2018).
Because renal tubules are sensitive to inflammatory factors induced during TCE sensitization, it is plausible that renal cell necroptosis might be a key event in the underlying pathogenesis of OMDT-associated kidney failure. Accordingly, to discern if renal cell necroptosis is important in this pathology, a mouse model of skin sensitization induced by TCE was evaluated in the study reported here. The mice were evaluated for a variety of endpoints associated with TCE sensitization (positive vs. negative outcomes compared). To assess if TNFα plays a critical role for in any of the observed outcomes, mice were also pretreated with a specific TNFα antagonist (R7050) to block necroptosis before TCE challenge.
Materials and methods
Animal model and experiment design
BALB/c mice (female, 6–week-of-age, 18–22 g) were obtained from the Experimental Animal Center of Anhui Medical University (accredited by People’s Government of Anhui Province [license ID #SYXK-2020-001]). The mice were kept in a specific pathogen-free (SPF) environment maintained at 23–25 °C with a 50 [± 5]% relative humidity and a 12-h light:dark cycle. All mice had ad libitum access to standard rodent chow and filtered tap water. This study was supervised by the Ethics Committee of Anhui Medical University (#20180309), following Declaration of Helsinki principles. All experimental procedures were approved by the Animal Care and Use Committee of Anhui Medical University (#LLSC20180310). The care and use of mice complied with ARRIVE guidelines and the U.S. Public Health Service Policy on Humane Care and Use of Laboratory Animals.
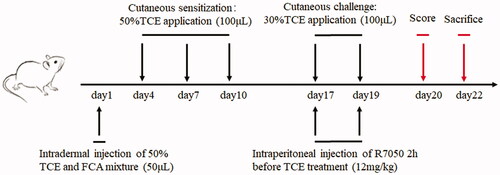
After allowing for 7 d to acclimate, mice were randomly assigned to four groups: blank control (n = 6), vehicle control (n = 6), TCE treatment (n = 30), and TCE + R7050 treatment (n = 29). This model of TCE sensitization was based upon previous studies (Wang et al. Citation2015); and a diagram for the study design is shown in . For these studies, TCE reagent and Freund’s complete adjuvant (FCA) were purchased from Sigma (St. Louis, MO), and acetone and olive oil were purchased from the Shanghai Chemical Company (Shanghai, China). In brief, on Day 1, the TCE and TCE + R7050 mice were intradermally injected with 100 µl of a 1:1 solution of 50% (w/v) TCE (diluted from stock in acetone:olive oil [1:1, AOO] vehicle) and FCA. The TCE concentration in each case was 2.5 mg/kg BW. Controls received injection with vehicle only. Blank control mice were sham-injected with normal saline. On days 3, 7, and 10, mice in the TCE groups then had 100 µl of a comparable 50% TCE solution (in AOO, no FCA) applied to the skin on their backs (cutaneous sensitization phase). Controls were dabbed with vehicle only. On days 17 and 19, mice in the TCE groups then had 100 µl of a 30% TCE solution (in AOO, no FCA) applied to the skin on their back skin (cutaneous challenge phase). For mice treated with the TNFα antagonist, intraperitoneal injection of R7050 (12 mg/kg) was performed 2 h before TCE treatment on days 17 and 19.
Figure 1. Flow diagram of mouse model of skin sensitization by TCE. Note: Day 1: a mixture of 50% TCE and equal FCA solution was intradermally injected into the back of mice. On days 4, 7, and 10: 100 μl of a 50% TCE solution was applied on the same area of the back (resulting in three sensitizations). On days 17 and 19: 100 μl of a 30% TCE solution was applied to the same area of the back (resulting in two challenges). The TNFα antagonist R7050 (12 mg/kg) was intraperitoneally injected into select mice 2-h before TCE treatment. Day 20: Murine cutaneous reaction scoring was assessed. Day 22: All mice were euthanized and biosamples obtained. Note: 50% TCE (TCE: olive oil: acetone = 5:2:3); 30% TCE (TCE: olive oil: acetone = 3:2:5).
All mice were evaluated on day 20 of the study regimen. The degree of cutaneous reaction was scored as: 0 = no reaction; 1 = scattered mild redness; 2 = moderate and diffuse redness; 3 = intensive erythema and swelling. Cutaneous reactions were evaluated by visual scoring of the levels of erythema and swelling as assessed by two independent board-certified dermatologists blinded to experimental treatments. The final score was the accordant judgment of the two analysts. If there was no agreement between the two, the materials in question were then reviewed by a third independent dermatologist.
All mice were euthanized on day 22 by asphyxiation with CO2. At necropsy, biosamples, including blood (for serum used to assess α1-microglobulin [α1-MG] and β2-microglobulin [β2-MG] levels), kidneys, and skin were collected.
Antibodies
Mouse monoclonal antibodies (mAb) to mouse TNFα (sc-52746) and RIPK3 (sc-374639) were bought from Santa Cruz Biologicals (Santa Cruz, CA). Rabbit mAb to mouse TNFR1 (#ab19139) and GAPDH (#ab18160), as well as donkey anti-mouse IgG H&L (Alexa Fluor [AF] − 488; #ab150105)) and goat anti-rabbit IgG H&L (AF-594; #ab150080) were purchased from Abcam (Cambridge, UK). Rabbit mAb to mouse p-RIPK3 (91702 s), MLKL (37705 s), and p-MLKL (37333 s) were purchased from Cell Signaling Technology (Boston, MA). Mouse mAb to mouse CK18 (BF-0727) was purchased from Affinity Biosciences (Cincinnati, OH).
Immunohistochemistry
Fresh mouse kidney specimens were fixed in 10% formalin, embedded in paraffin, and cut to 3-μm thickness with a microtome. Sections were then de-paraffinated and re-hydrated using a xylene-gradient ethanol. All sections were then coated for 30 min with a 3% H2O2 solution to block endogenous peroxidases. The sections were then heated for 15 min in a microwave oven to rescue antigens, then coated for 30 min with a 10% goat serum-PBS solution to block non-specific binding. On separate dedicated slides from each host, a solution of PBS containing primary antibodies to mouse TNFα or TNFR1 (each at manufacturer-recommended 1:200) antigens, and then placed atop the section and the slides were incubated at 37 °C for 2 h. After gentle rinsing with PBS, all sections were coated with a solution of biotin-conjugated goat anti-rabbit/-mouse IgG (1:1000 dilution) in PBS and the slides then incubated at 37 °C for 2 h. After gentle rinsing with PBS, a solution of PBS-10% FBS containing horseradish peroxidase-conjugated streptavidin was applied to each slide and the samples were incubated at 37 °C for 20 min. After gentle rinsing with PBS, DAB (ZSJQ-BIO, Beijing, China) and hematoxylin solution were applied to each slide (in turn) to stain the target proteins and nucleus, respectively. The sections were then evaluated using a BX53 optical microscope (Olympus, Tokyo, Japan). For each mouse, five sections/kidney were evaluated. Relative expression of TNFα and TNFR1 (vs. levels in samples from controls) was assessed using average “gray values” calculated via Image-Pro software version 6.0 (Media Cybernetics, Rockville, MD).
Immunofluorescence
For immunofluorescence analyses, parallel sets of prepared sections were embedded in optimal cutting temperature compound (OCT, Sakura Finetek, Torrance, CA). After gentle washing with PBS, sections were permeabilized by coating with a 0.5% Triton X-100-PBS solution for 30 min. After gentle washing with PBS, sections were coated with a solution of PBS containing the primary antibodies anti-p-RIPK3 (1:300 dilution) and anti-CK18 (1:1000 dilution), or anti-p-MLKL (1:1600 dilution) and anti-CK18 (1:1000 dilution), and incubated overnight at 4 °C. After a brief wash with PBS, a solution of PBS containing fluorescein-labeled secondary donkey anti-mouse IgG H&L (AF-488) and goat anti-rabbit IgG H&L (AF-594) (both 1:1000 dilution) in PBS was applied to each section and the slides incubated at 37 °C for 2 h. After gentle washing with PBS, slides were coated with DAPI (4,6-diamidino-2-phenylindole; Sigma) solution for 15 min to stain cell nuclei. Sections were then visualized and photographed using an IX73 fluorescence microscope fitted with a DP80 camera (Olympus, Tokyo, Japan). For each mouse, five sections/kidney were evaluated. The mean fluorescence intensity (MFI) of p-RIPK3 and p-MLKL in each section was characterized using Image-Pro software.
Hematoxylin and eosin (H&E) staining
Other dedicated sections of the freshly isolated mouse kidneys and skin were fixed in 4% paraformaldehyde for 48 h, then embedded into paraffin, and sectioned to 3-μm thickness. The sections were then de-paraffinized and stained with hematoxylineosin solution. After gentle rinsing with PBS, the sections were examined using a BX53 optical microscope (Olympus) at 400-fold magnification. For each mouse, five sections/kidney were evaluated.
Transmission electron microscope
Other dedicated sections of the mouse kidneys were fixed in 2.5% glutaraldehyde 1% osmium acid solution for 10 h. Mouse tissue was dehydrated via ethanol gradient, soaked, and then embedded in epoxy resin. The block was then cut to 70-nm thickness using an ultrathin microtome. The samples were prepared for ultrastructural analyses of the renal cortex of each mouse according to standardized preparation procedures. Ultrastructural analyses of the renal cells were performed using a JEM-1230 transmission electron microscope (JEOL, Tokyo, Japan).
Western blotting
Kidney tissues were homogenized and proteins extracted on ice for 15 min using an RIPA lysis buffer-PMSF (phenylmethylsulfonyl fluoride)-phosphatase inhibitor mixture. The concentration of total proteins in each isolate was determined with a BCA protein assay kit (Beyotime Biotechnology, Shanghai, China). An aliquot was removed from each sample and the final protein concentration adjusted to 10 mg/ml with RIPA lysis buffer containing PMSF. Equal amounts of total protein from each mouse sample were then loaded into a 15% SDS-PAGE gel and the proteins resolved. Separate gels were generated for each protein of interest to be probed in order to avoid the issue of stripping/re-probing impacting on antigen detections.
The separated proteins were then electrotransferred to 0.45-μm PVDF membranes and nonspecific binding blocked by incubation of the membranes at room temperature for 2 h in a 3% BSA-TBST (TBS buffer containing 0.5% Tween 20) solution. After gentle rinsing with TBST, membranes were incubated overnight at 4 °C in TBST containing anti-TNFα (1:1000 dilution), -TNFR1 (1:1000 dilution), -RIPK3 (diluted at 1:1000 dilution), -p-RIPK3 (diluted at 1:1000), -MLKL (diluted at 1:1000), or -p-MLKL (1:1000 dilution) antibodies; in each case, the solution also contained the mAb against GAPDH (diluted at 1:10 000) to control for protein loading. Thereafter, each membrane was washed with TBST and then incubated at room temperature for 2 h in a solution of TBST containing anti-rabbit or anti-mouse IgG antibodies (each 1:10 000 dilution). Target proteins were then detected using an enhanced chemiluminescence (ECL) system and quantified in a ChemiScope 6000 imager (Clinx Science Instruments Co., Shanghai, China). Band density was then evaluated using Image-Pro software. All expression values were normalized to GAPDH content.
Enzyme-linked immunosorbent assays (ELISA)
Mouse ELISA kits were purchased from Mlbio (Shanghai, China) to measure serum α1-MG and β2-MG levels, following manufacturer instructions. All samples were analyzed in triplicate.
Statistical analysis
All data were expressed as means ± SD. All statistical analyses were performed using Prism software version 6.0 (GraphPad, San Diego, CA). A one-way analysis of variance (ANOVA) was also used to compare the differences between any two animal groups. A p value < 0.05 was considered as statistically significant.
Results
Sensitization rate and renal tubule damage in TCE-treated mice
Based on the cutaneous scoring, a total of 19 mice were judged as sensitization positive and the overall sensitization rate (except blank and vehicle control) was 32.20% (19/59). Then, the mice were assigned to TCE sensitization positive (TCE+) and negative (TCE−) groups, with or without R7050 pretreatment. All groups and sensitization rates are listed in . No significant differences in sensitization rate were found between the TCE only and TCE + R7050 groups.
Table 1. Mouse groups and sensitization rates.
Based on H&E staining, an increase in epidermal thickness with keratinocyte edema could be found in the TCE-sensitized mice (). In line with the skin changes, a series of inflammation-associated morphological changes, like tubular cell swelling, interstitial edema, and structural rearrangement of renal tubules, was found in the TCE-sensitized mice (). No obvious pathological changes in the skin and kidney were noted among the blank control, vehicle control, and TCE− mice. In addition, serum α1-MG and β2-MG levels were higher in the TCE+ mice than in their TCE− counterparts. No significant differences in these indexes were noted among the blank control, vehicle control, and TCE− mice (). These results highlight the morphologic and functional damage to renal tubules that evolves during the process of TCE sensitization.
Figure 2. Cutaneous pathological changes of TCE-sensitized mice. (A) Blank control, (B) Vehicle control, (C) TCE+, and (D) TCE− mice. Black arrow shows epidermal thickening and keratinocyte edema in TCE-sensitized mice. Magnification 400×. Scale bars = 50 μm.
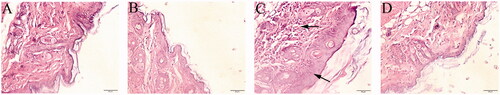
Figure 3. Renal pathological and functional changes in TCE-sensitized mice. (A) Blank control, (B) Vehicle control, (C) TCE+ and (D) TCE− mice. Black arrow shows tubular cell swelling, interstitial edema, or structural rearrangement of renal tubules. Magnification, 400×. Scale bars = 50 μm. Mouse serum levels of (E) α1-MG and (F) β2-MG. All data shown are means ± SD. Level of significance *p < 0.05. A representative image is presented for each group.
Renal tubular epithelial cells (RTEC) damage contributes to TCE-induced tubule damage
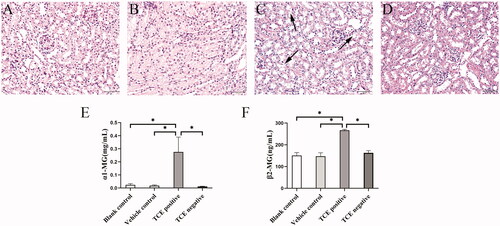
Due to extensive morphological changes in TCE-induced kidney damage, renal tubular epithelial cell (RTEC) damage was evaluated for ultrastructural changes. As shown in , swollen mitochondria, broken mitochondrial ridges, broken endoplasmic reticuli, organelle dissolution, and cytomembrane rupture could be found in cortex samples from TCE-sensitized mice. These findings suggest RTEC damage might play a critical role in TCE-induced kidney damage.
Figure 4. TCE sensitization-induced renal tubular epithelial cell damage in mice. (A) Rupture of cell membrane, (B) rough endoplasmic reticulum broken and expanded, and (C) Mitochondrial rupture and edema in RTEC of TCE-sensitized mice. A representative image is presented.
RIPK3/MLKL-mediated RTEC necroptosis is exhibited in TCE-sensitized mice
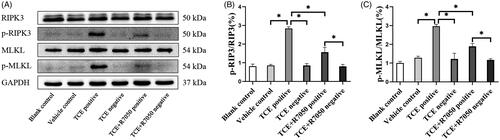
Using cytokeratin (CK)-18 as a benchmark for RTEC, two key phosphorylated proteins indicative of necroptosis in mice kidney were co-located. Based on immunofluorescence co- localization analysis, this study found that both p-RIPK3 and p-MLKL were expressed in the RTEC of TCE-sensitized mice (). Expression of both p-RIPK3 and p-MLKL seemed to be up-regulated in TCE+ mice compared to in tissues from vehicle control and TCE− mice ( and ). Further, Western blots confirmed there were increases in both p-RIPK3 and p-MLKL expression in the TCE+ vs. in the TCE− mice. However, expressions of p-RIPK3 and p-MLKL were decreased in the TCE + R7050+ mice relative to in TCE+ mice. No significant differences in expression were noted among the blank, vehicle, TCE−, and TCE + R7050− mice (). These results suggested that RTEC necroptosis plays a role in TCE-induced renal tubule damage.
Figure 5. Co-location analysis of key necroptosis molecules in kidney of TCE-sensitized mice. (A) p-RIPK3 staining as Red, (B) CK18 staining as marker of renal tubular epithelial cells, (C) DAPI staining as blue. (D) Overlap of A–C. (E) p-MLKL staining as Red, (F) CK18 staining as marker of renal tubular epithelial cells, (G) DAPI staining as blue. (H) Overlap of E–G. Magnification 400×. Scale bars = 50 μm.
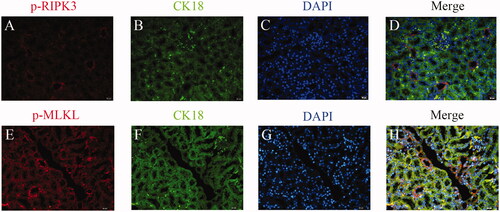
Figure 6. Expression of p-RIPK3 in RTEC of TCE-sensitized mice by immunofluorescence. (A) Blank control, (B) Vehicle control, (C) TCE+, (D) TCE−, (E) TCE + R7050+ group, (F) TCE + R7050− group. Red: p-RIPK3; Green: CK-18; Blue: DAPI. Magnification 400×. Scale bars = 50 μm.
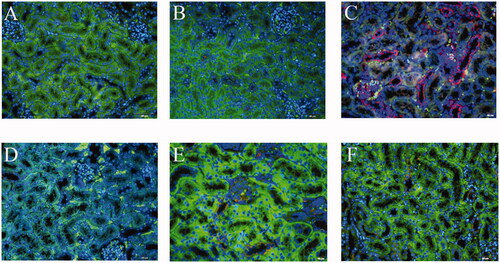
Figure 7. Expression of p-MLKL in RTEC of TCE-sensitized mice by immunofluorescence. (A) Blank control, (B) Vehicle control, (C) TCE+, (D) TCE−, (E) TCE + R7050+ group, (F) TCE + R7050− group. Red: p-MLKL; Green: CK-18; Blue: DAPI. Magnification 400×. Scale bars = 50 μm.
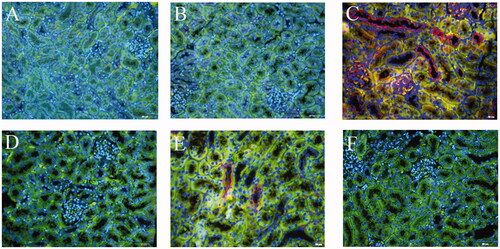
Figure 8. p-RIPK3 and p-MLKL expression in TCE-sensitized mice RTEC. (A) Representative immunoblot of central molecules of necroptosis in mice kidneys. Relative expression of (B) p-RIPK3 and (C) p-MLKL normalized to GAPDH. All data shown as means ± SD. Level of significance *p < 0.05.
TNFα/TNFR1 axis promotes RTEC necroptosis in TCE-sensitized mice
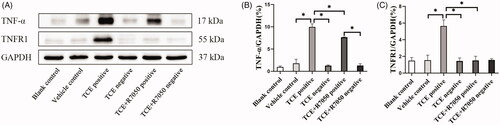
Due to an initial role of TNFα in RIPK3/MLKL-mediated necroptosis, the TNFα/TNFR1 axis in the current model was explored. An increase in expression of TNFα () and its receptor TNFR1 () was mainly found in the renal tubules of the TCE+ hosts (p < 0.05). When R7050 (antagonist of TNFR1) was administered to mice to block the TNFα/TNFR1 axis, it was seen that expressions of both TNFα and TNFR1 (in TCE + R7050 positive group) were significantly lower than in TCE+ mice. No obvious expression of these proteins was found among tissue samples from the blank control, vehicle control, TCE−, and TCE + R7050− mice. As shown in , in parallel to immunohistochemical analysis, Western blotting also showed there was a distinct up-regulation of TNFα and TNFR1 in tissues from the TCE+ hosts compared to in samples from mice in the other groups. There was also a significant down-regulation of TNFα and TNFR1 expression in tissues from the TCE + R7050+ group compared to those from the TCE+ group. Of note, p-RIPK3 and p-MLKL expression were significantly decreased in TCE + R7050+ mice relative to levels seen with samples from the TCE+ mice ().
Figure 9. Local expression of TNFα in mice kidneys. (A) Blank control, (B) Vehicle control, (C) TCE+, (D) TCE−, (E) TCE + R7050+, (F) TCE + R7050− mice. Magnification 400×. Scale bars = 50 μm. Representative blots from each group are shown.
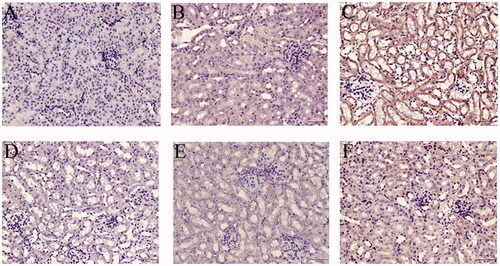
Figure 10. Local expression of TNFR1 in mice kidneys. (A) Blank control, (B) Vehicle control, (C) TCE+, (D) TCE−, (E) TCE + R7050+, (F) TCE + R7050− mice. Magnification 400×. Scale bars = 50 μm. Representative DAB staining pattern from each group are shown.
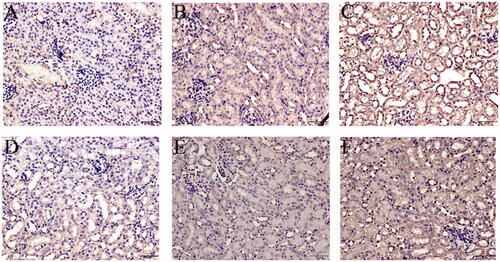
Figure 11. TNFα and TNFR1 expression in TCE-sensitized mice RTEC. (A) Representative immunoblot for expression of TNFα, TNFR1, and GAPDH in mouse kidney. (B) Relative expressions of TNFα and (C) TNFR1 normalized to GAPDH. All data shown are means ± SD. Levels of significance *p < 0.05.
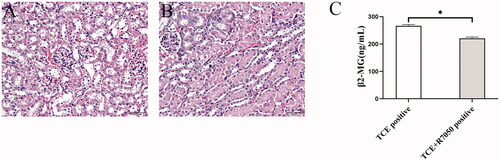
Blocking TNFα ameliorated renal tubule damage in TCE-sensitized mice
As noted above, immunohistochemistry and Western blotting confirmed pretreatment of mice with 12 mg R7050/kg could effectively block the TNFα/TNFR1 axis in TCE+ mice. Strikingly, this study further found that the morphologic changes in the renal tubules of TCE + R7050+ mice were TNFα-ameliorated relative to those in the TCE only positive mice (). In addition, serum β2-MG levels were reduced in the TCE + R7050+ mice relative to those in TCE+ hosts (). In general, these data suggested that blocking TNFα could efficiently inhibit RTEC necroptosis and ameliorate renal tubule damage in TCE-sensitized mice.
Figure 12. TNFα inhibition ameliorated renal tubule damage in TCE-sensitized mice. (A,B) Histopathological structure of renal tubules in TCE + R7050+ and TCE+ mice (magnification 400×). Scale bars = 50 μm. (C) Renal tubule function, assessed via serum β2-MG, in mice. All data are shown as means ± SD. Levels of significance *p < 0.05.
Discussion
This study sought to define a more detailed mechanism for how TCE exposure could induce the kidney damage that is associated with THS/OMDT. In general, TCE sensitization-induced kidney damage that develops in workers repeatedly occupationally exposed to this solvent is thought to arise in part from an induced imbalance between pro- and anti-inflammatory responses in these hosts.
Previous studies from our laboratories showed that TCE exposures led to an abundance of pro-inflammatory cytokines like TNFα, IL-1β, and IL-6 in host renal tubules (Zhang et al. Citation2016; Wang, Huang, Yang et al. Citation2019). As complement activation is a crucial amplifier of local inflammatory responses during kidney damage, some earlier studies also evaluated anaphylatoxins C3a, C5a, and terminal complement complex C5b-9 levels in TCE-exposed hosts; these in particular were evaluated as each could help recruit immune cells to the kidney and thereby magnify any ongoing inflammatory states (Zhang et al. Citation2016; Wang, Huang, Dai et al. Citation2019; Wang, Huang, Yang et al. Citation2019). Based on those earlier findings, it would seem changes induced in host innate immunity might be a crucial factor in the development of TCE-induced kidney damage.
In a variety of kidney pathologies, processes related to inflammation in the renal tubules have gained growing attention (Chen et al. Citation2018; Shen et al. Citation2019). In response to stimulation with various chemical agents in vivo or in vitro, renal tubular cells undergo changes due to inflammation that lead to re-absorption dysfunctions (Cui et al. Citation2020; Teixeira et al. Citation2020). Diffuse inflammation in both kidneys has been documented in OMDT patients (Liu Citation2009). Considering that before clinical treatment, higher levels of urinary NGAL, α1-MG, and β2-MG protein were found in OMDT patients than after clinical treatment (and also compared to levels in normal controls) (data not shown), this suggests a crucial role for inflammatory effects on renal tubular cells during the development of TCE-induced kidney damage.
In the current mouse model of THS, histopathological changes in the renal tubules and ultrastructural changes within RTECs were noted. Typical inflammation-induced changes like tubular cell edema and interstitial edema were also found in the renal tubules of the TCE-sensitized mice here. Among the ultrastructural changes seen, swelling mitochondria, broken mitochondria ridges, broken endoplasmic reticuli, organelle dissolution, and cytomembrane rupture were evident. It was noted that morphological features on the host RTEC were inconsistent with apoptosis, an outcome that has routinely been considered as the primary form of regulated cell death induced by TCE exposure (Doonan and Cotter Citation2008; Xie, Wang, et al. Citation2021; Xie, Yang, et al. Citation2021). Thus, it was important here to further explore mechanisms underlying induction of RTEC damage to better understand how any TCE-induced imbalance in local pro- and anti-inflammatory responses might underlie this damage.
Necroptosis is a novel pattern of programed cell death that develops within inflammatory microenvironments in both acute and chronic (Chen et al. Citation2018) kidney injury. As a result of necroptosis, there is increased release of inflammatory mediators into the tissue by the newly dead cells that, in turn, perpetuate the kidney damage and ultimately lead to renal failure (Wang et al. Citation2020). To discern if RTEC necroptosis was a novel mechanism underlying TCE-induced kidney damage, this study examined (via transmission electron microscopy) morphological changes in the host cells to see if they might be consistent with those associated with necroptosis. This study also then quantified local levels of key necroptosis-related molecules by immunofluorescence and Western blotting. The data showed for the first time that TCE sensitization resulted in increased expression of both p-RIPK3 and p-MLKL in host RTEC.
As the above evidence clearly suggests necroptosis is likely an important mechanism in the etiology of TCE-induced kidney damage, and because TNFα is known to trigger necroptosis (Dondelinger et al. Citation2016), this study then evaluated if pharmacological inhibition of TNFα could ameliorate RTEC necroptosis and mitigate kidney damage induced by TCE. Evaluations of TNFα levels in TCE-sensitized mice were performed. In TCE-sensitized mice, there was an over-expression of TNFα in the kidneys. However, when the mice were pretreated with R7050 (specific antagonist of TNFα; Gururaja et al. Citation2007) that blocks the TNFα/TNFR1 axis, both p-RIPK3 and p-MLKL expression were decreased and pathological changes in renal tubules were reduced. These outcomes were consistent with those of (Wen et al. Citation2019) who reported that R-7050 treatment significantly inhibited KLF4 deficiency-induced kidney injury and necroptosis in a mouse model of chronic kidney disease. The authors noted that this effect was likely via inhibition of macrophage secretion of TNFα. Based on those findings and the data in this study, this clearly suggests that RIPK3/MLKL-mediated RTEC necroptosis is an important novel mechanism that contributes to the onset of kidney damage that develops after TCE exposures.
Even with the results here, there remains a question as to if other types of renal toxicities (even non-immune-related) could be induced that lead to the onset/progression of OMDT. When one compares the proposed underlying contact sensitivity mechanisms against other types of renal toxicity mechanisms that could be induced by TCE, for example, acute renal injury, chronic renal injury, and renal cancer (Lock and Reed Citation2006), it remains to be determined what role(s) TCE-induced immunomodulation may play in the pathologies that arise in the kidneys of these exposed hosts. A growing number of studies of immune-based mechanisms underlying TCE- induced kidney injury have considered these to be complex ones involving Type II, III, and IV hypersensitivities. Recent studies found that complement components C3a and C5a (players in Type II\III hypersensitivity) could modulate T-cell differentiation and so lead to aggravated inflammatory responses that would lead to/amplify TCE-induced kidney damage (Wang et al. Citation2014; Wang, Huang, Yang et al. Citation2019). In addition, the terminal complement C5b-9 complex was found to activate NLRP3 signaling and reduce megalin and cubilin-mediated renal tubule protein uptake, resulting in kidney structural and functional damage (Wang, Huang, Dai et al. Citation2019; Xie, Yang, et al. Citation2021).
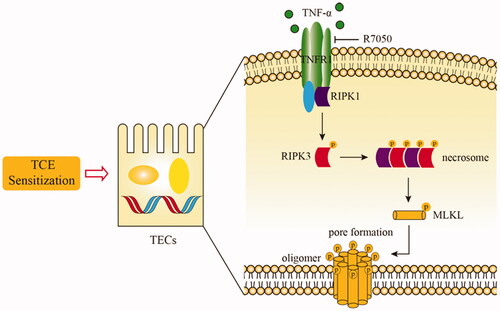
Unlike those studies, this research focused on necroptosis – a new form of programed cell death and found that renal cell necroptosis was a novel mechanism underlying TCE-induced kidney damage. The study also demonstrated that blocking TNFα could effectively inhibit renal cell necroptosis and lead to improved renal function in TCE-sensitized mice. Lastly, this study also showed that changes induced within the TNFα/TNFR1 axis seemed to be key events during the induction of damage to the kidneys that arose from TCE sensitization ().
Figure 13. Schematic model of possible molecular mechanisms of TNFα/TNFR1 mediated- necroptosis during TCE sensitization.
In conclusion, OMDT is a rare but fatal occupational disorder that, to date, still lacks any specific treatment in the clinical setting. Though large-dose glucocorticoids have been one method some have used to try to treat OMDT, there still is not yet enough positive evidence to prove that OMDT patients benefit from this mode of treatment. The present findings now open the possibility that use of therapeutics that target TNF or use of TNF-related agents (like infliximab, etanercept, or adalimumab) could eventually become a novel OMDT treatment. Such types of clinical treatments/evaluations merit further study once the findings here can be extrapolated to findings in actual OMDT patients.
Additional potential source for correspondence
Dr. Qixing Zhu, Department of Dermatology and Key Laboratory of Dermatology, Ministry of Education, The First Affiliated Hospital of Anhui Medical University, #218 Jixi Road, Hefei, China. (T) 8655162923009 (E) [email protected].
Disclosure statement
The authors declare no conflicts of interest. The authors alone are responsible for the content of this manuscript.
Additional information
Funding
References
- Chen H, Fang Y, Wu J, Chen H, Zou Z, Zhang X, Shao J, Xu Y. 2018. RIPK3-MLKL-mediated necroinflammation contributes to AKI progression to CKD. Cell Death Dis. 9(9):878.
- Cui D, Liu S, Tang M, Lu Y, Zhao M, Mao R, Wang C, Yuan Y, Li L, Chen Y, et al. 2020. Phloretin ameliorates hyperuricemia-induced chronic renal dysfunction through inhibiting NLRP3 inflammasome and uric acid reabsorption. Phytomedicine. 66:153111.
- De Miranda B, Greenamyre J. 2020. Trichloroethylene, a ubiquitous environmental contaminant in the risk for Parkinson’s disease. Environ Sci Process Impacts. 22(3):543–554.
- Dondelinger Y, Darding M, Bertrand M, Walczak H. 2016. Poly-ubiquitination in TNFR1-mediated necroptosis. Cell Mol Life Sci. 73(11–12):2165–2176.
- Dondelinger Y, Declercq W, Montessuit S, Roelandt R, Goncalves A, Bruggeman I, Hulpiau P, Weber K, Sehon C, Marquis R, et al. 2014. MLKL compromises plasma membrane integrity by binding to phosphatidylinositol phosphates. Cell Rep. 7(4):971–981.
- Doonan F, Cotter T. 2008. Morphological assessment of apoptosis. Methods. 44(3):200–204.
- Duan X, Liu X, Liu N, Huang Y, Jin Z, Zhang S, Ming Z, Chen H. 2020. Inhibition of keratinocyte necroptosis mediated by RIPK1/RIPK3/MLKL provides a protective effect against psoriatic inflammation. Cell Death Dis. 11(2):134.
- Gururaja T, Yung S, Ding R, Huang J, Zhou X, McLaughlin J, Daniel-Issakani S, Singh R, Cooper R, Payan D, et al. 2007. A Class of small molecules that inhibit TNFα-induced survival and death pathways via prevention of interactions between TNFαRI, TRADD, and RIP1. Chem Biol. 14(10):1105–1118.
- Li J, McQuade T, Siemer AB, Napetschnig J, Moriwaki K, Hsiao YS, Damko E, Moquin D, Walz T, McDermott A, et al. 2012. The RIP1/RIP3 necrosome forms a functional amyloid signaling complex required for programmed necrosis. Cell. 150(2):339–350.
- Liu J. 2009. Clinical analysis of seven cases of trichloroethylene medicamentose-like dermatitis. Ind Health. 47(6):685–688.
- Lock E, Reed C. 2006. Trichloroethylene: Mechanisms of renal toxicity and renal cancer and relevance to risk assessment. Toxicol Sci. 91(2):313–331.
- Ministry of Health of China. 2006. GBZ 185-2006 diagnostic criteria of occupational medicamentosa-like dermatitis due to trichloroethylene. Beijing, China: Beijing People’s Press.
- Morten B, Anna G, Fenstad R, Bjørn H. 2016. Association between kidney cancer and occupational exposure to trichloroethylene. J Occup Environ Med. 58:957–959.
- Phillips RV, Rieswijk L, Hubbard AE, Vermeulen R, Zhang J, Hu W, Li L, Bassig BA, Wong JYY, Reiss B, et al. 2019. Human exposure to trichloroethylene is associated with increased variability of blood DNA methylation that is enriched in genes and pathways related to autoimmune disease and cancer. Epigenetics. 14(11):1112–1124.
- Shen B, Mei M, Pu Y, Zhang H, Liu H, Tang M, Pan Q, He Y, Wu X, Zhao H. 2019. Necrostatin-1 attenuates renal ischemia and re-perfusion injury via meditation of HIF-1α/mir-26a/TRPC6/PARP1 signaling. Mol Ther Nucleic Acids. 17:701–713.
- Shlomovitz I, Zargarian S, Erlich Z, Edry-Botzer L, Gerlic M. 2018. Distinguishing necroptosis from apoptosis. Meth Mol Biol. 1857:35–51.
- Teixeira D, Peruchetti D, Souza M, Henriques M, Pinheiro A, Caruso-Neves C. 2020. A high salt diet induces tubular damage associated with a pro-inflammatory and pro-fibrotic response in a hypertension-independent manner. Biochim Biophys Acta Mol Basis Dis. 1866(11):165907.
- Wang F, Huang L, Dai Y, Huang M, Jiang W, Ye L, Zhu Q. 2019. Terminal complement complex C5b-9 reduced megalin and cubilin-mediated tubule proteins uptake in a mouse model of trichloroethylene hypersensitivity syndrome. Toxicol Lett. 317:110–119.
- Wang F, Huang L, Yang P, Ye LP, Wu C, Zhu Q. 2019. Inflammatory kidney injury in trichloroethylene hypersensitivity syndrome mice: Possible role of C3a receptor in the accumulation of Th17 phenotype. Ecotoxicol Environ Saf. 186:109772.
- Wang F, Zha W, Zhang J, Li S, Wang H, Ye L, Shen T, Wu C, Zhu Q. 2014. Complement C3a binding to its receptor as a negative modulator of TH2 response in liver injury in trichloroethylene-sensitized mice. Toxicol Lett. 229(1):229–239.
- Wang H, Zhang J, Li S, Wang F, Zha W, Shen T, Wu C, Zhu Q. 2015. An animal model of trichloroethylene-induced skin sensitization in BALB/c Mice. Int J Toxicol. 34(5):442–453.
- Wang X, Yu Y, Xie H, Shen T, Zhu Q. 2019. Complement regulatory protein CD59a plays a protective role in immune liver injury of trichloroethylene-sensitized BALB/c mice. Ecotoxicol Environ Saf. 172:105–113.
- Wang Y, Zhang H, Chen Q, Jiao F, Shi C, Pei M, Lv J, Zhang H, Wang L, Gong Z. 2020. TNF-α/HMGB1 inflammation signalling pathway regulates pyroptosis during liver failure and acute kidney injury. Cell Prolif. 53(6):e12829.
- Wen Y, Lu X, Ren J, Privratsky J, Yang B, Rudemiller N, Zhang J, Griffiths R, Jain M, Nedospasov S, et al. 2019. KLF4 in macrophages attenuates TNFα-mediated kidney injury and fibrosis. J Am Soc Nephrol. 30(10):1925–1938.
- Xie H, Wang H, Wu Q, Peng J, Huang H, Wang Y, Huang M, Jiang W, Yang Y, Zhang X, et al. 2021. Endothelin-1/endothelin receptor type A-Angiopoietins/Tie-2 pathway in regulating the cross-talk between glomerular endothelial cells and podocytes in trichloroethylene-induced renal immune injury. J Inflamm Res. 14:761–776.
- Xie H, Yang L, Yang Y, Jiang W, Wang X, Huang M, Zhang J, Zhu Q. 2021. C5b-9 membrane attack complex -activated NLRP3 inflammasome mediates renal tubular immune injury in TCE-sensitized mice. Ecotoxicol Environ Saf. 208:111439.
- Zhang J, Zha W, Ye L, Wang F, Wang H, Shen T, Wu CH, Zhu Q. 2016. Complement C5a-C5aR interaction enhances MAPK signaling pathway activities to mediate renal injury in trichloroethylene sensitized BALB/c mice. J Appl Toxicol. 36(2):271–284.
- Zhang L, She X, Li M, Huang L, Liu J. 2011. Dynamic observation on kidneys, livers and spleens by brightness mode ultrasonic imaging in patients of occupational medicamentosa-like dermatitis induced by trichloroethylene. Chin J Ind Med. 24:185–187.