
Abstract
Most current methods to assess T-cell-dependent antibody responses (TDAR) are semi-quantitative and based on measures of antibody titer generated against a standard antigen like keyhole limpet hemocyanin (KLH). The precision, sensitivity, and convenience of TDAR assays might be improved by applying rapid, sensitive, specific cytometric bead assays (CBA). In the study here, KLH antigen was covalently coupled onto the surface of cytometric beads using immune microsphere technology, and IgM antibody capture spheres were prepared for use in pretreatment processing of samples. The working parameters associated with this novel TDAR-CBA system were optimized in orthogonal experiments. The optimal concentration of the KLH coating solution in this system was 160 μg/ml, that of the anti-KLH IgG capture spheres 6.0 × 10⁵/ml, and the optimal dilution of fluorescein isothiocyanate (FITC)-conjugated Affini-Pure Goat Anti-Mouse IgG (H + L) was 60 μg/ml. Repeated tests indicated that this approach yielded good linearity (r2 = 0.9937) method, with a within-run precision of 3.1–4.9%, and a between-run precision of 4.4–4.9%. This new approach had a limit of detection of 113.43 ng/ml (linear range = 390.63–50 000), and an interference rate of just 0.04–3.51%. Based on these findings, it seems that a new mouse TDAR assay based on CBA can be developed that would appear to be more sensitive, accurate, and precise than the current TDAR assay approaches based on traditional ELISA.
Introduction
The T-cell-dependent antibody response (TDAR) is an immune function response in which B-cells produce specific antibodies after contacting T-cell-dependent antigens. Presently, TDAR assays are used in studies to determine drug immunotoxicity (Rhodes et al. Citation2012; Vandebriel et al. Citation2014). These assays mostly use indirect ELISA to detect KLH (Keyhole limpet hemocyanin)-specific antibodies. One reason for the favored use of this antigen is that it is a soluble, stable, immunogenic protein that can be easily standardized and acquired (Ladics 2018). While TDAR assays are mostly qualitative, semi-quantitative results are mostly expressed in terms of antibody titers. As such, some TDAR assays cannot always reflect the inhibitory potentials of some immunosuppressants with a high degree of sensitivity and/or precision (Swaminathan et al. Citation2014; Plitnick and Herzyk Citation2010).
Cytokines and other soluble proteins secreted by cells (or those released by damaged/lysed cells) can be quantified using cytometric bead arrays (CBA). This technology was developed in 2004 by organically integrating polystyrene microspheres, fluorescent dye labeling, laser technology, applied fluidics, data analysis software, and flow cytometry for use with microspheres. In these assays, organic polymer microspheres function as carriers; they are coated with antigen-specific monoclonal antibodies (capture antibodies), reacted with standard substances or test samples and fluorescein-labeled antigen-specific monoclonal antibodies (test antibodies), and then quantified using a fluorescence sensor (Koper et al. Citation2015; den Hartog et al. Citation2020). Standard CBA are not limited by the sizes of cells, bacteria, or particles being evaluated for cyto-/chemokine production, as the stand-alone microspheres have diameters of 2–15 μm and can be easily sorted away. Use of a flow cytometer ensures there is precise, stable, and consistent detection of the final tagged spheres (Houser Citation2012; Liu et al. Citation2012; Manglani et al. Citation2019).
Compared with traditional immune response systems, data in a CBA can be generated by focusing on a specific number of microspheres during each assay and analyzing overall means\medians of signals; this ensures stable results and good reproducibility. Interference by non-target molecules can also be eliminated through preliminary screenings of fluorescence scatter-plots (Elshal and McCoy Citation2006; Lin et al. Citation2015). Because CBA convert light/fluorescence signals into voltage and integrated pulses, this amplifies actual signals. As such, detection sensitivity is improved 10–100-fold compared with that seen in most traditional immunoassays (Markou et al. Citation2011; McDonald et al. Citation2016).
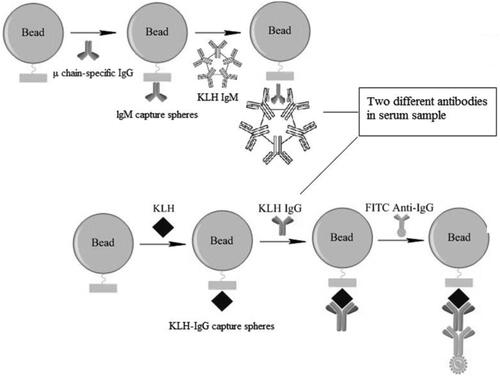
In the current study, experiments were undertaken to improve the precision and sensitivity of TDAR assays (for BALB/c mice) by establishing a novel CBA. The results from the system developed here showed that production of anti-KLH specific IgG was rapidly detectable using a one-step CBA (). To optimize antigen coating processes, subsequent microsphere reactions, and the parameters associated with the fluorescent antibodies used in this new method, an orthogonal experiment that included three factors and five levels was employed.
Figure 1. Schematic of cytometric bead array (CBA) used to evaluate TDAR outcomes. Serum samples were incubated with IgM capture microspheres, and the IgM in each isolated. Anti-KLH IgG in serum was then captured by KLH-coated microspheres where they formed antigen-antibody complexes. FITC-labeled goat anti-mouse IgG was then used to couple the complexes. Finally, fluorescence intensity on the microspheres was analyzed by flow cytometry. Estimation of anti-KLH IgG levels in each sample was performed by extrapolation from a standard curve generated in parallel.
Materials and methods
Animals
BALB/c mice (female, 6–8-wk-of-age, 18–22 g) were purchased from the Changsha Tianqin Biotechnology Co. (Changsha, China). On arrival, mice were housed in polypropylene cages in specific pathogen-free rooms maintained at 20–26 °C with a 40–70% relative humidity and a 12-h light:dark cycle. All animals had ad libitum access to standard rodent chow and filtered tap water. All experiments were approved and proceeded under the Hainan Medical College Animal Care and Use Committee (HYLL-2021-148).
Reagents
BPLX MAG COOH Beads #26, BPLX MAG COOH Beads #45, Bio-Plex Amine Coupling Kits and ProteOn Amine Coupling Kits all were purchased from BioRad (Hercules, CA). Fluorescein-isothiocyanate (FITC)-conjugated AffiniPure goat anti-mouse IgG (1.5 mg/ml stock), AffiniPure goat anti-mouse IgM (μ chain-specific IgG; 2.3 mg/ml stock), FITC-AffiniPure goat anti-mouse IgG (H + L), and horseradish peroxidase (HRP)-conjugated goat anti-mouse IgG (2.0 mg/ml stock) were all obtained from Jackson ImmunoResearch (West Grove, PA). Purified mouse anti-KLH polyclonal IgG (0.4 mg/ml stock) was bought from Aibixin Biotechnology(Shanghai, China). Other reagents purchased were as follows: KLH (Sigma, St. Louis, MO); Tween-20 (Aladdin, Shanghai, China); phosphate-buffered saline (PBS [pH 7.4]; Boster Biological Technology, Wuhan, China); bovine serum albumin (BSA; Yuanye Biotechnology, Shanghai, China); and, cyclophosphamide (CYP: Jiangsu Baxter Oncology Gmbh; Kantstr, Halle, Germany).
Preparation of anti-KLH IgG capture spheres
Carbonate coating buffer (pH 9.6) containing 20–320 μg KLH antigen/ml and 3–7 × 10⁵ activated BIO-RAD 45# microspheres was shaken at room temperature in the dark for 2 hr. The coupled cytometric beads were then pelleted by centrifugation (14 000×g, 4 min, 4 °C), washed (washing buffer provided in Bio-Plex Amine Coupling Kit), and then placed in blocking buffer (in kit) to prevent nonspecific binding. Thereafter, the beads were stored in a kit storage buffer at 4 °C in the dark.
Preparation of lgM capture spheres
Activated BIO-RAD 26# microspheres in solution were mixed with 23 μg/ml Affini-Pure goat anti-mouse IgM (μ-chain specific IgG) in antibody coating buffer (PBS, pH 7.4) and the solution then shaken at room temperature in the dark for 2 h. The coupled beads were then pelleted by centrifugation (14 000×g, 4 min, 4 °C), washed (kit washing buffer), and then placed in kit blocking buffer to block nonspecific binding. The beads were then stored in kit storage buffer at 4 °C in the dark.
Reaction conditions for the orthogonal experiment
and show the three factors (e.g. KLH antigen, anti-KLH IgG capture spheres, and FITC-labeled goat anti-mouse IgG) and the five concentrations for each of them in the orthogonal assays. The mean fluorescence intensity (MFI) of FITC labeling was detected by flow cytometry(Accuri C6, BD, the United States), and the optimal experimental conditions were determined by range analysis.
Table 1. Factors and levels of orthogonal experimental design.
Table 2. Orthogonal test design.
Serum sample preparation
To assay each serum sample, IgM capture spheres (3 μl containing 6000–8000 spheres) were first suspended in 50 μl PBS/test sample. Aliquots of serum were diluted 1:100 in 1% BSA/PBS (total volume of 50 μl) and then combined with 50 µl of the IgM capture sphere suspension, and the combined materials then shaken for 1 hr at room temperature in the dark. The suspension was then centrifuged and 50 μl of resultant supernatant isolated for analysis. Standard solutions used for the analyses were prepared as 1:4–1:2048 dilutions from a stock of 0.4 mg purified mouse anti-KLH IgG/ml in 1% BSA/PBS. Assays using negative controls contained PBS only.
Protocol of TDAR assay based on cytometric bead array
Aliquots (50 µl) of the serum samples and standards (each now bound to anti-KLH IgG capture spheres) were combined with 50 μl of anti-KLH IgG capture spheres in buffer and incubated at room temperature for 2 hr in the dark. Thereafter, 100 μl FITC-labeled goat anti-mouse IgG antibody was added and the solutions were incubated for a further 1 h at room temperature in the dark. Resulting complexes were isolated by centrifugation (14 000×g, 4 min, 4 °C), washed with 0.05% (v/v) Tween-20/PBS (PBS-T) solution, and then re-suspended in 200 µl PBS. The samples were then measured for mean fluorescence intensity (MFI) in an Accuri C6 flow cytometer system (Becton Dickinson, Franklin Lakes, NJ). The corresponding FITC fluorescence signal was pre-determined by defining the best test signal area using FSC/SSC scatter plot counting. Thereafter, calculation of anti-KLH lgG antibody concentration in each sample was performed by extrapolation from a standard curve generated in parallel.
Assessment of assay linear range, within-/between-run precision, and limit of detection
Mean fluorescence intensity (MFI) was plotted against diluted anti-KLH lgG concentrations and a standard curve derived to determine the assay linear range. To calculate assay within- and between-run precision, anti-KLH lgG was diluted with 1% BSA/PBS to yield high, medium, and low (e.g. 50 000, 6280, and 781.25 ng/ml) concentrations in this linear range. The within-run and between run standard concentrations were determined 10 times each under optimized experimental conditions, to calculate within- and between-run precision. To calculate the assay limit of detection (LOD), blank samples with PBS (control) and the low-concentration of the anti-KLH lgG standard (390.63 ng/ml) were each evaluated 10 times using the optimized assay conditions to obtain the mean (Mean) and standard deviation (SD) of their respective MFI. Based on a 99.7% confidence interval, the LOD was calculated as (Clow concentration × 3SDblank)/(Meanlow concentration – Meanblank) (Lin et al. Citation2006).
Interference test
Interfering samples were prepared by mixing 1:100-diluted “blank serum” (i.e. serum from KLH-unimmunized [naïve] hosts) with the standards, at a standard:blank ratio of 5:1. IgG concentrations of the standards before and after adding the interfering substance were then determined using KLH antigen coating concentrations, anti-KLH lgG capture bead concentrations, FITC-conjugated Affinipure goat anti-mouse IgG concentrations that had been optimized as above. From changes due to presence of the “blank,” the interference rate was calculated.
Direct comparison of the two different evaluation methods
For this assay, 12 SPF grade BALB/c mice were randomly divided into a control and a CYP group (according to body weight). Mice in the CYP group were injected intravenously with 20 mg CYP/kg once daily for 3 days (Gong et al. Citation2015); control mice received an equal volume of 0.9% sodium chloride solution each time (vehicle). The first antigen immunization was performed by intraperitoneal injection of KLH (to deliver 5 mg/kg) (Kawai et al. Citation2013) at 24 h after the final CYP (or vehicle) dosing. A booster KLH immunization was performed 7 d later. Eight days after this booster, the mice were euthanized by intraperitoneal injection of an sodium pentobarbital, abdominal aortic blood was collected, and serum isolated/stored for later evaluation (see Supplemental Figure 1 for assay timeline).
Detection using the ELISA titration method: coating concentration for the wells of 96-well plate was 80 μg KLH/ml, the dilution of the horseradish peroxidase (HRP)-conjugated goat anti-mouse IgG was 1:16 000 (Chang et al. Citation2019), and serum samples were diluted 1:100, 1:200, 1:400, etc. for the analyses. Results were deemed positive when the value derived from the equation (ODsample serum – ODblank control)/(ODnegative control – ODblank control) was >2.1. The maximum antibody titer from positive sample was logarithmically transformed for use in later statistical analyses. The CBA method used the optimized test conditions noted above to evaluate serum anti-KLH levels.
Statistical analysis
All data were analyzed using SPSS software (v.17, SPSS Inc., Cary, NC). Orthogonal data were evaluated using range analysis, and the results then fitted using a linear regression equation. Within-/between-run precision is expressed as relative standard deviation (RSD). The differences between groups were analyzed using a paired t-test; at p < 0.05, differences between the groups were considered significant.
Results
Orthogonal assays, and assay linear range, between- and within-run precision, and LOD
The results of the range analysis () showed that the optimal conditions were A4, B4 and C2, i.e. a coating concentration of 160 μg KLH/ml, an anti-KLH IgG capture sphere density of 6.0 × 10⁵/ml, and a fluorescent antibody concentration of 60 μg/ml. The linear regression analysis of standards (390.63–50 000 ng/ml) revealed good linearity (i.e. y = 0.8061x + 6.6265, r2 = 0.9937) (). Standards at high, medium, and low concentrations (e.g. 781.25, 6250, 50 000 ng/ml) were used to evaluate method precision. The results obtained for within-run precision evaluations were 3.47, 3.14, and 4.90% for each respective concentration, and for between-run evaluations 4.50, 4.42, and 4.87%, respectively. Taken together, these outcomes agreed with a relative standard deviation of < 5% based on within- and between-run precision ( and ). These findings indicated the precision of this TDAR assay based on use of cytometric beads was good. In the assessments of assay LOD, the mean and standard deviation of the MFI for the blank samples were 2491.90 and 830.58, respectively, whereas those of the standard were 11 072.63 and 696.07, respectively. From these values, the calculated detection LOD for the anti-KLH IgG was 113.43 ng/ml. Lastly, the results of measures of the IgG found that the presence of “blank serum” (i.e. serum from KLH-unimmunized [naïve] hosts) in the system resulted in an antibody interference rate of just 0.04–3.51%. As such, the interference rate of the matrix was deemed to be within ± 5% ().
Figure 2. Linear and linear range of the assay. When concentration of the standard was between 391 and 50 000 ng/ml, linear regression analysis revealed good linearity (i.e. y = 0.8061x + 6.6265, r2 = 0.9937).
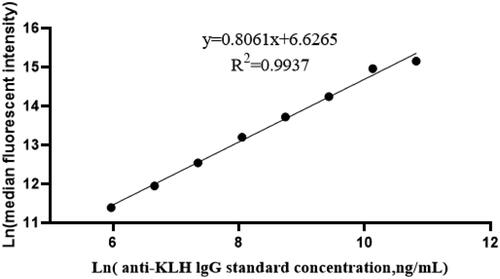
Table 3. Orthogonal test results.
Table 4. Results for the RSD of within groups.
Table 5. Results for the RSD between groups.
Table 6. Interference test results based on cytometric bead array.
Effect of IgM capture spheres on serum samples
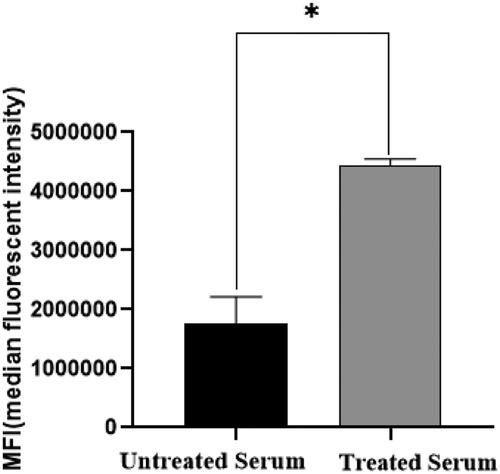
The studies here also evaluated the ability of IgM capture spheres to reduce any effects of matrix interference. The results indicated that the MFI fluorescence signal intensity was significantly increased after the serum samples were incubated with the spheres (). This indicated that the anti-KLH specific IgM antibody in the test samples was removed, which in turn resulted in reduced interference.
Figure 3. MFI results before and after adding lgM capture ball. To reduce the influence of anti-KLH IgM on detection results, the serum sample was combined with a solution containing an IgM capture ball to mitigate/remove any such influence. The data show the MFI of anti-KLH IgG capture spheres increased after pre-clearing of the samples with IgM capture spheres. *Value significantly different at p < 0.05.
Test results comparing the two different assays systems
The results showed that both detection methods could accurately reflect that effect of the immunosuppressant CYP on host anti-KLH IgG antibody production (compared with the control blood levels; and ). However, because the indirect ELISA titrimetric method could reflect a singular accurate concentration, by necessity, individual data are presented as titer ratios that represent a concentration interval rather than a specific concentration value (that is obtainable with the CBA approach).
Table 7. TDAR/ELISA analysis: Titer results for serum IgG in peripheral blood.
Table 8. TDAR/CBA analysis results of serum IgG in peripheral blood.
Discussion
The TDAR assay can be used to determine responses of B-cells to T-cell-dependent antigens (with the assistance of TH2 cells). For many years, the TDAR assay has been considered a functional test with relatively good predictability for detecting the potential immunotoxicity of many novel drugs. The National Toxicology Program (NTP) recommends TDAR and NK activity assays as first choices for immune function evaluation to assess immunotoxicities of novel substances (Boorman et al. Citation2002). The ICH S8 guideline also recommends monitoring immune endpoints in general toxicity tests, with the TDAR being a recommended approach (ICH Citation2005). When combined with measures of relevant hematological parameters and histologic examination of the thymus and spleen of the model host, TDAR and the NK activity assays can screen out potential immunomodulants at the earliest stages of drug development.
At present, most toxicological evaluations that rely on TDAR assays are based on results associated with ELISA antibody titers (Aarntzen et al. Citation2012; Kawai et al. Citation2013; Legrand et al. Citation2013; Peachee et al. Citation2014). While the basic principles underlying ELISA and cytometric bead arrays (in TDAR assays) are related to the specific binding of antigen and antibody, the two assay approaches are clearly not the same. For example, the signal source in a TDAR ELISA is based on presence of reaction products generated enzymatically that are then evaluated using a detector set at a fixed absorbance wavelength. In this case, the absorbance value is proportional to the level of antibody in an examined sample. In comparison, the CBA approach employs specific excitation wavelengths based on the fluorescent tag on the microsphere, and then detects the sphere corresponding emission fluorescent signal through a fluorescence monitor. In this case, the fluorescence signal intensity is proportional to the amount of antibody in the sample examined. Compared with the ELISA, CBA appear to be more convenient, save on operation time, and improve the detection efficiency of antibodies in test samples (Bellisario et al. Citation2001; Dunbar Citation2006; Yates et al. Citation2011; Roberts et al. Citation2014; Tcherniaeva et al. Citation2018).
In the study here, a TDAR assay for BALB/c mice was established based on a CBA that conferred precision, sensitivity, and convenience, thus improving assay precision and sensitivity. Here, microspheres served as reaction carriers, and complexes consisting of microspheres, KLH-specific IgG antibody, and a fluorescent detection antibody were formed during coupling and antigen-antibody reactions. To define the optimal concentrations of the antigen coating, microsphere, and fluorescent antibodies for this novel analysis, an orthogonal experiment was performed. The analyses showed that the optimal coating concentration for KLH in this experimental paradigm was 160 μg/ml, that of the anti-KLH IgG capture spheres 6.0 × 10⁵/ml, and that of the FITC-conjugated AffiniPure Goat Anti-Mouse IgG (H + L) was 60 μg/ml. Based on these results, deviations among the results were also analyzed using precision tests; the precision of this novel TDAR assay – based on the use of cytometric beads – was determined to be good (Cheng et al. Citation2017; Chang et al. Citation2019; Wallwitz et al. Citation2019).
All the results (re: reactions) in this TDAR based on a CBA are based on analysis of fluorescence intensity of the binding protein/antibody microspheres in the liquid environment. Because the beads are in this microenvironment, all aspects of their surface can interact with target antigens, thus making for more favorable reactions between the fluorescent probe and the target substance (Pickering et al. Citation2002; Morgan et al. Citation2004). In comparison, in an ELISA where the test antigen is bound to walls of wells in plates, the reaction area is limited, and so binding reactions between antigen and host antibody are often insufficient. At the same time, because an ELISA detects a chemical reaction between antibody-bound enzyme (often an antibody to “host antibody in test sample”) and a kit substrate to produce a depth of color indicating (after comparison against standard curve) the level of host antibody present in test sample, there is thus also a need for an assay developer to derive the optimal enzyme-substrate reaction time for each ELISA being created. As such, in comparison to the novel assay described here, there are many factors that could affect accurate measures of a host antibody against a known antigen (here, KLH).
For comparative purposes against any standard ELISA used for TDAR measures, this novel CBA-based approach was shown to have high sensitivity (detection limit = 113.43 ng/ml), linearity (r2 = 0.9937, regression equation y = 0.8061x + 6.6265), and a low rate of interference (0.04–3.51%) under the optimized conditions defined here. The experiment results also showed that the interference rate from any “blank serum” was < 5%, indicating that an added presence of any non-target (i.e. here non-anti-KLH) antibodies in a serum sample did not significantly influence assay results (Li et al. Citation2018). When taken together, these results strongly suggest that TDAR assays based on a CBA could meet the requirements for desirable experimental accuracy and precision as defined in Selman et al. (Citation2012), Chang et al. (Citation2019) and Hijaz and Killiny (Citation2020).
From the experimental results, it can be seen that both detection methods readily show that the immunosuppressant CYP could reduce anti-KLH IgG antibody production in the hosts. However, in terms of data processing, the ELISA titration method required statistical analysis of the positive maximum antibody titer results after logarithmic transformation. In comparison, the CBA method could readily quantify levels of the antibody in each sample by extrapolation from a standard curve generated in parallel. As such, compared with the ELISA approach, the CBA method was more convenient and quicker, its accuracy was higher, the overall experimental operation was more convenient, and it appeared the CBA could more accurately assess antibody production in a host.
Conclusions
The TDAR-CBA designed here would seem to better than a traditional TDAR-ELISA titer method based on comparisons of sensitivity, precision, and accuracy. At the same time, the TDAR-CBA presents the used with a wider detection range than a TDAR-ELISA for the detection of anti-KLH antibody in a test sample. Based on convenience, the TDAR-CBA seems to also be simples, can be performed in a far shorter operation time, saves on sample size required, and has a greater detection efficiency.
Author contributions
Authors Zhong and Yang contributed to the conception and design of the study; Zhong contributed to data curation. Zhong, Yang, Chang, Zhong, and Lian contributed significantly to data analysis and manuscript preparation.
Supplemental Material
Download MS Word (24.3 KB)Disclosure statement
The authors declare no conflict of interest. The authors alone are responsible for the content of this manuscript.
Data availability statement
Datasets used/analyzed during in current study are available from the corresponding author on reasonable request.
Additional information
Funding
References
- Aarntzen E, de Vries I, Goertz J, Beldhuis-Valkis M, Brouwers H, van de Rakt M, van der Molen R, Punt C, Adema G, Tacken P, et al. 2012. Humoral anti-KLH responses in cancer patients treated with dendritic cell-based immunotherapy are dictated by different vaccination parameters. Cancer Immunol Immunother. 61(11):2003–2011.
- Bellisario R, Colinas R, Pass K. 2001. Simultaneous measurement of antibodies to three HIV-1 antigens in newborn dried blood-spot specimens using a multi-plexed microsphere-based immunoassay. Early Hum Dev. 64(1):21–25.
- Boorman G, Haseman J, Waters M, Hardisty J, Sills R. 2002. Quality review procedures necessary for rodent pathology databases and toxicogenomic studies: The National Toxicology Program experience. Toxicol Pathol. 30(1):88–92.
- Chang P, Huang L, Huang M, Tian S, Yang Z. 2019. Improvement and optimization of a T-cell-dependent antibody response (TDAR) method for BALB/c mice using keyhole limpet hemo-cyanin (KLH) as specific antigen. J Immunotoxicol. 16(1):149–154.
- Cheng J, Zhao Y, Zhang M, Zhang Y, Liu X, Yan X, Wang Y, Sun Z, Wang Q, Qu H. 2017. Development of fluorescence-linked immunosorbent assay for icariin. J Fluoresc. 27(5):1661–1665.
- Den Hartog G, Schepp R, Kuijer M, van Kessel C, van Beek J, Rots N, Koopmans M, van der Klis F, van Binnendijk R. 2020. SARS-CoV-2-specific antibody detection for seroepidemiology: A multiplex analysis approach accounting for accurate seroprevalence . J Infect Dis. 222(9):1452–1461.
- Dunbar S. 2006. Applications of Luminex xMAP technology for rapid, high-throughput multiplexed nucleic acid detection. Clin Chim Acta. 363(1-2):71–82.
- Elshal M, McCoy J. 2006. Multiplex bead array assays: Performance evaluation and comparison of sensitivity to ELISA. Methods. 38(4):317–323.
- Gong Y, Wu J, Li S. 2015. Immuno-enhancement effects of Lycium ruthenicum Murr. polysaccharide on cyclophosphamide-induced immunosuppression in mice. Intl J Clin Exp Med. 8:20631–20637.
- Hijaz F, Killiny N. 2020. Evaluation of oxytetracycline metabolites cross-reactivity with oxytetracycline enzyme-linked immunosorbent assay (ELISA). Antibiotics. 9(4):183.
- Houser B. 2012. Bio-Rad's Bio-Plex® suspension array system, xMAP technology overview. Arch Physiol Biochem. 118(4):192–196.
- ICH. 2005. Harmonized tripartite guideline: Immunotoxicity studies for human pharmaceuticals, S8. https://www.ema.europa.eu/en/documents/scientific-guideline/ich-s-8-immunotoxicity-studies-human-pharmaceuticals-step-5_en.pdf
- Kawai R, Aida T, Hattori H, Furukawa T, Mori K, Takasaki W, Takahashi N, Kawada T. 2013. Evaluation of canine T-cell dependent antibody response to the primary and secondary immunization with keyhole limpet hemocyanin. J Toxicol Sci. 38(4):571–579.
- Kawai R, Ito S, Aida T, Hattori H, Kimura T, Furukawa T, Mori K, Sanbuissho A, Kawada T. 2013. Evaluation of primary and secondary responses to a T-cell-dependent antigen, keyhole limpet hemocyanin, in rats. J Immunotoxicol. 10(1):40–48.
- Koper OM, Kamińska J, Kemona H, Dymicka-Piekarska V. 2015. Application of the bead-based technique in neurodegeneration: A literature review. Neurodegener Dis. 15(5):281–293.
- Ladics G. 2018. The sheep erythrocyte T-dependent antibody response (TDAR). Meth Mol Biol. 1803:83–94.
- Legrand J, Bouchez C, Mimouni C, N'Guyen A, Bouchard J, Ameller T, Descotes J. 2013. Immunotoxic effects of cyclophosphamide and cyclosporine in the dog. J Immunotoxicol. 10(1):90–95.
- Li P, Ye H, Liu J, Jin H, Lin Y, Yan S, Yu Y, Gao L, Xu F, Zhang Z. 2018. Evaluation of a newly developed quantitative determination kit for tumor marker CA15-3 with chemiluminescent assay. J Clin Lab Anal. 32(1):e22158.
- Lin A, Salvador A, Carter J. 2015. Multi-plexed microsphere suspension array-based immuno-assays. Meth Mol Biol. 1318:107–118.
- Lin T, Liang S, Meng F, Han Q, Guo C, Sun L, Chen Y, Liu Z, Yu Z, Xie H, et al. 2006. Enhanced immunogenicity and antitumour effects with heterologous prime-boost regime using vaccines based on MG7-Ag mimotope of gastric cancer. Clin Exp Immunol. 144(2):319–325.
- Liu Y, Xu Z, Zhang Q, Jin M, Yu J, Li J, Liu N, Cui S, Kong X, Wang H, et al. 2012. Simultaneous detection of seven enteric viruses associated with acute gastroenteritis by a multiplexed Luminex-based assay. J Clin Microbiol. 50(7):2384–2389.
- Manglani M, Rua R, Hendricksen A, Braunschweig D, Gao Q, Tan W, Houser B, McGavern D, Oh K. 2019. Method to quantify cytokines and chemokines in mouse brain tissue using Bio-Plex multiplex immunoassays. Methods. 158:22–26.
- Markou A, Strati A, Malamos N, Georgoulias V, Lianidou E. 2011. Molecular characterization of circulating tumor cells in breast cancer by a liquid bead array hybridization assay. Clin Chem. 57(3):421–430.
- McDonald J, Ekeruche-Makinde J, Ho M, Tregoning J, Ashiru O. 2016. Development of a custom pentaplex sandwich immunoassay using protein-G coupled beads for the Luminex® xMAP® platform. J Immunol Methods. 433:6–16.
- Morgan E, Varro R, Sepulveda H, Ember J, Apgar J, Wilson J, Lowe L, Chen R, Shivraj L, Agadir A, et al. 2004. Cytometric bead array: A multiplexed assay platform with applications in various areas of biology . Clin Immunol. 110(3):252–266.
- Peachee V, Smith M, Beck M, Stump D, White K. 2014. Characterization of the T-dependent antibody response (TDAR) to keyhole limpet hemocyanin (KLH) in the Göttingen minipig . J Immunotoxicol. 11(4):376–382.
- Pickering J, Martins T, Greer R, Schroder M, Astill M, Litwin C, Hildreth S, Hill H. 2002. A multiplexed fluorescent microsphere immunoassay for antibodies to pneumococcal capsular polysaccharides . Am J Clin Pathol. 117(4):589–596.
- Plitnick L, Herzyk D. 2010. The T-dependent antibody response to keyhole limpet hemocyanin in rodents. Meth Mol Biol. 598:159–171.
- Rhodes M, Laffan S, Genell C, Gower J, Maier C, Fukushima T, Nichols G, Bassiri A. 2012. Assessing a theoretical risk of dolutegravir-induced developmental immunotoxicity in juvenile rats . Toxicol Sci. 130(1):70–81.
- Roberts C, Green T, Hess E, Matys K, Brown M, Haupt R, Luxembourg A, Vuocolo S, Saah A, Antonello J. 2014. Development of a human papillomavirus competitive luminex immunoassay for 9 HPV types. Hum Vaccin Immunother. 10(8):2174–2174.
- Selman L, Henriksen M, Brandt J, Palarasah Y, Waters A, Beales P, Holmskov U, Jorgensen T, Nielsen C, Skjodt K, et al. 2012. An enzyme-linked immunosorbent assay (ELISA) for quantification of human collectin 11 (CL-11, CL-K1). J Immunol Methods. 375(1-2):182–188.
- Swaminathan A, Lucas R, Dear K, McMichael A. 2014. Keyhole limpet haemocyanin – A model antigen for human immunotoxicological studies. Br J Clin Pharmacol. 78(5):1135–1142.
- Tcherniaeva I, den Hartog G, Berbers G, van der Klis F. 2018. The development of a bead-based multiplex immunoassay for the detection of IgG antibodies to CMV and EBV. J Immunol Methods. 462:1–8.
- Vandebriel R, Tonk E, de la Fonteyne-Blankestijn L, Gremmer E, Verharen H, van der Ven L, van Loveren H, de Jong W. 2014. Immunotoxicity of silver nanoparticles in an intravenous 28-day repeated-dose toxicity study in rats. Part Fibre Toxicol. 11:21.
- Wallwitz J, Aigner P, Gadermaier E, Bauer E, Casanova E, Bauer A, Stoiber D. 2019. Validation of an enzyme-linked immunosorbent assay (ELISA) for quantification of endostatin levels in mice as a biomarker of developing glomerulonephritis. PLoS One. 14(8):e220935.
- Yates N, Lucas J, Nolen T, Vandergrift N, Soderberg K, Seaton K, Denny T, Haynes B, Cohen M, Tomaras G. 2011. Multiple HIV-1-specific IgG3 responses decline during acute HIV-1: Implications for detection of incident HIV infection. AIDS. 25(17):2089–2097.