
Abstract
Immunogenic cell death (ICD) is a form of cell death characterized by the release of danger signals required to trigger an adaptive immune response against tumor-associated antigens. Silver nanoparticles (AgNP) display anti-proliferative and cytotoxic effects in tumor cells, but it has not been previously studied whether AgNP act as an ICD inductor. The present study evaluated the in vitro release of calreticulin as a damage-associated molecular pattern (DAMP) associated with the cytotoxicity of AgNP and their in vivo anti-cancer effects. In vitro, mouse CT26 colon carcinoma and MCA205 fibrosarcoma cells were exposed to AgNP and then cell proliferation, adhesion, and release of calreticulin were determined. The results indicated there were time- and concentration-related anti-proliferative effects of AgNP in both the CT26 and MCA205 lines. Concurrently, changes in cell adhesion were detected mainly in the CT26 cells. Regarding DAMP detection, a significant increase in calreticulin was observed only in CT26 cells treated with doxorubicin and AgNP; however, no differences were found in the MCA205 cells. In vivo, the survival and growth of subcutaneous tumors were monitored after vaccination of mice with cell debris from tumor cells treated with AgNP or after intra-tumoral administration of AgNP to established tumors. Consequently, anti-tumoral prophylactic immunization with AgNP-dead cells failed to protect mice from tumor re-challenge; intra-tumor injection of AgNP did not induce a significant effect. In conclusion, there was a noticeable anti-tumoral effect of AgNP in vitro in both CT26 and MCA205 cell lines, accompanied by the release of calreticulin in CT26 cells. In vivo, immunization with cell debris derived from AgNP-treated tumor cells failed to induce a protective immune response in the cancer model mice. Clearly, further research is needed to determine if one could combine AgNP with other ICD inducers to improve the anti-tumor effect of these nanoparticles in vivo.
Introduction
Cancer resistance to chemo-/radiotherapy remains a significant clinical problem that leads to treatment failure or even cancer recurrence (Liu et al. Citation2021). Understanding the immunologic, cellular, and molecular mechanisms that lead to efficient malignant cell death may provide new targets in cancer therapies (Chen and Mellman Citation2013). One novel strategy for use in cancer therapy could be imparting a form of tumor cell death via induction of the immune system, such as occurs during immunogenic cell death (ICD).
ICD leads to the killing of malignant cells by the immune system through an adaptive immune response (Ahmed and Tait Citation2020). Thus, ICD is a form of cell death characterized by a specific immunity to antigens associated with dead cells, which is activated by the release, recognition and capture of damage-associated molecular patterns (DAMPs), including surface-expose calreticulin, high mobility group box 1 protein (HMGB1), Type I interferon (IFN), ATP, and annexin A1 (ANXAA1). Recognition of DAMPs by antigen-presenting cells (APC) triggers a cancer immunity cycle that activates naïve T-cells (Zhu et al. Citation2021).
Several cancer ICD inductors have been described, including various anti-cancer chemotherapeutic agents, irradiation, oncolytic viruses, high hydrostatic pressures, and photodynamic and photothermal therapy (Zhou et al. Citation2019). Predicting the ability and efficacy of any given ICD inducer may be complicated, and the identification of novel anti-cancer ICD inducers remains an important defiance. This is so because, ideally, an ICD inducer should be capable of inducing endoplasmic reticulum (ER) stress, reactive oxygen species (ROS), and the release of both DAMPS and immunogenic signals such as cytokines (Sun et al. Citation2021).
Evaluation of nanomaterials as ICD inducers in cancer could be a promising avenue due to their potential benefits, including the use of lower doses, minimal side effects, targeting efficiency, improved biodistribution, and pharmacokinetics (Liu et al. Citation2022). In this sense, silver nanoparticles (AgNP) are one of the most studied nanomaterials due to their wide biomedical applications, versatility, optical properties, the possibility of functionalization, and adaptability to chemical coating at their surface (Burdusel et al. 2018; Naganthran et al. Citation2022). At the same time, AgNP have been suggested to be useful as part of potential cancer therapies due to their anti-proliferative and cytotoxic effects (Gopisetty et al. Citation2019). Despite this, it is still not known whether AgNP can behave as ICD inductors.
Accordingly, the present study sought to address the hypothesis that the toxicological effects of AgNP could induce ICD through the release of DAMPS, which can recruit immune cells to activate the immune system. Similarly, this study sought to determine if either anti-tumoral prophylactic immunization with AgNP-dead cells or intra-tumor injection of AgNP could induce a protective immune response in vivo in mice, and if this event occurred in part via ICD-based mechanisms.
Materials and methods
Cell cultures and mice
CT26 mouse colon carcinoma and MCA205 mouse fibrosarcoma cell lines were provided by Dr. Ignacio Melero (Department of Tumoral Immunotherapy, CIMA Universidad de Navarra). Cells were grown in 75-cm2 flasks with RPMI-1640 Glutamax medium supplied with 10% fetal bovine serum, 1% L-glutamine, and 1% penicillin/streptomycin (all from Gibco, Thermo Fisher Scientific, Waltham, MA). The flasks used for the cell culture were maintained under standard conditions in a controlled atmosphere of a 37 °C, 5% CO2, 95% humidity incubator. Cells were detached from flasks with 0.25% trypsin/EDTA solution once cell confluence reached 80%. Subsequently, the cells were stained with trypan blue and quantified in a Neubauer chamber for later use throughout the different assays.
C57BL/6 and BALB/c mice (both female, 5–7-wk-of-age) were obtained from Envigo (Huntingdon, Cambridgeshire, UK) and maintained in a pathogen-free animal facility located at the CIMA Universidad de Navarra. All animals were kept under conditions of 24 °C with a 30–70% relative humidity and a 12-h light:dark cycle. All mice had ad libitum access to standard rodent chow and filtered tap water. All experiments were carried out according to the Federation of European Laboratory Animal Science Association and this study was approved by the Ethics Committee for Animal Experimentation (ECAE), at University of Navarra, Spain under Registry # 081-22.
Silver nanoparticle (AgNP) characterization
The AgNP used for this research were donated by Dr. Nina Bogdachikova, a scientific researcher at the Centro de Nanociencias y Nanotecnologia (CNyN) of the Universidad Nacional Autonoma de Mexico (UNAM). The AgNP were synthesized at the Vector-Vita Research and Production Center (Novosibirsk, Russia) and sold as Argovit-C®. This product contained 1.2% (w/w) of metallic silver and 18.8% (w/w) of polyvinylpyrrolidone (PVP) in an aqueous solution, with an integral AgNP concentration (metallic silver and PVP) of 200 g/L.
To establish AgNP shape and morphology, high-resolution transmission electron micro-scopy (HRTEM) images were obtained on a JEM 2010 electron microscope (JEOL, Tokyo, Japan) with a grating resolution of 0.14 nm at an accelerating voltage of 200 kV. Before the study, the sample was diluted 20-times with water and additionally sonicated to dissociate any aggregates. The aqueous solutions obtained were placed on perforated carbon films fixed on copper grids according to standard procedures, and after drying at room temperature, introduced into the electron microscope sample chamber. Histograms displaying the different morphologies and sizes of the sample were obtained using the Image J software (NIH, Bethesda, MD) (Schneider et al. Citation2012). UV-Visible spectra were obtained using a Cary 60 UV-Vis spectro-photometer (Agilent Technologies, Santa Clara, CA) after placing a solution of AgNP (0.03 mg/ml) in sterile water in a 1-mm path micro-quartz cuvette. In addition, Dynamic Light Scattering (DLS) and Zeta Potential measures of the particles (suspended in water at 1 µg/ml) were performed using a Zetasizer Nanoseries Instrument (Nano-ZS, Malvern Instruments, Malvern, UK). After the characterization, the AgNP were used for the in vitro and in vivo studies outlined below. In all cases, metallic silver was used as the reference to calculate AgNP concentrations used in each assay.
Cell proliferation assay
Cellular proliferation was determined using a methyl [3H]-thymidine incorporation assay (Perkin Elmer Inc., Boston, MA). In brief, cells were grown in 96-well plates at a density of 5 × 10⁴ cell/well in the presence/absence of the AgNP. After 24 and 48 h of culture, cells received 0.5 µCi/well of [3H]-thymidine and were incubated overnight. Thereafter, the cells were harvested and radioactivity was measured using a Top Count® NXTTM scintillation counter (PerkinElmer). The assay was repeated twice in independent experiments. Samples were evaluated each time at least four times.
Cellular adhesion assay
The cell adhesion index for the cells was quantified in real-time as an arbitrary unit of impedance disruption recorded using a system technology that works by measuring electron flow transmission into a microplate equipped with gold microelectrodes, in the presence of a conductive solution such as culture medium. In brief, a total of 15 × 103 cells were seeded into the wells of 16 well-plates. Subsequently, the plates were placed on an xCELLigence RTCA® Cell Analyzer instrument (Agilent Technologies) housed inside a standard CO2 incubator where the cells were stabilized for at least 6 h. Thereafter, the different AgNP treatments were applied, and adhesion monitoring evaluated in real-time. All data were analyzed (and cellular adhesion estimated) using RTCA software (v.1.2.1.1002). Each treatment condition was evaluated in triplicate.
Immunogenic cell death marker expression
Cell membrane expression of calreticulin by CT26 and MCA205 cells after incubation with AgNP for 48 h was evaluated using flow cytometry. This timepoint was selected since the maximum effect in the anti-proliferative activity was noted at 48 h. For this assay, both Alexa Fluor®-647-conjugated anti-calreticulin antibody (Abcam, Cambridge, UK) and APC/Cy7-conjugated anti-Zombie NIR cell death marker antibody (Biolegend, San Diego, CA) were employed. Here, cells were cultured in 12-well plates (at density of 5 × 10⁵/well). After 48 h of treatment with the test agent (or controls), the cells were removed, placed on ice, and then stained under dark conditions (following manufacturer protocols). After staining and repeated washings with flow cytometry staining buffer (containing 2% fetal bovine serum and 1% penicillin/streptomycin in phosphate-buffered saline [PBS, pH 7.4]), the cells were acquired in a Cytoflex S cytometer (Beckman Coulter, Santa Clara, CA) and analyzed using Flow Jo software (v.10.8, Ashland, OR). For all samples, a total of 50 000 events was acquired. The assay was repeated twice in independent experiments. Samples were evaluated each time in triplicate.
Anti-tumor prophylactic immunization and intra-tumor therapy
To evaluate potential anti-tumor immune responses in vivo, protocols for prophylactic anti-tumor immunization and therapeutic intra-tumor intervention were adopted from Casares et al. (Citation2005). In brief, BALB/c mice were injected subcutaneously in their left lower flank with a vaccine containing cell debris from 3 × 10⁶ dead CT26 cells treated earlier with the AgNP (at a concentration of 12 µg metallic silver/ml). The positive control mice received an anti-tumor vaccine comprised of cells treated with doxorubicin (25 µM) for 48 h. Doxorubicin was used as a positive control as it was shown that several anthracycline agents (like doxorubicin) mediate ICD. The negative control mice received debris from frozen/thawed cells (3 × 10⁶). Six mice were used from each condition group. In all cases, before preparing these vaccines for immunization, cell death was confirmed by trypan blue staining. One-wk post-vaccine injection, mice received 5 × 10⁵ live CT26 cells into their contralateral right lower flank. Subsequently, tumor growth/evolution, as well as host morbidity and mortality, were monitored.
In addition to prophylactic anti-tumor immunization, a therapeutic intra-tumor intervention was performed. Here, the BALB/c or C57BL/6 were subcutaneously injected into the right lower flank with, respectively, 5 × 10⁵ live CT26 or MCA205 cells. After the tumors reached 3 mm in diameter, AgNP (100 µl of an AgNP solution containing 12 µg metallic silver/ml) or doxorubicin (20 µM) were administered intra-tumorally. Untreated control mice were injected with 100 µl PBS. Tumor evolution and mouse survival were monitored at least twice a week for 14 wk. Mice were then euthanized by CO2 inhalation when tumor diameter reached 15 mm.
Statistical analysis
Data were captured and analyzed in Prism software (v.8, GraphPad, San Diego, CA). To determine the significance of differences for quantitative variables between three or more groups, a one-way analysis of variance (ANOVA) along with post-hoc comparisons was employed. Repeated-measure ANOVA and a two-way ANOVA were applied to compare differences in cell adhesion indices. A survival curve and a non-linear regression (centered third-order polynomial fitting curve) were used to determine the significance of differences in tumor development curves. In all instances, a p-value < 0.05 was considered statistically significant.
Results
Silver nanoparticle (AgNP) characterization
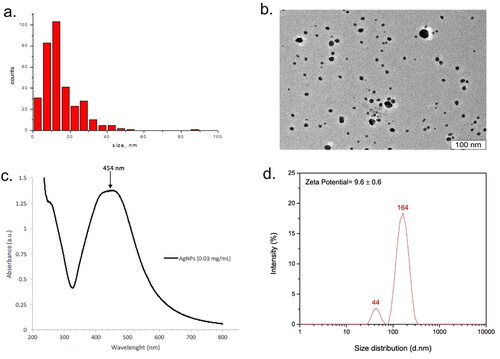
The AgNP formulation Argovit-C® used here was characterized by HR-TEM/UV-vis spectra. Based on the TEM images, these AgNP displayed a spherical morphology with an average diameter of 14.95 [± 10.1] nm (n = 333 particles), with a size distribution range between 1 and 55 nm (). The UV-Vis spectra (wavelengths ranging: 200–800 nm) recorded from the AgNP (at 0.03 mg/ml) revealed an absorption band at ∼454 nm (), a peak characteristic for surface plasmon resonance of AgNP. Lastly, the results shown in indicated that the hydrodynamic diameter distribution of the AgNP in ultrapure water yielded two size distributions (44 and 164 nm), with a zeta potential of 9.6 [± 0.6].
Figure 1. Physicochemical properties of AgNP. (a) HR-TEM images showing AgNP morphology. (b) Histogram of the nanoparticle size distribution. (c) UV-VIS absorption spectrum of AgNP (0.03 mg/ml) in distilled water. (d) Hydrodynamic diameter and zeta potential of AgNP in ultrapure water.
Cell proliferation
To determine anti-proliferative effects of the test AgNP, cell proliferation following the exposure of cells to AgNP (or to doxorubicin as a positive control) was analyzed. Compared to the untreated control cultures, CT26 cell proliferation decreased significantly after 24 and 48 h of treatment with almost all AgNP concentrations tested (except for 0.75 µg/ml at 24 h; ). However, with the mouse fibrosarcoma MCA205 cells, the anti-proliferative effects of the AgNP were observed mainly after 48 h with all the tested concentrations. This differs from the finding that after 24 h of exposure, only the highest AgNP concentrations (6.0 and 12.0 µg/ml) led to any significant effects in this cell line (). With both cell lines, as expected, doxorubicin imparted significant anti-proliferative effects.
Figure 2. Cell proliferation determined by the methyl [3H] thymidine incorporation assay after 24 and 48 h of exposure to AgNP. (a) Colon carcinoma CT26 cells. (b) Fibrosarcoma MCA205 cells. Values shown are mean ± SD of at least two independent experiments. Samples were evaluated each time at least four times. Statistical analysis: one-way ANOVA and Sidak’s multiple post-hoc comparisons. Significant differences versus untreated control indicated as **p < 0.01 and ****p < 0.0001.
![Figure 2. Cell proliferation determined by the methyl [3H] thymidine incorporation assay after 24 and 48 h of exposure to AgNP. (a) Colon carcinoma CT26 cells. (b) Fibrosarcoma MCA205 cells. Values shown are mean ± SD of at least two independent experiments. Samples were evaluated each time at least four times. Statistical analysis: one-way ANOVA and Sidak’s multiple post-hoc comparisons. Significant differences versus untreated control indicated as **p < 0.01 and ****p < 0.0001.](/cms/asset/a1b66389-7ac3-4b57-b009-6d41dd97264c/iimt_a_2175078_f0002_b.jpg)
Cell adhesion
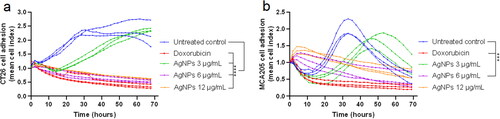
Cell adhesion is fundamental in modulating important processes like cell–cell communication, as well as cell proliferation, survival, migration, and differentiation (Hamidi et al. Citation2017). Here, the xCELLigence RTCA system was employed to monitor any AgNP-induced changes in cell adhesion in real-time. The results indicate that there was a significant decrease in cell adhesion index after exposure to AgNP. However, such changes were not uniform between cell lines, with there being a more pronounced effect in the CT26 cells than in MCA205 cells (). There was a noticeable decrease in the cell adhesion index in CT26 cells after 0.2 h AgNP treatment at concentrations of 3.0–12.0 µg/ml (). In comparison, significant effects were observed in the MCA205 cells only after 3.9 h exposure to 6.0 µg/ml of AgNP (); oddly, exposure to doses > 6.0 µg/ml imparted no significant effect, indicating a possible AgNP-induced cytostatic effect.
Figure 3. Cell adhesion index in real-time detected by xCELLigence RTCA system. (a) CT26 cells (b) MCA205 cells. Each treatment condition was evaluated in triplicate. Statistical analysis was performed using repeated measures ANOVA. Significant differences versus untreated control indicated as ***p < 0.001 and ****p < 0.0001.
Immunogenic cell death marker expression
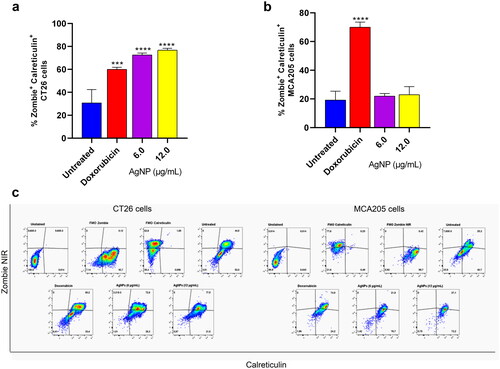
Having detected some effects on cell proliferation and adhesion due to the test AgNP, CT26 and MCA205 cells were incubated with AgNP for 48 h, and then calreticulin expression on the cell membrane surface was determined (as a DAMP marker characteristic of ICD). Specifically, the study analyzed the effects of AgNP on expression of calreticulin by dead cells stained with a dead marker (i.e. a Zombie NIR). The findings revealed there was a significant increase in calreticulin- and Zombie NIR-positive cells only among the CT26 cells (). Values were seen to increase to 76.8 [± 1.6]% calreticulin+ Zombie NIR+ double-positive CT26 cells compared to background expression levels of 30.8 [± 11.6]% in this cell line. There was no change in status for these markers among any of the treated MCA205 cells (). From this it could be concluded that these AgNP could be weak ICD inducers, but highly depending on the tumor cell model being evaluated. Indeed, exposure of both cells lines to doxorubicin resulted in a marked increase in the percentages of Zombie NIR+ and calreticulin+ cells for both lines ().
Figure 4. Detection of calreticulin on the cell membrane surface by flow cytometry. (a) CT26 cells. (b) MCA205 cells. (c) Representative cytometry dot plots. After 48 h of AgNP exposure, cells were washed and stained with an anti-calreticulin antibody marked with AF® 647 and Zombie NIR coupled to APC/Cy7. A total of 50 000 events for each sample were acquired on a Cytoflex S cytometer. Values shown are mean ± SD of at least two independent experiments. Samples were evaluated in triplicate each time. Differences in percentage of cells positive for calreticulin and Zombie NIR were analyzed by one-way ANOVA and Sidak’s multiple post-hoc test. Significant differences versus untreated control indicated as ***p < 0.001.
Prophylactic anti-tumor immunization
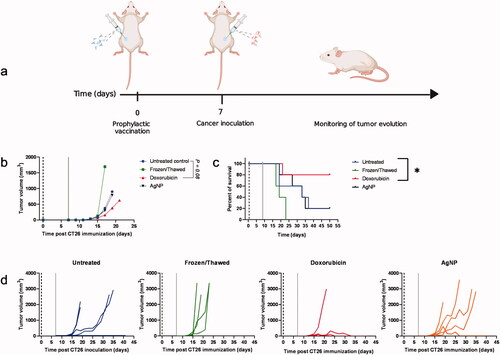
The hallmark of an ICD inducer is the ability to trigger an immune response in vivo when tumor cells killed with the inducer are used as a prophylactic vaccine. To address whether AgNP were potentially good ICD inducers, anti-tumor prophylactic immunization was performed using cell debris derived from AgNP-killed CT26 cells as a vaccine. At 1 wk after vaccination, mice were injected with live cancer cells, and then tumor growth, evolution, and host survival were monitored at least three times a week (for 14 wk; ). In this regard, compared to the untreated control, the highest percentages of survival (i.e. 80% vs. 20% in control mice) and the lowest tumor volumes (i.e. 626.7 [± 1180.0] mm3 vs. 900.0 [± 922.5] mm3 in control mice) were observed in doxorubicin-treated mice. No differences were noted in any of the mice in the AgNP groups ().
Figure 5. Anti-tumor prophylactic immunization with CT26 dead cells. (a) Schematic representation of the immunization assay. (b) Mean of tumor volume in each mouse group. (c) Percent survival. (d) Individual tumor growth in each mouse group. A vaccine model was developed with 3 × 10⁶ dead cells (killed by treating 48 h with AgNP, doxorubicin, or freeze/thaw cycles). Cell death was confirmed each time by trypan blue staining. One-wk post-vaccination, mice were injected in contralateral flank with 5 × 10⁵ live cells. Percentage host survival and tumor growth was monitored three times per week for up to 14 wk. Six mice were used from each condition group. Differences were compared using survival curves and non-linear regression model with a third-order polynomial fitting curve (*p < 0.05). Dark dashed lines represent the day of vaccination with the CT26 cell debris; gray lines represent the challenge with live cells.
Intra-tumoral therapy
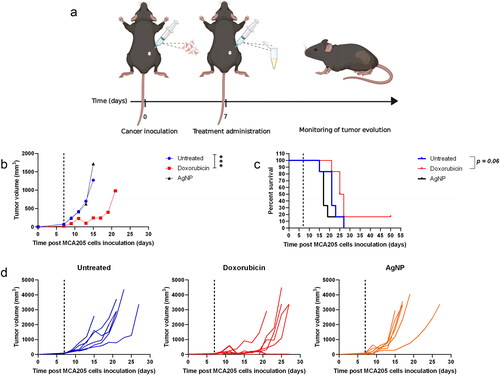
To evaluate potential intra-tumoral therapeutic effects of AgNP and doxorubicin, subcutaneous tumors were induced by inoculation of live CT26 cells into the right flank of BALB/c mice and live MCA205 cells into the flank of C57BL/6 mice. Once the tumors reached ≈ 3-mm diameter (1 wk later), mice grouped in the AgNP category were injected with 100 µl of AgNP dissolved in PBS [at 12 µg metallic silver/ml]. Mice in the doxorubicin group were intra-tumorally treated with 20 µl doxorubicin (10 mM). Survival and tumor growth were then monitored at least three times per week for 14 wk. When compared to the untreated control mice, a greater survival percentage and notable anti-tumor effects were seen in those mice treated with doxorubicin (vs. control), while no significant effects were detected in mice intra-tumorally treated with AgNP ( and ).
Figure 6. Intra-tumoral therapy in a CT26 colon carcinoma model in BALB/c mice. (a) Schematic representation of the immunization assay. (b) Mean tumor volume for each mouse group. (c) Percent survival. (d) Individual tumor growth in each mouse group. Subcutaneous tumors were induced by injection of 5 × 10⁵ live CT26 cells into in the right flank of BALB/c mice. Approximately a week later [once tumors reached 3-mm diameter], mice were injected intra-tumorally with AgNP or doxorubicin. AgNP mice received 100 µl of AgNP (at 12 µg metallic silver/ml) doxorubicin mice received 20 µl of 10 mM drug solution. Survival and tumor growth were monitored at least three times per week for up to 14 wk. Six mice were used from each condition group. Differences were compared by survival curves and non-linear regression model with a third order polynomial fitting curve (*p < 0.05 and ***p < 0.001). Dark dashed lines represent the day of treatment administration.
![Figure 6. Intra-tumoral therapy in a CT26 colon carcinoma model in BALB/c mice. (a) Schematic representation of the immunization assay. (b) Mean tumor volume for each mouse group. (c) Percent survival. (d) Individual tumor growth in each mouse group. Subcutaneous tumors were induced by injection of 5 × 10⁵ live CT26 cells into in the right flank of BALB/c mice. Approximately a week later [once tumors reached 3-mm diameter], mice were injected intra-tumorally with AgNP or doxorubicin. AgNP mice received 100 µl of AgNP (at 12 µg metallic silver/ml) doxorubicin mice received 20 µl of 10 mM drug solution. Survival and tumor growth were monitored at least three times per week for up to 14 wk. Six mice were used from each condition group. Differences were compared by survival curves and non-linear regression model with a third order polynomial fitting curve (*p < 0.05 and ***p < 0.001). Dark dashed lines represent the day of treatment administration.](/cms/asset/6a8b0566-0ac3-4b6e-a617-412c2c0d8b78/iimt_a_2175078_f0006_c.jpg)
Figure 7. Intra-tumoral therapy in MCA205 fibrosarcoma model in C57BL/6 mice. (a) Schematic representation of the immunization assay. (b) Mean tumor volume for each mouse group. (c) Percent survival. (d) Individual tumor growth in each mouse group. Subcutaneous tumors were induced by injection of 5 × 10⁵ live MCA205 cells into in the right flank of C57BL/6 mice. Approximately a week later (once tumors had reached 3-mm diameter), the mice were injected intratumorally with AgNP or doxorubicin AgNP mice received 100 µl of AgNP (at 12 µg metallic silver/ml) doxorubicin mice received 20 µl of 10 mM drug solution. Survival and tumor growth were monitored at least three times per week for up to 14 wk. Six mice were used from each condition group. Differences were compared by survival curve and non-linear regression model with a third-order polynomial fitting curve. (***p < 0.001). Dark dashed lines represent the day of treatment administration.
Discussion
Silver nanoparticles (AgNP) are promising nanomaterials due to their wide applications in biomedicine based on their capabilities as antimicrobial, antifungal, antiviral, biosensor, and bioimaging agents (Zhang et al. Citation2016). Most studies agree that AgNP have anti-cancer properties and can induce anti-proliferative effects that are mediated by increased lipid peroxidation, formation of reactive oxygen species (ROS), and induction of oxidative stress (Asharani et al. Citation2009) in affected cells.
After they are taken up into cells, AgNP cause damage to different cellular organelles, including the plasmatic membrane, nucleus, endoplasmic reticulum, and mitochondria. As such, the structure/stability of mitochondria might then be disrupted by the AgNP, leading to impaired electron transport and ROS over-production (Li et al. Citation2021). In turn, the ROS produced by the AgNP can generate endoplasmic reticulum stress. This stress could compound that already in place due to an accumulation of affected misfolded proteins in the organelle. Specifically, misfolded proteins can result from an overwhelmed ubiquitin-proteasome system arising from AgNP interfering with ubiquitin modifications (Mao et al. Citation2016). In the end, such misfolded protein aggregates in cells are highly cytotoxic and can induce a non-apoptotic cell death (Holmila et al. Citation2019).
It is not yet clear whether AgNP are inductors of immunogenic cell death (ICD) in cancers. Therefore, it is of great importance to evaluate potential anti-tumoral mechanisms of AgNP, and to better understand the biological impacts from exposure to AgNP. In the study here, whether the cytotoxicity of AgNP induced the release of calreticulin as a DAMP, leading to the induction of ICD in murine models of CT26 colon carcinoma and MCA fibrosarcoma, was investigated.
The results here showed there was an anti-tumoral effect from AgNP in vitro, an outcome consistent with previous studies that evaluated cytotoxic effects of AgNP in various cancer cell lines (Han et al. Citation2014; Swanner et al. Citation2019). Li et al. (Citation2020) showed that exposure of HepG2 cells to AgNP induced cytotoxicity as a result of a targeted disruption of mitochondrial function and structure, which triggered autophagy and apoptosis through a mitochondrial pathway (Huo et al. Citation2015). According to the proliferation and cell adhesion results here, AgNP induced significant anti-proliferative and cytotoxic effects in both the CT26 and MCA205 cell lines. In addition, based on the findings here, it could be concluded that anti-proliferative effects of AgNP were not only cell-dependent but also both time- and concentration-related.
It is well known that the physicochemical properties of AgNP, including their size, shape, surface charge, surface modification, and agglomeration, are determinative factors for the toxic effects of AgNP (Li et al. Citation2021). In the research here, Argovit-C®, which averaged 14 [± 10] nm in size, was employed. Considering particle size is a critical characteristic that correlates positively with cytotoxicity (because this parameter influences particle entry into cells), the size of Argovit-C may have been a relevant property to induce cytotoxicity, in addition to other additional properties, such as its spherical shape which favors higher surface to volume ratios and thus providing a more effective potential for release of silver cations (Raza et al. Citation2016).
Protein denaturation, DNA damage, oxidative stress, and endoplasmic reticulum stress are cytotoxic mechanisms associated with exposures to AgNP; these events, in turn, are associated with an exposition and release of several types of DAMPs, including calreticulin (Holmila et al. Citation2019; Li et al. Citation2021). Calreticulin exposure on the surface of the cell membrane is an important hallmark of ICD, which serves as an ‘eat-me’ signal that contributes to the engulfment of dying cells by APC of the immune system to provide a source of antigenic material for a further adaptive immune response (Fucikova et al. Citation2021). In the current study, after exposure to AgNP, a significant increase in calreticulin+ cells was detected among the CT26 cells, but not among the MCA205 cells. These data suggest that CT26 cells could have a higher sensitivity to AgNP compared to MCA205 cells, which could be consistent with previous reports that demonstrated different susceptibilities to AgNP effects between different of cell lines/types (Huo et al. Citation2015). Based on the findings here, it is feasible that MCA205 cell line exposure to AgNP activates a classic tolerogenic form of apoptosis without exposure of endogenous calreticulin while the AgNP exposure to CT26 cells probably trigger another cell death modality characterized by calreticulin exposure. In this context, the AgNP effects are particularly specific in each cell type and distinct signaling pathways and cell death modalities such as apoptosis, necrosis, and autophagy can be triggered by exposure to these particles (Zhang Citation2016).
Nevertheless, in any case, it would still be of great interest to investigate whether cell exposure to AgNP interferes with the molecular mechanisms underlying the translocation of calreticulin to the surface membrane (such as phosphorylation of eIF2α required for translocation of calreticulin from the endoplasmic reticulum to the cell surface), in order to better understand the findings obtained here.
To investigate whether AgNP behave as ICD inductors, whether an anti-tumor immune response is mounted in vivo through the release of DAMPs was assessed. To achieve this, a prophylactic immunization with debris derived from AgNP-killed CT26 cells was performed. Then, a week later, live CT26 cells were injected to investigate whether this vaccination could prevent tumor development and growth. The data indicated that cell debris derived from AgNP-killed cells did not mount an immune response, while doxorubicin was able to induce significant protection against a subsequent challenge with live CT26 cells. These data therefore suggest that AgNP induce non-immunogenic tumor cell death.
Lastly, an intra-tumoral protocol was used here to evaluate if the nanoparticles elicited an efficient anti-tumor immune response. The results however indicated there were no changes in tumor volume nor in host survival after intra-tumoral therapy using AgNP. At this time, no explanation for why mice in the AgNP groups did not show significant effects from the treatment can be provided. In this regard, the present data suggest that AgNP could induce non-immunogenic cell death. Previously, it was demonstrated that AgNP induced expression of genes for apoptosis and elicited mitochondria-dependent apoptosis and non-canonical autophagy in HT-29 colon cancer cells (Bao et al. Citation2022). The present results support the view that apoptotic cells induced by AgNP are most likely ‘silently’ cleared by phagocytic cells without creating a ‘loud’ alert of the host immune system (as suggested in Pitt et al. [Citation2017]), and as such, no anti-tumoral immune response could be initiated by these treated cells.
It remains a possibility that a cellular self-protection mechanism could be activated after exposure to AgNP. It has been reported that cellular cytotoxicity induced by AgNP could trigger stress response programs to mitigate damage and protect the cell against AgNP’ cytotoxicity. These programs could include mitogen-activated protein kinase (MAPK) signaling pathways and phosphorylation of eukaryotic initiation factor (eIF)-2α (Zhang et al. Citation2016). Huo and colleagues demonstrated that after in vitro or in vivo exposure to AgNP, there was an activation of downstream signaling pathways associated with endoplasmic reticulum stress, including phosphorylation of eIF-2α (Huo et al. Citation2015). It should be noted that eIF-2α phosphorylation is a protective mechanism that occurs in cells to achieve a temporal arrest of translation under cellular stress conditions (Yoon et al. Citation2017).
Finally, due to their unique cytotoxic properties, AgNP could be valuable as an anti-cancer agent for clinical purposes such as tumor therapies. However, although the uptake, fate, and interactions of AgNP with different human cells have been examined, the mode by which AgNP can induce cell death in mammalian cells remains unpredictable (Kovács Citation2022). In the present study, whether the toxicological effects of AgNP could induce ICD through the release of DAMPS was investigated; however, the findings here showed AgNP induce a non-immunogenic tumor cell death. In addition, it remains essential to understand how the biological features of the cancer cells potentially influence any beneficial effects of AgNP. Therefore, knowledge about mechanisms and modality of cell death induced by AgNP persists as a critical issue in the advancement of their potential use in clinical settings. Addressing these issues would be helpful in assuring the overall safety of AgNP by leaving other non-target organs unaffected.
Conclusions
Though the findings here showed there was a noticeable anti-tumoral effect of AgNP in vitro, AgNP-killed tumor cells failed to induce a protective immune response in vivo. Thus, the data suggest AgNP are most likely able to induce non-immunogenic tumor cell death. Under-standing the mechanisms underlying cell death caused by AgNP is essential to better understand potential further medical applications of AgNP, especially in the context of cancer therapies.
Author contributions
Conceptualization, M.R.G.G., P.B.; methodology, N.C., L.A.M.P., E.J.C., D.G., A.R., L.F.A.R., O.T.B.; formal analysis, M.R.G.G., P.B.; investigation, P.B., M.R.G.G.; resources, M.R.G.G., P.B., N.B., A.P.; writing-original draft preparation, M.R.G.G., P.B.; writing-review and editing, N.B., D.G., A.A.D.J.H.; supervision, P.B.; project administration, M.R.G.G, P.B.; funding acquisition, M.R.G.G, P.B., N.B. All authors have read and agreed to the published version of the manuscript.
Acknowledgements
The authors wish to thank Celia Gomar and Joan Russo for their excellent technical assistance. D. Garibo acknowledges ‘Investigadoras e investigadores por México’ CONACyT program (Project #1073).
Disclosure statement
No potential conflict of interest was reported by the author(s).
Additional information
Funding
References
- Ahmed A, Tait S. 2020. Targeting immunogenic cell death in cancer. Mol Oncol. 14(12):2994–3006.
- Asharani P, Hande P, Valiyaveettil S. 2009. Anti-proliferative activity of silver nanoparticles. BMC Cell Biol. 10:65.
- Bao J, Jiang Z, Ding W, Cao Y, Yang L, Liu J. 2022. Silver nanoparticles induce mitochondria-dependent apoptosis and late non-canonical autophagy in HT-29 colon cancer cells. Nanotech Rev. 11(1):1911–1926.
- Burdușel A-C, Gherasim O, Grumezescu AM, Mogoantă L, Ficai A, Andronescu E. 2018. Biomedical applications of silver nanoparticles: An up-to-date overview. Nanomaterials. 20188(9):681.
- Casares N, Pequignot MO, Tesniere A, Ghiringhelli F, Roux S, Chaput N, Schmitt E, Hamai A, Hervas-Stubbs S, Obeid M, et al. 2005. Caspase-dependent immunogenicity of doxorubicin-induced tumor cell death. J Exp Med. 202(12):1691–1701.
- Chen D, Mellman I. 2013. Oncology meets immunology: The cancer-immunity cycle. Immunity. 39(1):1–10.
- Fucikova J, Spisek R, Kroemer G, Galluzzi L. 2021. Calreticulin and cancer. Cell Res. 31(1):5–16.
- Gopisetty MK, Kovacs D, Igaz N, Ronavari A, Belteky P, Razga Z, Venglovecz V, Csoboz B, Boros IM, Konya Z, et al. 2019. Endoplasmic reticulum stress: Major player in size-dependent inhibition of P-glycoprotein by silver nanoparticles in multidrug-resistant breast cancer cells. J Nanobiotech. 17:9.
- Hamidi H, Lilja J, Ivaska J. 2017. Using xCELLigence RTCA instrument to measure cell adhesion. Bio Protoc. 2017(7):24.
- Han J, Gurunathan S, Jeong J, Choi Y, Kwon D, Park J, Kim J. 2014. Oxidative stress mediated cytotoxicity of biologically synthesized silver nanoparticles in human lung epithelial adenocarcinoma cell line. Nanoscale Res Lett. 9(1):459.
- Holmila R, Vance S, King S, Tsang A, Singh R, Furdui C. 2019. Silver nanoparticles induce mitochondrial protein oxidation in lung cells impacting cell cycle and proliferation. Antioxidants. 8(11):552. 2019
- Huo L, Chen R, Zhao L, Shi X, Bai R, Long D, Chen F, Zhao Y, Chang Y, Chen C. 2015. Silver nanoparticles activate endoplasmic reticulum stress signaling pathway in cell and mouse models: The role in toxicity evaluation. Biomaterials. 61:307–315.
- Kovács D, Igaz N, Gopisetty M, Kiricsi M. 2022. Cancer therapy by silver nanoparticles: Fiction or reality? IJMS. 23(2):839.
- Li J, Chang X, Shang M, Niu S, Zhang W, Zhang B, Huang W, Wu T, Zhang T, Tang M, et al. 2021. Mitophagy-lysosomal pathway is involved in silver nanoparticle-induced apoptosis in A549 cells. Ecotoxicol Environ Saf. 208:111463.
- Li J, Zhang B, Chang X, Gan J, Li W, Niu S, Kong L, Wu T, Zhang T, Tang M, et al. 2020. Silver nanoparticles modulate mitochondrial dynamics and biogenesis in HepG2 cells. Environ Pollut. 256:113430.
- Liu J, Liu Z, Pang Y, Zhou H. 2022. The interaction between nanoparticles and immune system: Application in the treatment of inflammatory diseases. J Nanobiotech. 20:127.
- Liu Y, Zheng C, Huang Y, He M, Xu W, Li B. 2021. Molecular mechanisms of chemo- and radiotherapy resistance and the potential implications for cancer treatment. MedComm. 2(3):315–340.
- Mao B, Tsai J, Chen C, Yan S, Wang Y. 2016. Mechanisms of silver nanoparticle-induced toxicity and important role of autophagy. Nanotoxicology. 10(8):1021–1040.
- Naganthran A, Verasoundarapandian G, Khalid F, Masarudin M, Zulkharnain A, Nawawi N, Karim M, Che Abdullah C, Ahmad S. 2022. Synthesis, characterization and biomedical application of silver nanoparticles. Materials. 15(2):427. 2022
- Pitt J, Kroemer G, Zitvogel L. 2017. Immunogenic and non-immunogenic cell death in the tumor microenvironment. Adv Exp Med Biol. 1036:65–79.
- Raza M, Kanwal Z, Rauf A, Sabri A, Riaz S, Naseem S. 2016. Size- and shape-dependent anti-bacterial studies of silver nanoparticles synthesized by wet chemical routes. Nanomaterials. 6(4):74.
- Schneider C, Rasband W, Eliceiri K. 2012. NIH Image to ImageJ: 25 years of image analysis. Nat Methods. 9(7):671–675.
- Sun Y, Feng X, Wan C, Lovell J, Jin H, Ding J. 2021. Role of nanoparticle-mediated immunogenic cell death in cancer immunotherapy. Asian J Pharm Sci. 16(2):129–132.
- Swanner J, Fahrenholtz C, Tenvooren I, Bernish B, Sears J, Hooker A, Furdui C, Alli E, Li W, Donati G, et al. 2019. Silver nanoparticles selectively treat triple-negative breast cancer cells without affecting non-malignant breast epithelial cells in vitro and in vivo. FASEB Bioadv. 1(10):639–660.
- Yoon J, Park K, Hwang D, Rhee K. 2017. Importance of eIF2α phosphorylation as a protective mechanism against heat stress in mouse male germ cells. Mol Reprod Dev. 84(3):265–274.
- Zhang X, Shen W, Gurunathan S. 2016. Silver nanoparticle-mediated cellular responses in various cell lines: An in vitro model. Intl J Mol Sci. 2016(17):10.
- Zhou J, Wang G, Chen Y, Wang H, Hua Y, Cai Z. 2019. Immunogenic cell death in cancer therapy: Present and emerging inducers. J Cell Mol Med. 23(8):4854–4865.
- Zhu M, Yang M, Zhang J, Yin Y, Fan X, Zhang Y, Qin S, Zhang H, Yu F. 2021. Immunogenic cell death induction by ionizing radiation. Front Immunol. 12:705361.