
Abstract
Cytotoxic T-lymphocytes (CTL) are a subset of T-cells that play a critical role in protecting against intracellular infections and cancer, and have the ability to identify and kill infected or transformed cells expressing non-self peptides associated with major histocompatibility (MHC) Class I molecules. Conversely, aberrant CTL activity can contribute to immune-related pathology under conditions of overwhelming infection or autoimmunity. Disease-modifying therapeutics can have unintended effects on CTL, and a growing number of therapeutics are intended to either suppress or enhance CTL or their functions. The susceptibility of CTL to unintended effects from common therapeutic modalities underscores the need for a better understanding of the impact that such therapies have on CTL function and the associated safety implications. While there are reliable ways of quantifying CTL, notably via flow cytometric analysis of specific CTL markers, it has been a greater challenge to implement fit-for-purpose methods measuring CTL function in the context of safety studies of therapeutics. This review focuses on methods for measuring CTL responses in the context of drug safety and pharmacology testing, with the goals of informing the reader about current approaches, evaluating their pros and cons, and providing perspectives on the utility of these approaches for safety evaluation.
Introduction
Cytotoxic T-lymphocytes (CTL), rightfully named due to their function of killing cells that are deemed a threat to the organism, are a critical component of the adaptive immune system. Cytotoxic T-lymphocytes most often express the glycoprotein receptor CD8 and recognize peptides derived from intracellular proteins/processed antigens that are presented by antigen-presenting cells (APC) in conjunction with the major histocompatibility complex (MHC) Class I molecule (Zhang and Bevan Citation2011). Upon recognition of the peptide-MHC complex presented by an APC, a CTL will differentiate and acquire cytolytic potential. Upon subsequent exposures to the antigen, the mature, antigen-specific CTL will kill cells expressing this antigen, hereby referred to as target cells.
The ‘non-self’ antigen targeted by the CTL is usually derived from intracellular viral or bacterial infection, or from proteins altered during tumor formation. The cytolytic capability of mature CTL is initiated by recognition of the specific antigen, followed by formation of an immunological synapse between the CTL and target cell (Raskov et al. Citation2021; Cassioli and Baldari Citation2022). Once a productive synapse is formed, the subsequent release of cytolytic granules, comprised of perforins and granzymes, mediates target cell cytolysis. In addition to its main cytolytic function, CTL also propagate immune responses by releasing cytokines that stimulate other immune cells (Andersen et al. Citation2006).
A significant proportion of drugs targeting CTL function are biologics, and as such the ICH S6 guidance applies to the design of an applicable non-clinical safety strategy for their development. (ICH Citation2005). The non-clinical assessment of the impact of xenobiotics on the immune system is based on a variety of complementary endpoints including standard toxicology study endpoints as well as additional parameters such as peripheral blood immunophenotyping and functional assays interrogating discrete arms and functions of the immune system. Among those immune parameters, CTL activity is recognized as both informing the risk of increased sensitivity to viral infection and risk of decreased resistance to tumors (ICH Citation2005; Lebrec et al. Citation2016; ICH S8). If both rodent and non-rodent species are pharmacologically-relevant, then toxicity studies should be conducted in both. However, some molecules, notably biologics, are frequently only pharmacologically active in non-human primates (NHP). In addition, many reagents for CTL-related immune parameters are available and/or well characterized for NHP but not for other species. While the principles can be applied to other nonclinical species, the methods described are largely focused on NHP because CTL evaluation is most often done for immunomodulators, the majority of which are biologics that only cross-react with NHP. For these reasons, it is common to conduct toxicology studies for these therapeutics only in NHP.
The objective of this review is to provide an overview of the various methods for assessment of CTL function in NHP in the context of non-clinical safety assessment of immune-modulating therapeutic agents. This review first outlines different readouts of CTL activity that involve measuring the effect of CTL on target cells. Next, endpoints characteristic of CTL activity (CTL surface marker phenotypic changes, intracellular phenotypic changes, cytokine secretion) are described in detail. Finally, models that have been used to measure CTL activity are further outlined, including various artificial and pathophysiological stimuli available to trigger a CTL response in vitro, in vivo, and ex vivo.
Readouts to characterize CTL function
There are several endpoints that can be used to assess CTL function, which can be further dichotomized between evaluating the status of target cells, such as quantifying the number of cells that die in the presence of CTL, or and measuring CTL-specific characteristics, such as their activation status. The examples below illustrate how CTL function can be assessed by various readouts leveraging either colorimetry/fluorescence, flow cytometry, or ELISpot methodologies.
CTL-mediated target cell cytotoxicity
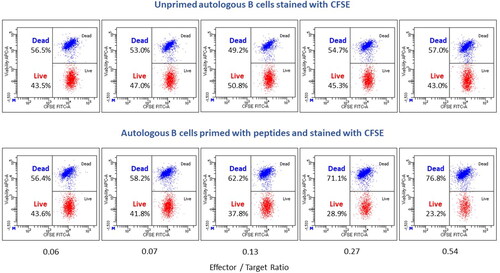
Historically, a chromium release assay has been used to monitor the level of target cell killing by CTL (Brunner et al. Citation1968). In brief, antigen-expressing target cells labeled with radio-labeled chromium (51Cr) are co-cultured with effector cells (e.g. purified T-cells or peripheral blood mononuclear cells [PBMC]) in vitro for a set period of time at various ratios of effector cell to target cell. The effector cells consist of mature CTL that have been previously exposed to the specific antigen. Target cells typically are cancer cell lines or virally-infected cells. The bioactivity of the CTL is then monitored by detecting the radioactive release of 51Cr from the lysed target cells. Over time, the chromium release assay has been replaced by other methods to reduce use of radioactive materials and increase the throughput of the assays. Modern methods include labeling target cells with chromogenic or fluorescent dyes and measuring cytotoxicity via colorimetric or fluorescence changes in supernatants following CTL and target cell incubation using a spectrometer or fluorimeter. If flow cytometry is used, target killing can be measured by identification of labeled target cells with a unique fluorescing dye, such as carboxyfluorescein succinimidyl ester (CFSE) dye followed by analysis of membrane integrity of the target cells using a viability stain to assess the proportion of live cells to dead cells ().
Figure 1. Representative dot plots of a CTL cytotoxicity assay. Autologous B-cells were isolated from naïve NHP using CD20 microbeads and stored in liquid N2. NHP were immunized with modified adenoviruses encoding simian immunodeficiency virus (SIV) antigens (Gag, Pol and Nef). B-Cells were then thawed and conditioned with IFN-γ. Half of the B-cells were pulsed with Nef RM9 peptide and stained with CFSE, while the other half were left un-pulsed and stained with CFSE (target cells). In parallel, CD8+ T-cells (effector cells) were freshly isolated from immunized NHP. Target (T) cells and effector (E) cells were then mixed at different E:T cell ratios, with equal numbers of pulsed and un-pulsed target B-cells. Following incubation, cells were stained with tetramer-Nef-RM9-BV421, anti-CD8-FITC, LIVE/DEAD™ Fixable Far Red Dead Cell Stain Kit and analyzed by flow cytometry. Total autologous target B-cells were gated on CFSE and effector antigen-specific CD8+ T-cells were gated on pMHC tetramer-Nef-RM9/CD8 double-positive cells. Efficiency of the cytotoxicity of CD8 T-cells was based on the percentage of live versus dead B-cells.simian immunodeficiency virus
CTL phenotypic changes: Cell surface markers
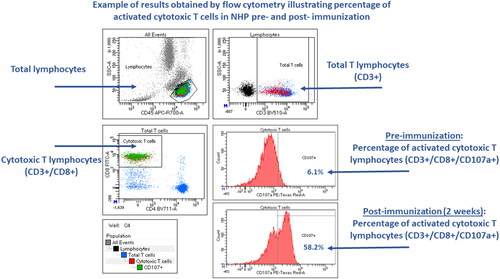
Flow cytometry has proven to be a robust technology to interrogate immune cell identity and function (O'Hara et al. Citation2011; van der Strate et al. Citation2017). After CTL are activated by a target cell expressing the correct peptide-MHC complex, the CTL-mediated killing of target cells occurs via granule-dependent and independent pathways (Trapani and Smyth Citation2002). Thus, activation of CTL can be measured via a cell degranulation assay (Betts et al. Citation2003). Degranulation can be determined by the translocation of lysosomal-associated membrane protein 1 [LAMP-1, also known as CD107a], from the lysosomal membrane to the surface of CTL () as well as by release of perforin in cell supernatants. There are markers of CTL activation in addition to CD107a translocation, including expression of T-cell activation surface markers (e.g. CD69, CD25, CD278 [Inducible T-cell COStimulator, ICOS], CD134 [OX40]). When selecting the specific activation markers to monitor, the time between stimulation and analysis needs to also be considered, as some markers are induced earlier after the stimulation (e.g. CD69 up-regulation), while others are induced at later timepoints (e.g. CD25 up-regulation).
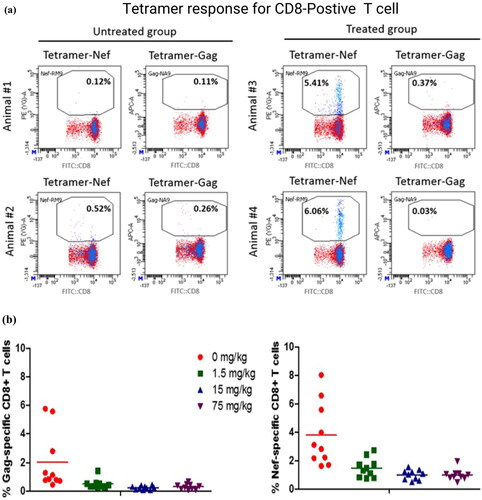
Tetramer technology allows the identification of CTL that respond to a particular antigen. MHC tetramers are composed of four peptide-MHC Class I complexes linked to a fluorescent molecule. A given MHC tetramer binds only CTL that have T-cell receptors (TCR) specific for the particular peptide-MHC complex. Thus, when a particular tetramer is added to a cell population containing T-cells, that bear TCR specific for the tetramer (e.g. PBMC, spleen cells, or lymph node cells), they become fluorescently labeled. Using flow cytometry, it is then possible to determine the proportion of cells in a population that have TCR specific for a particular antigen by counting the number of tetramer positive cells within a cell population, as well as identifying specific cell populations by cell-specific marker antibodies (). This sensitive approach can detect antigen-specific T-cells even when their frequency in the CD8+ population is as low as 0.1% (). Furthermore, one can directly measure the increase in antigen-specific CD8+ T-cells in response to exposure to pathogens such as viruses or cancer-associated antigens. Therefore, the use of tetramer technology facilitates accurate discrimination of rare specific T-cells. A limitation with tetramer analysis is that it is limited to the species in which the peptide antigen sequence and its MHC-I restriction element have been defined. Thus far, availability of tetramers is generally only for rodents, humans, and monkeys.
Figure 2. Representative dot plots displaying the percentage of CD8 T cells expressing CD107a in whole blood of a non-human primate at baseline and 2 weeks following immunization with modified adenoviruses encoding SIV Gag, Pol and Nef. CD107a was expressed at low levels in the naïve animal, whereas its expression increased substantially following immunization, indicating an activation of CD8 T cells.

CTL phenotypic changes: intracellular cytokine staining
In addition to monitoring cell surface phenotypic changes characteristic of CTL activity, flow cytometry can be leveraged to monitor intracellular markers associated with CTL activation, including increased levels of intracellular cytokines or proliferation markers. The monitoring of intracellular cytokine levels requires culturing CTL in the presence of a Golgi excretion blocker to ensure sensitive detection of intracellular cytokines. A variety of antibodies are available to study CTL intracellular cytokine expression including interferon (IFN)-γ and tumor necrosis factor (TNF)-α (Horton et al. Citation2004). When combined with surface marker expression in lymphoid cells, these assays become useful for assessing the effects of test articles on defined cell populations and are particularly useful in identifying test-article related changes on small subpopulations of cells.
CTL-mediated cytokine release: ELISpot
ELISpot (enzyme linked immunosorbent spot) assays measure the frequency of antigen specific T-cells at a single cell level via visualization of secreted proteins produced by individual cells. There are multiple benefits of this assay, including the ability to detect low-frequency antigen-specific T-cells, ability to measure one or more T-cell derived cytokines, scalability and reproducibility.
ELISpot assays in preclinical studies may be used to determine how the frequency of antigen-specific T-cells have changed in response to a candidate therapeutic intervention. Changes in the frequency of antigen-specific T-cells can be used as indicators of both immuno-suppression and immunostimulation. ELISpot assays in preclinical settings have been used in cynomolgus monkeys (Mäkitalo et al. Citation2002; Zuber et al. Citation2006; Moldovan et al. Citation2011; Kamperschroer, O'Donnell, et al. Citation2014; Yang et al. Citation2022). Preclinical applications include evaluation of potential adverse effects on CTL-mediated immune responses, as a biomarker of induction of cell-mediated immunity in vaccine trials and for assessment of immunogenicity of adeno-associated virus (AAV) vectors for AAV-delivered gene therapy. Additionally, given the limited availability of mature NHP and the high cost of their use, efforts have been made to optimize the use of ELISpot assays for laboratory animal species other than cynomolgus monkeys (Carvalho et al. Citation2001; Freundt-Revilla et al. Citation2017; Schultheis et al. Citation2019).
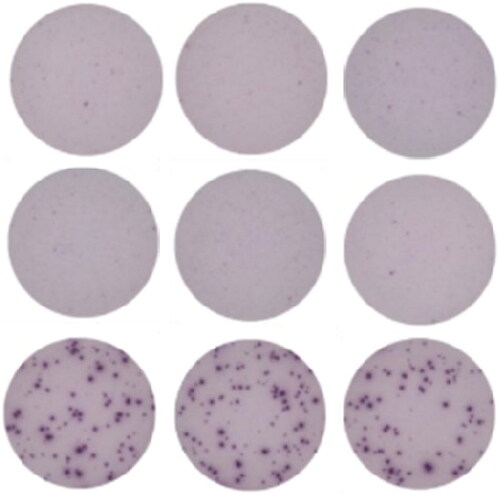
For ELISpot, single cell suspensions of immune cells are collected from animals that were exposed to antigen in vivo and are then subsequently re-stimulated ex vivo. Freshly-prepared or cryopreserved cells may be used. Cells are incubated on a membrane coated with specific anti-cytokine capture antibodies in the presence or absence of antigen specific stimuli. Cytokine production by individual cells is captured and visualized as individual spots for each cell producing the targeted cytokine (). Production of IFN-γ in response to antigen specific stimulation of T-cells is widely considered to be a suitable biomarker of cell-mediated immune responses. Other cytokines can be used and are determined on a case-by-case basis.
Figure 3. Antigen-specific T-cell phenotyping. (a) Data are representative flow cytometric dot-plots displaying the percentages of antigen-specific (Nef+ or Gag+) CD8 T-cells from two monkeys administered antigens (Animal #3 and Animal #4) and two given vehicle (Animal #1 and Animal #2). (b) Data points represent percentages of antigen-specific (Nef+ or Gag+) CD8 T-cells for male and female monkeys 22 days after antigen administration given prior to dose administration of an investigational immunomodulatory agent (0–75 mg/kg). Group means are displayed as horizontal black lines (n = 5/sex/group). (c) Data are representative flow cytometric dot plots displaying the percentages of antigen-specific (Nef+ or Gag+) CD8 T-cells 22 days after antigen administration.
Single or multiple cytokine production by individual cells may be captured and detected using single or multiplex chromogenic (ELISpot) or fluorogenic (Fluorospot) antibody detection techniques (Megyesi et al. Citation2018). Use of fluorescent detection for cytokine production by in vitro stimulated cells enables multiplex assessment of a larger number of cytokines versus chromogenic methods. For the most reproducible results, plates are read using an automated reader with digital image analysis (Janetzki et al. Citation2015). ELISpot data is typically reported as spot-forming units (SFU) or spot-forming cells (SFC) per 1 × 10⁶ cells. Variability in response within replicate wells and among donor animals can be relatively high and must be considered when setting up the assay. Protocols must be qualified, and experiments should be powered adequately to reliably produce statistically significant data (Yang et al. Citation2022). Data generation using known immunosuppressive agents can be used to further demonstrate assay function and performance (Kamperschroer, O'Donnell, et al. Citation2014). Appropriate positive and negative controls should be included to demonstrate viability of cells and ability to respond to stimulation. Phytohemagglutinin (PHA) is commonly used as a nonspecific positive control to stimulate production of IFN-γ. Multiple different reagents, i.e. anti-CD3/CD28 antibodies, phorbol myristate acetate (PMA) and/or ionomycin or Concanavalin A (ConA), are available to stimulate immune cell production of other targeted cytokines. Ex vivo antigen specific stimulation can be accomplished using virus lysates or pools of viral peptides and is described in detail in Kamperschroer, O'Donnell, et al. (Citation2014).
In summary, ELISpot assays are accepted for preclinical assessment of antigen-specific T-cell responses. The assay is based upon the use of ELISA-like methodology and digital image analysis to visualize and quantify the frequency of cytokine producing immune cells in response to ex vivo antigen specific stimulation. ELISpot assays are available to identify multiple cytokines in a variety of species. Standardization of ELISpot assays are required for use in regulatory environments.
Models to monitor CTL activity
In vitro stimulation of CTL by pan-stimulators
Canonical CTL activation requires the TCR binding to a specific peptide/MHC complex. One approach to evaluate the activity of CTL and the potential effect of test articles on such function is to measure CTL function following incubation with non-antigen specific activators (i.e. pan-CTL activators). Such pan-activators can include mitogens, antibody cocktails targeting components of the T-cell receptor complex (anti-CD3 and anti-CD28), superantigens, or CD3 bispecific antibody constructs. CD3 bispecifics, such as Bispecific T-Cell Engager (BiTE®) molecules, are designed to direct T-cells toward target cells that express a defined antigen on their surface. BiTE® molecules create an immunological synapse between CTL and tumor cells and cause tumor antigen-specific T-cell activation. For example, a human EGFR/CD3 BiTE® molecule has been used to develop an in vitro CTL activity assay to characterize the activity and immunotoxic potential of investigational drugs in cynomolgus macaque animal models. CTL from cynomolgus macaque PBMC activated via exposure to EGFR/CD3 BiTE® mediated the lysis of human colon cancer cells expressing EGFR. (Frank et al. Citation2018). This assay succeeds in leveraging multicolor flow cytometry to measure degranulation of CD107a and intracellular cytokine staining. In a recent publication it was demonstrated that this assay was sensitive to a wide range of immunosuppressants directly targeting cell-intrinsic signaling pathways in activated CTL (Frank et al. Citation2021). In contrast, agents executing immunomodulation through inhibition of cytokines/cytokine receptors, co-stimulatory molecules, and cell adhesion and migration pathways did not impair the CTL activity in this short-term in vitro culture. In addition, anti-PD-1/PD-L1 immune checkpoint blockers enhanced CTL activity. Taken together, the results demonstrated that in concordance with their mechanism of action, the in vitro BiTE®-mediated CTL assay was applicable and sensitive to immunomodulatory agents acting via a variety of mechanisms (Frank et al. Citation2021).
Figure 4. Representative images of ELISpot triplicate wells. PBMC from a vaccinated control animal produced IFN-γ in response to ex vivo antigenic stimulation. Top row: negative control, unstimulated cells. Middle row: negative control, nonspecific antigen stimulation. Bottom row: positive control, antigen specific stimulation. Dark spots identify IFN-γ production by individual cells.
Monitoring T-cell responses to endogenous viruses
T-Cell responses against latent herpesviruses can be measured to understand whether pharmaceuticals may affect cell-mediated control of these viruses. In particular, cytomegalovirus (CMV) and Epstein-Barr virus (EBV) are important clinical pathogens in settings of immunosuppression, and EBV is commonly associated with post-transplant lymphoproliferative disease (PTLD) or B-cell lymphomas during immunosuppression of transplant patients. EBV belongs to the lymphocryptovirus (LCV) genus, and homologous LCV exist in most, if not all, primates. The LCV in macaques has been shown to be associated with similar effects (B-cell hyperproliferation and lymphomas) as observed in humans upon immunosuppression (Habis et al. Citation2000; Kutok et al. Citation2004; Rivailler et al. Citation2004; Mühe and Wang Citation2015). Similarly, CMV can also be pathogenic if re-activated in both humans and macaques (Itell et al. Citation2017). Importantly, latent or persistent infections with EBV and CMV are constantly being controlled by virus-specific T-cells. For these reasons, macaques can be used as a model to address questions about the potential for drugs to interfere with T-cell-mediated immunity to EBV and CMV ().
Figure 5. Detection of LCV- and CMV-specific T-cells by ELISpot. (A) IFN-γ ELISpot proce-dure. Diagram shows IFN-γ ELISpot procedure using frozen cynomolgus monkey PBMC and antigen (Ag) preparations from LCV or CMV. (B) Representative data from PBMC isolated from monkeys seropositive (+) or seronegative (-) for CMV and LCV (Kamperschroer Citation2014). (C) Suppression of T-cell responses with known immunosuppressive compounds. Increasing concentrations of either cyclosporine (top panels) or tacrolimus (bottom panels) were added to different wells of ELISpot plates during the culture period of the assay, and then CMV- or LCV-specific T-cells were enumerated by IFN-γ ELISpot and expressed as the number of spot-forming cells (SFC)/106 PBMC.
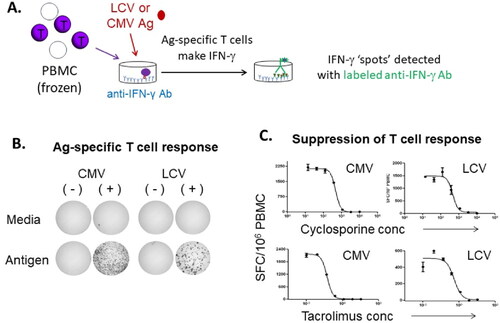
T-Cell responses against EBV and/or CMV might be useful as a general tool for evaluating drug effects on T-cell responses (Kawabata et al. Citation2012); however, more investigation is needed to understand how broadly it may be applied. An advantage to tracking T-cell responses to LCV and CMV in macaques is that the vast majority of animals are latently infected by 2 years-of-age (Carville and Mansfield Citation2008; Yue and Barry Citation2008; Kamperschroer et al. Citation2014), so there is no need for immunization to generate viral-specific T-cells to track, and no need to screen animals prior to studies. Additionally, the T-cells against these viruses are typically present at relatively high frequencies and not difficult to detect by sensitive methods (e.g. ELISpot). Frequently, in primates, PBMC are prepared and stimulated with viral antigen for 48 h in a standard IFN-γ ELISpot format. Resulting spots are counted and reported (after back-ground subtraction) as spot-forming cells per million PBMC. Commonly used immunosuppressive control compounds such as cyclosporine and tacrolimus show clear suppression of the virus-specific cell responses in vitro (Kamperschroer Citation2014).
Whether the assay can detect enhancement due to immunostimulatory agents has not been determined. However, if an agent were to increase the frequency of virus-specific T-cells, the assay should be able to detect the increase. In addition to the ELISpot assay, intracellular cytokine staining and flow cytometry, which has as its advantage the ability to characterize the phenotype of the responding virus-specific T-cells, have been used.
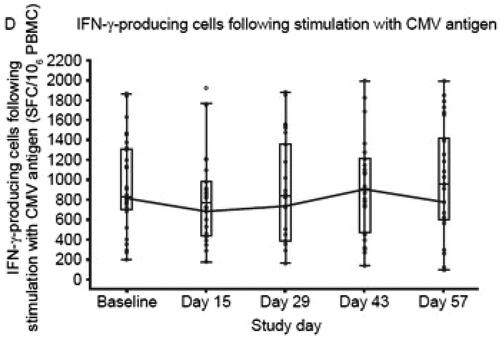
Translational studies have demonstrated that methods similar to those previously described in macaques can also be used in humans to quantify herpesvirus-specific CTL abundance (Cassaniti et al. Citation2019). For example, CMV-specific T-cells have been monitored in healthy volunteers administered tofacitinib. Thawed PBMC from dosed individuals were stimulated with a peptide pool covering an antigenic 65 kDa CMV phosphoprotein (pp65) in an ELISpot assay, and the results indicated a short-term reduction in the number of CMV-reactive T-cells (Weinhold et al. Citation2018) ().
Figure 6. T-Cell function during and following treatment with tofacitinib. Note that box plots provide medians and interquartile ranges, with whiskers to last point within 1.5 × interquartile range; baseline is defined as the average of the three pre-dose measurements; the connecting lines are for geometric means; the dots represent the geometric means; and the circles represent individual values. Study Day 15 was during the 4-week screening period; Study Day 43 is Day 14 post-treatment; Study Day 57 is Day 28 post-treatment. CD: cluster of differentiation; CMV, cytomegalovirus; IFN-γ, interferon-γ; PBMC, peripheral blood mononuclear cells; SFC, spot-forming cells. (Figure from Weinhold et al. Citation2018).
Historically, a major challenge with utilizing LCV or CMV to track effects on T-cell responses in primates has been the availability of antigen for re-stimulation of T-cells. For both viruses, the antigen is in the form of infected cell lysates. Rhesus CMV-infected cell lysates can be used to stimulate cynomolgus T-cells, as rhesus macaque CMV induces sufficient cross-reactivity. For LCV, lymphoblastic cell lines (LCL) can be generated by treating long term cultures of PBMC with immunosuppressive drugs (e.g., cyclosporine), and then lysates can be prepared from the LCL. The lysates have the limitation that each batch needs to be titrated for reactivity and specificity. Also, the CMV cell lysate almost exclusively drives a CD4 T-cell response rather than a CD8 T-cell response, so the majority of the cells with CTL function may not be detected. LCV, on the other hand, drives a mixed response of both CD4 T-cells and CD8 T-cells (Kamperschroer Citation2014). A more consistent source of antigen for re-stimulation would be antigenic peptide pools, as these would be expected to drive both CD4 and CD8 T-cell responses to CMV. The sequences of the cynomolgus macaque CMV and LCV genomes are readily available, with the LCV genome being the most recently sequenced of the two (Kamperschroer et al. Citation2016). Using this viral sequence information, peptide pools spanning proteins expected to be immunogenic based on input from human viruses can be generated and used as antigens for re-stimulation.
An important point to stress is that in any assay using PBMC samples, the exposure of T-cells to the drug under investigation in a dosed animal or human will not be retained when PBMC are prepared, because it will be washed away during sample processing. As an example, when PBMC from monkeys dosed with the immunosuppressive molecule tacrolimus were isolated and used in an ELISpot assay, the effect on the frequency of memory T-cells responding to CMV or LCV was negligible. However, preliminary data suggests that when the in vivo exposure to tacrolimus was partially maintained in diluted whole blood, the T-cells could not respond. These discordant results can only be explained by the loss of tacrolimus from the ex vivo PBMC. This underscores the importance of carefully interpreting assays with washed cells, particularly if drug effects quickly wane if drug is removed.
A final consideration is that CMV- or LCV-specific T-cells have a memory T-cell phenotype. Other methods may be better suited to address questions specific to a primary T-cell response, such as those involving antigen presenting cell function, primary T-cell expansion, or T-cell differentiation. As with most immunotoxicology, the choice of method will depend on what is most appropriate to address the specific questions being asked.
In vivo CTL activation models
Two viral stimulants have been considered for in vivo stimulation of CTL function in non-human primates: Modified Vaccinia virus Ankara (MVA) and Adenovirus serotype 5 (Ad5) encoding Simian Immunodeficiency Virus (SIV) antigens. It should be noted that robustness of the endpoints is dependent on proper model development including but not limited to the selected viral stimulant and ex vivo stimulation conditions.
MVA cynomolgus monkey model
An internal study was conducted to develop a monkey vaccine model for evaluation of effects on cytolytic CD8 T-cell activation. In this study, cynomolgus monkeys were immunized intramuscularly (Day 1) and boosted (Day 51) with MVA, a severely attenuated (non-replicating in human and most mammalian cells) live vaccine carrying a proprietary payload (GlaxoSmithKline Biologicals). The PBMC isolated from blood collected on multiple occasions after each immunization were used to evaluate T-cell activation status using flow cytometry. The study was conducted in accordance with the GSK Policy on the Care, Welfare and Treatment of Laboratory Animals and was reviewed by the Institutional Animal Care and Use Committee at GSK and by the ethical review process at the institution where the work was performed.
MVA-specific activation and functional capacity of CD8 T-cells from MVA-vaccinated monkeys was evaluated by measuring intracellular IFN-γ and surface expression of CD107a and CD69 on isolated PBMC following ex vivo re-stimulation with MVA. The PBMC collected on various days through Day 72 from animals given MVA were cultured with and without MVA vaccine overnight. Functional capacity of CD8+ T-cells was observed as measured by MVA-specific intracellular IFN-γ and surface CD107a (: data not shown for CD107a) expression after ex vivo re-stimulation with MVA in vaccinated animals. MVA-inducible IFN-γ levels in the CD8 T-cells remained elevated throughout the initial phase (with the peak response observed on Day 8, the first timepoint measured) and then again after the boost starting on Day 58. The PBMC from vaccinated animals that were re-stimulated ex vivo with MVA also showed an increase in CD69 expression (activation marker) on CD8 T-cells as early as Day 8 and this increase was maintained throughout the course of the study (data not shown).
Figure 7. T cell activation status was measured in PBMC collected and isolated on Days -1, 8, 15, 22, 49, 58, 65 and 72. After ex vivo re-stimulation of the PBMC with the vaccine (with [filled] and without [empty] 0.3 × 10⁶ pfu MVA vaccine overnight), CD8 T-cells had increased expression levels of IFN-γ at all timepoints analyzed after the first vaccination when compared to their respective mean baseline levels and vehicle control changes. Circles are control treated and triangles are MVA vaccine treated.
![Figure 7. T cell activation status was measured in PBMC collected and isolated on Days -1, 8, 15, 22, 49, 58, 65 and 72. After ex vivo re-stimulation of the PBMC with the vaccine (with [filled] and without [empty] 0.3 × 10⁶ pfu MVA vaccine overnight), CD8 T-cells had increased expression levels of IFN-γ at all timepoints analyzed after the first vaccination when compared to their respective mean baseline levels and vehicle control changes. Circles are control treated and triangles are MVA vaccine treated.](/cms/asset/0b102418-fe18-4e5f-8d4e-a68f6a47e290/iimt_a_2176952_f0007_b.jpg)
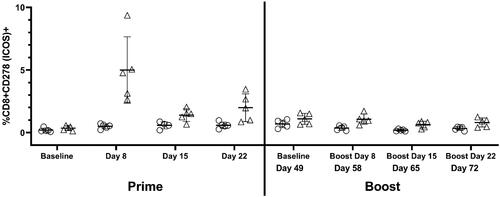
The in vivo activation status of CD8 T-cells from MVA vaccinated monkeys was also evaluated by measuring ICOS (CD278) and OX40 (CD134). Activation measured by an increase in surface expression of ICOS on CD8 T-cells was apparent at Day 8 and remained slightly elevated throughout the study (). Activation measured by OX40 expression on CD8 T cells was also observed but to a lesser extent than that of ICOS (OX40 data not shown).
Figure 8. T cell activation status was measured in PBMC collected and isolated on Days -1, 8, 15, 22, 49, 58, 65 and 72. Starting on Day 8, CD8 T-cells from isolated PBMC (no restimulation) demonstrated increases in the percentage of ICOS (CD278) expression as compared to their respective mean baseline levels and to vehicle control changes. Circles are control treated and triangles are vaccine treated.
An additional benefit of the MVA vaccine is its applicability to multiple model organisms. Several studies document the effective use of MVA vaccine for studying immune cell responses in vivo in most preclinical species, including mice (Ramírez et al. Citation2000), rats (Weidinger et al. Citation2001), guinea pigs (Domi et al. Citation2018), dogs (Carson et al. Citation2009), and swine (Lopera-Madrid et al. Citation2017).
Adenovirus vaccination model of NHP
This model relies on the use of an adenovirus vaccine to evaluate antigen-specific T-cell responses. Animals are immunized with antigen and whole blood is collected at least 3 weeks later, a timepoint that was selected based on preclinical studies detailing this as the optimal time period to mount a robust response to antigen vaccination. Here, PBMC are isolated from whole blood using density gradient centrifugation. The cells are then incubated overnight with mitogens and/or antigen. T-Cell activation is then generally measured by flow cytometry. Isolation of PBMC may pose logistical issues on larger monkey animal studies, given the time and technical expertise involved in this isolation. However, method development comparisons of whole blood, lysed whole blood, and isolated PBMC showed that sensitivity and dynamic range (resolution) of the measurements were greatly reduced in whole blood and lysed whole blood preparations, compared to PBMC isolates. Given the inherent variability of memory responses and the reduction in sensitivity and resolution, isolated PBMC are recommended to interpret test article effects (either suppression or enhancement of activation) using these methods on memory T-cell responses.
This vaccination model of NHP has been utilized in Mauritian cynomolgus macaques. Mauritian cynomolgus macaques are a genetically unique sub-species of cynomolgus macaques compared to those from other geographic regions or to other NHP toxicology species such as rhesus macaque. For comparison, there are fewer than 30 MHC Class I alleles across seven haplotypes relative to the over 400 found in rhesus macaque. This low amount of genetic diversity is due to the geographic isolation of this sub-species, whereas the other macaques found throughout Asia constitute a larger gene pool. In addition to this limited diversity of MHC alleles, there is one allele, Mafa-A1*063, that is expressed across three of the most common MHC haplotypes (M1, M2, M3). In an assessment of breeding colonies at Charles River, it was found that 80% of the Mauritian cynomolgus macaques on hand expressed this allele. This genetic uniqueness requires that NHPs with the MHC haplotypes M1 and/or M3 be used on studies on which this vaccination model will be utilized, as these monkeys express the Mafa-A1*063 allele required for restriction of immunodominant antigenic epitopes (Budde et al. Citation2011, Citation2012).
One approach that has been used by some laboratories in order to investigate the CD8 T-cell response is to challenge animals with adenoviruses containing SIV peptides and then measure peptide specific cells using tetramer technology (). The effect of biotherapeutics specifically affecting the CD8 T-cells (either by suppressing or enhancing their response) can then be monitored. A potential limitation of tetramer analysis is the animal-to-animal variability in the response to SIV Ad5 vaccination, resulting in variability in the percentages of tetramer positive CD8 cells.
The adenovirus vaccine model also allows for the use of ELISpot to interrogate T-cell mediated responses directed to the vaccine encoded antigens. In this study Mauritian cynomolgus macaques received three replication incompetent recombinant adenovirus serotype 5 (Ad5) vectors, each containing the coding sequence for Gag, Nef or Pol SIV proteins. A dose of 6.75 × 10¹¹ viral particles were administered intramuscularly (IM) at two separate timepoints − 4 weeks apart (Group 2) or 8 weeks apart (Group 3). Control animals (Group 1) received saline as control on each immunization day. Following the second immunization only Group 3 animals had strong responses to all Nef peptide conditions (), with the highest response at Week 11 (3 weeks post-boost) (Graveline et al. Citation2022).
Conclusions
Evaluation of the intended and unintended effects of xenobiotics on cell-mediated immunity is an important component of preclinical safety assessment and drug development. Regulatory guidance is provided in ICH Harmonized Tripartite Guideline Immunotoxicity Studies for Human Pharmaceuticals S8 and other sources (ICH Citation2005; Lebrec et al. Citation2016; U.S. Department of Health and Human Services, Food and Drug Administration, Center for Drug Evaluation and Research, & Center for Biologics Evaluation and Research 2006). Data from standard toxicity studies including hematologic changes, alterations in immune system organ weight or histology, changes in serum globulins, or increased incidence of infections or tumors are used as a first step to assess immune function. Additional immunotoxicity studies are often warranted to determine the cell type affected, reversibility and the mechanism of action. The assays described in this publication are directed to assessment of CTL. Circulating CTL in blood or PBMC are most often assessed because of sample accessibility. Assays based on the assessment of single cell suspensions from lymphoid organs are used infrequently, as it is usually only available at necropsy. CTL can be characterized by flow cytometry for expression of surface antigens or intracellular production of cytokines using a variety of reagents that sort the CTL into specific subsets based on immunophenotype. In this way, changes in CTL populations over time in response to treatment can be assessed. CTL function may also be evaluated via ex vivo cytotoxicity assays or by response to ex vivo antigen stimulation. CTL response to ex vivo antigen-specific stimulation requires previous exposure (e.g., via immunization or naturally occurring viral infections). Choice and application of specific assays are best determined on a case-by-case basis. Detailed knowledge of the methodology and recognition of the focus and limitations of the respective assays is imperative for study design and generation of appropriate data. From in vitro and ex vivo assessments to more recent in vivo models, there have been several advances in the monitoring of CTL activation and function, which allows more effective and accurate non-clinical determination of the safety profile of novel immune-modulating therapeutics.
Acknowledgements
The authors would like to thank Members of the Health and Environmental Sciences Institute (HESI) Immuno-Safety Technical Committee and members of the Methods Development Working group. The authors would also like to extend a word of thanks to former project manager Dr. Stan Parish
Disclosure statement
No potential conflict of interest was reported by the author(s).
Additional information
Funding
References
- Andersen M, Schrama D, Thor Straten P, Becker J. 2006. Cytotoxic T-cells. J Invest Dermatol. 126(1):32–41.
- Betts M, Brenchley J, Price D, De Rosa S, Douek D, Roederer M, Koup R. 2003. Sensitive and viable identification of antigen-specific CD8+ T-cells by a flow cytometric assay for degranu-lation. J Immunol Meth. 281:65–78.
- Brunner K, Mauel J, Cerottini J, Chapuis B. 1968. Quantitative assay of the lytic action of immune lymphoid cells on 51Cr-labeled allogeneic target cells in vitro: Inhibition by isoantibody and by drugs. Immunology. 14:181–196.
- Budde M, Greene J, Chin E, Ericsen A, Scarlotta M, Cain B, Pham N, Becker E, Harris M, Weinfurter J, et al. 2012. Specific CD8+ T-cell responses correlate with control of simian immunodeficiency virus replication in Mauritian cynomolgus macaques. J Virol. 86(14):7596–7604.
- Budde ML, Lhost JJ, Burwitz BJ, Becker EA, Burns CM, O'Connor SL, Karl JA, Wiseman RW, Bimber BN, Zhang GL, et al. 2011. Transcriptionally-abundant major histocompatibility complex class I alleles are fundamental to non-human primate simian immunodeficiency virus-specific CD8+ T-cell responses. J Virol. 85(7):3250–3261.
- Carson C, Antoniou M, Ruiz-Argüello M, Alcami A, Christodoulou V, Messaritakis I, Blackwell J, Courtenay O. 2009. A prime/boost DNA/Modified vaccinia virus Ankara vaccine expressing recombinant Leishmania DNA encoding TRYP is safe and immunogenic in outbred dogs, the reservoir of zoonotic visceral leishmaniasis. Vaccine. 27(7):1080–1086.
- Carvalho L, Hafalla J, Zavala F. 2001. ELISPOT assay to measure antigen-specific murine CD8+ T-cell responses. J Immunol Meth. 252:207–218.
- Carville A, Mansfield K. 2008. Comparative pathobiology of macaque lymphocryptoviruses. Compar Med. 58:57–67.
- Cassaniti I, Cavagna L, Calarota SA, Adzasehoun KMG, Comolli G, Montecucco C, Baldanti F. 2019. Evaluation of EBV- and HCMV-Specific T cell Responses in Systemic Lupus Erythematosis (SLE) Patients Using a Normalized Enzyme-Linked Immunospot (ELISPOT) Assay. J Immunol Res. 2019:1–12.
- Cassioli C, Baldari C. 2022. The expanding arsenal of cytotoxic T-cells. Front Immunol. 13:883010.
- Domi A, Feldmann F, Basu R, McCurley N, Shifflett K, Emanuel J, Hellerstein M, Guirakhoo F, Orlandi C, Flinko R, et al. 2018. a single dose of modified vaccinia Ankara expressing Ebola virus-like particles protects non-human primates from lethal Ebola virus challenge. Sci Rep. 8(1):864.
- Frank B, Guo H, Lebrec H, Wang X. 2021. Application of a newly-developed cynomolgus macaque BiTE-mediated cytotoxic T-lymphocyte activity assay to various immunomodula-tory agents in vitro. J Immunotoxicol. 18:154–162.
- Frank B, Wei Y, Kim K, Guerrero A, Lebrec H, Balazs M, Wang X. 2018. Development of a BiTE®-mediated CD8+ cytotoxic T-lymphocyte activity assay to assess immunomodulatory potential of drug candidates in cynomolgus macaque. J Immunotoxicol. 15(1):119–125.
- Freundt-Revilla J, Maiolini A, Carlson R, Beyerbach M, Rentmeister K, Flegel T, Fischer A, Tipold A. 2017. TH17-skewed immune response and cluster of differentiation 40 ligand expression in canine steroid-responsive meningitis-arteritis, a large animal model for neutrophilic meningitis. J Neuroinflamm. 14(20):13p. DOI 10.1186/s12974-016-0784-3
- Graveline R, Haida M, Dumont C, Poulin D, Poitout-Belissent F, Samadfam R, Kronenberg S, Regenass-Lechner F, Prell R, Piche M. 2022. Development of a non-human primate challenge model to evaluate CD8+ T-cell responses to an adenovirus-based vaccine expres-sing SIV proteins upon repeat-dose treatment with checkpoint inhibitors. MAbs. 14(1):1979447.
- Habis A, Baskin G, Simpson L, Fortgang I, Murphey-Corb M, Levy L. 2000. Rhesus Lymphocryptovirus Infection during the progression of SAIDS and SAIDS-associated lymphoma in the rhesus macaque. AIDS Res Hum Retroviruses. 16(2):163–171.
- Horton H, Russell N, Moore E, Frank I, Baydo R, Daughton C, Lee D, Deers M, Hudgens M, Weinhold K, et al. 2004. Correlation between IFNγ secretion and cytotoxicity, in virus-specific memory T-cells. J Infect Dis. 190(9):1692–1696.
- ICH-International Council for Harmonisation of Technical Requirements for Pharmaceuticals for Human Use. 2005. ICH harmonised tripartite guideline – immunotoxicity studies for human pharmaceuticals S8. [Online]. [accessed 2022 Mar 10]. https://database.ich.org/sites/default/files/S8_Guideline_0.pdf.
- Itell H, Kaur A, Deere J, Barry P, Permar S. 2017. Rhesus monkeys for a non-human primate model of cytomegalovirus infections. Curr Opin Virol. 25:126–133.
- Janetzki S, Price L, Schroeder H, Britten C, Welters M, Hoos A. 2015. Guidelines for the automated evaluation of ELISPOT assays. Nat Protoc. 10(7):1098–1115.
- Kamperschroer C, Gosink MM, Kumpf SW, O'Donnell LM, Tartaro KR. 2016. The genomic sequence of lymphocryptovirus from cynomolgus macaque. Virology. 488:28–36.
- Kamperschroer C, O'Donnell LM, Schneider PA, Li D, Roy M, Coskran TM, Kawabata TT. 2014. Measuring T-cell responses against LCV and CMV in cynomolgus macaques using ELISPOT: Potential application to non-clinical testing of immunomodulatory therapeutics. J Immunotoxicol. 11(1):35–43.
- Kamperschroer C, Tartaro K, Kumpf S. 2014. Quantitative PCR assays reveal high prevalence of lymphocryptovirus as well as lytic phase gene expression in peripheral blood cells of cynomolgus macaques. J Virol Methods. 207:220–225.
- Kawabata T, Weaver J, Thomas D, Rowe M, Wang F, Kamperschroer C, Haggerty H. 2012. Summary of roundtable discussion meeting: Non-human primates to assess risk for EBV-related lymphomas in humans. J Immunotoxicol. 9(1):121–127.
- Kutok J, Klumpp S, Simon M, MacKey J, Nguyen V, Middeldorp J, Aster J, Wang F. 2004. Molecular evidence for rhesus lymphocryptovirus infection of epithelial cells in immunosuppressed rhesus macaques. J Virol. 78(7):3455–3461.
- Lebrec H, Brennan F, Haggerty H, Herzyk D, Kamperschroer C, Maier C, Ponce R, Preston B, Weinstock D, Mellon R. 2016. HESI/FDA workshop on immunomodulators and cancer risk assessment: Building blocks for a weight-of-evidence approach. Regul Toxicol Pharmacol. 75:72–80.
- Lopera-Madrid J, Osorio JE, He Y, Xiang Z, Adams LG, Laughlin RC, Mwangi W, Subramanya S, Neilan J, Brake D, et al. 2017. Safety and immunogenicity of mammalian cell-derived and modified Vaccinia Ankara-vectored African swine fever subunit antigens in swine. Vet Immunol Immunopathol. 185:20–33.
- Mäkitalo B, Andersson M, Areström I, Karlén K, Villinger F, Ansari A, Paulie S, Thorstensson R, Ahlborg N. 2002. ELISpot and ELISA analysis of spontaneous, mitogen-induced, and antigen-specific cytokine production in cynomolgus and rhesus macaques. J Immunol Meth. 270:85–97.
- Megyesi Z, Lehmann P, Karulin A. 2018. Multi-color FLUOROSPOT counting using ImmunoSpot® Fluoro-X™ Suite. Meth Mol Biol. 1808:115–131.
- Moldovan I, Brewoo J, Osorio J, Tary-Lehmann M. 2011. Assessment of T-cell-mediated immunity by ELISPOT in preclinical studies of dengue in cynomolgus macaques (106.6). J Immunology. 186(S1):106.6.
- Mühe J, Wang F. 2015. Non-human primate lymphocryptoviruses: Past, present, and future. Curr Topics Microbiol Immunol. 391:385–405.
- O'Hara D, Xu Y, Liang Z, Reddy M, Wu D, Litwin V. 2011. Recommendations for the validation of flow cytometric testing during drug development: II assays. J Immunol Methods. 363(2):120–134.
- Ramírez J, Gherardi M, Esteban M. 2000. Biology of attenuated modified vaccinia virus Ankara recombinant vector in mice: Virus fate and activation of B- and T-cell immune responses in comparison with the Western reserve strain and advantages as a vaccine. J Virol. 74(2):923–933.
- Raskov H, Orhan A, Christensen J, Gögenur I. 2021. Cytotoxic CD8+ T-cells in cancer and cancer immunotherapy. Br J Cancer. 124(2):359–367.
- Rivailler P, Carville A, Kaur A, Rao P, Quink C, Kutok JL, Westmoreland S, Klumpp S, Simon M, Aster JC, et al. 2004. Experimental rhesus lymphocryptovirus infection in immunosup-pressed macaques: An animal model for Epstein-Barr virus pathogenesis in the immuno-suppressed host. Blood. 104(5):1482–1489.
- Schultheis K, Schaefer H, Pugh H, Yung B, Oh J, Nguyen J, Humeau L, Broderick K, Smith T. 2019. Optimized IFNγ ELISpot assay to measure T-cell responses in the guinea pig model after vaccination. J Visual Exp. 143:e58595.
- Trapani J, Smyth M. 2002. Functional significance of the perforin/granzyme cell death pathway. Nat Rev Immunol. 2(10):735–747.
- U.S. Department of Health and Human Services, Food and Drug Administration, Center for Drug Evaluation and Research, & Center for Biologics Evaluation and Research. 2006. Guidance for industry – S8 immunotoxicity studies for human pharmaceuticals [Online]. [accessed 2022 Mar 10]. https://www.fda.gov/regulatory-information/search-fda-guidance-documents/s8-immunotoxicity-studies-human-pharmaceuticals.
- van der Strate B, Longdin R, Geerlings M, Bachmayer N, Cavallin M, Litwin V, Patel M, Passe-Coutrin W, Schoelch C, Companjen A, et al. 2017. Best practices in performing flow cytometry in a regulated environment: feedback from experience within the European Bioanalysis Forum. Bioanalysis. 9(16):1253–1264.
- Weidinger G, Ohlmann M, Schlereth B, Sutter G, Niewiesk S. 2001. Vaccination with recombinant modified vaccinia virus Ankara protects against measles virus infection in the mouse and cotton rat model. Vaccine. 19:2764–2768.
- Weinhold K, Bukowski J, Brennan T, Noveck R, Staats J, Lin L, Stempora L, Hammond C, Wouters A, Mojcik C, et al. 2018. Reversibility of peripheral blood leukocyte phenotypic and functional changes after exposure to and withdrawal from tofacitinib, a Janus kinase inhibitor, in healthy volunteers. Clin Immunol. 191:10–20.
- Yang F, Patton K, Kasprzyk T, Long B, Gupta S, Zoog S, Tracy K, Vettermann C. 2022. Validation of an IFNγ ELISpot assay to measure cellular immune responses against viral antigens in non-human primates. Gene Therapy. 29:41–24.
- Yue Y, Barry P. 2008. Chapter 5. Rhesus cytomegalovirus: A non-human primate model for the study of human cytomegalovirus. Vol. 72. In: Maramorosch K, Shatkin A, Murphy F, editors. Advances in virus research. New York: Academic Press; p. 207–226.
- Zhang N, Bevan M. 2011. CD8+ T-cells: Foot soldiers of the immune system. Immunity. 35(2):161–168.
- Zuber B, Quigley M, Critchfield J, Shacklett B, Abel K, Miller C, Mörner A, Paulie S, Ahlborg N, Sandberg J. 2006. Detection of macaque perforin expression and release by flow cyto-metry, immunohistochemistry, ELISA, and ELISpot. J Immunol Methods. 312(1–2):45–53.