
Abstract
Per- and polyfluoroalkyl substances (PFAS) are anthropogenic organofluorine compounds that persist indefinitely in the environment and bioaccumulate throughout all trophic levels. Biomonitoring efforts have detected multiple PFAS in the serum of most people. Immune suppression has been among the most consistent effects of exposure to PFAS. PFAS often co-occur as mixtures in the environment, however, few studies have examined immunosuppression of PFAS mixtures or determined whether PFAS exposure affects immune function in the context of infection. In this study, mixtures containing two or four different PFAS and a mouse model of infection with influenza A virus (IAV) were used to assess immunotoxicity of PFAS mixtures. PFAS were administered via the drinking water as either a binary mixture of perfluorooctane sulfonate (PFOS) and perfluorooctanoic acid (PFOA) or quaternary mixture of PFOS, PFOA, perfluorohexane sulfonate (PFHxS), and perfluorononanoic acid (PFNA). The results indicated that the binary mixture affected the T-cell response, while the quaternary mixture affected the B-cell response to infection. These findings indicate that the immunomodulatory effects of PFAS mixtures are not simply additive, and that the sensitivity of immune responses to PFAS varies by cell type and mixture. The study also demonstrates the importance of studying adverse health effects of PFAS mixtures.
Introduction
Per- and polyfluoroalkyl substances (PFAS) are a large class of anthropogenic organo-fluorine compounds that are used in a broad range of industrial and consumer products, including nonstick coatings, cleaning products, waterproof clothing, and food packaging (Glüge et al. Citation2020). Common routes of human exposure to PFAS are through ingestion of contaminated food or water, and PFAS contamination of drinking water is widespread across the United States (Sunderland et al. Citation2019; European Food Safety Authority [EFSA] 2020; De Silva et al. Citation2021). In March 2023, the U.S. Environmental Protection Agency (USEPA) issued a National Primary Drinking Water Regulation of six PFAS (USEPA Citation2023b). Production of four of the EPA-regulated PFAS (perfluorooctane sulfonate (PFOS), perfluorooctanoic acid (PFOA), perfluorohexane sulfonate (PFHxS), and perfluorononanoic acid (PFNA) has been discontinued in the U.S. since the early 2000s. However, because of their persistence in the environment and long in vivo half-lives, they remain among the most commonly detected PFAS in environmental samples and human serum (Kato et al. Citation2011; Calafat et al. Citation2019; Centers for Disease Control [CDC] Citation2019; Li et al. Citation2022; Nilsson et al. Citation2022; Rosato et al. Citation2023; USEPA Citation2023b).
Aggregate data from epidemiological and experimental studies suggests that PFAS exposure has the potential to cause myriad adverse health effects such as cancer, thyroid disease, liver dysfunction, dyslipidemia, and developmental and reproductive toxicity (Sunderland et al. Citation2019; Agency for Toxic Substances and Disease Registry [ATSDR] 2021; Fenton et al. Citation2021; USEPA Citation2023c, Citationd). There is also evidence that exposure to PFAS affects the immune system. In fact, the most sensitive non-cancer effect of exposure to PFOS or PFOA reported to date is reduced antibody responses to childhood vaccination (USEPA Citation2022). Aligning with this, findings from experimental animal models have demonstrated that exposure to PFOS or PFOA suppressed IgM production in sheep red blood cell (SRBC) assays (Dewitt et al. Citation2008, Citation2016; Peden-Adams et al. Citation2008; Taylor et al. Citation2023). Other assessments of the immunotoxicity of PFOS and PFOA, such as immune organ cellularity and measurements of individual immune cell populations have produced null or inconsistent results across studies (Peden-Adams et al. Citation2008; Dong et al. Citation2009; Fair et al. Citation2011; DeWitt et al. Citation2016; Torres et al. Citation2021). While the immuno-toxicity of PFHxS and PFNA has not been as well studied as that of PFOS and PFOA, there is some evidence that they also affect the immune system. Exposure to PFHxS decreased SRBC-specific IgM production, and exposure to PFNA altered immune cell populations in the spleen and thymus (Rockwell et al. Citation2013, Citation2017; Narizzano et al. Citation2023).
PFAS usually co-occur as mixtures in the environment and in drinking water (Guelfo and Adamson Citation2018; USEPA Citation2023b). Yet, much of the current information regarding PFAS immunotoxicity, particularly from experimental animal models, is based on exposure to individual PFAS, with PFOS and PFOA being the most studied to date (DeWitt et al. Citation2019; Ojo et al. Citation2021; Antoniou et al. Citation2022; Ehrlich et al. Citation2023). The effects of exposure to PFAS mixtures are presumed to be dose-additive; however, there are few in vivo studies that have examined the immunotoxicity of PFAS mixtures (USEPA Citation2023a, Citation2023b). Findings from an in vitro study that compared the effects of several different PFAS mixtures on human peripheral blood mono-nuclear cells suggested that the effects of PFAS mixtures vary based on mixture composition and by cell type (Maddalon et al. Citation2023). In addition to the lack of data regarding the immunotoxicity of PFAS mixtures, few animal studies have examined the immunotoxicity of individual PFAS in the context of fighting an infection.
The objective of this study was to compare the effects of exposure to two different PFAS mixtures on the immune response to infection with influenza A virus (IAV) infection. Influenza A virus is a relevant human pathogen with a well-characterized response that is similar in mice and humans. Infection with IAV triggers a series of events that cues the activation, proliferation, and differentiation of both T- and B-lymphocytes. CD8+ T-cells differentiate into cytotoxic T-lymphocytes (CTL) that are the primary cell type responsible for clearance of a primary IAV infection (Kohlmeier and Woodland Citation2009; La Gruta and Turner Citation2014). CD4+ T-cells differen-tiate into functionally-distinct sub-populations, including T-helper-1 (TH1), T-helper-2 (TH2), T-regulatory (Treg), and T-follicular helper (Tfh) cells that support CD8+ T-cells and also the activation and function of B-cells which produce virus-specific antibodies (Strutt et al. Citation2013; Nera et al. Citation2015). Here, mice were exposed to a PFAS mixture then infected with IAV; thereafter, T-cell, B-cell, and IAV-specific antibody levels were measured at the peak of their respective responses.
Materials and methods
Animals and treatments
C57Bl/6 mice (female, 6-wk-old) were purchased from The Jackson Laboratory (Bar Harbor, ME) and housed in microisolator cages in a specific-pathogen free facility at the University of Rochester. Mice were maintained on a 12-hr light/dark cycle, with ambient temperature between 20 and 22°C, and were provided food (LabDiet 5010) and water ad libitum. After acclimatizing for 1 wk after arrival, mice were weighed and randomly distributed into one of three treatment groups (3-5 mice/cage), i.e., control, 2 PFAS, 4 PFAS, or control.
PFAS were administered via the drinking water as either a mixture of PFOS and PFOA (2 PFAS) or PFOS, PFOA, PHXS and PFNA (4 PFAS). Control mice received plain drinking water. The PFAS mixtures were intended to produce serum PFAS ratios in mice similar to that of humans. Among several reports, PFOS and PFOA human serum levels are similar, while concentrations of PFHxS are roughly 5-times lower than PFOS and PFOA, and PFNA levels are about 7-times lower (Pérezz et al. 2013; Calafat et al. Citation2019; CDC 2019). The dose of 1.88 mg PFOA/kg BW/day was chosen as the basis for the mixture because it is the NOAEL of PFOA for suppressed IgM production (Dewitt et al. Citation2008). PFAS concentrations in the dosing solutions were calculated based on mice (with average 20 g body weight) that consume an average of 4 ml H2O/day. The 2 PFAS mixture was comprised of 0.009 mg/ml PFOS (total compound weight) and 0.009 mg/ml PFOA (total compound weight) so as to administer a theoretical daily dose of 1.88 mg PFOS + 1.88 mg PFOA/kg body weight (BW). The 4 PFAS mixture consisted of 0.009 mg/ml PFOS + 0.009 mg/ml PFOA + 0.0018 mg/ml PFHxS (total compound weight) + 0.0013 mg/ml PFNA and administered a theoretical daily dose of 1.88 mg PFOS + 1.88 mg PFOA + 0.376 mg PFHxS + 0.26 mg PFNA/kg BW.
All PFAS were purchased from Sigma-Aldrich (St Louis, MO) and were ≥ 95% pure. PFOS and PFHxS were purchased as potassium salts. PFAS treatment began 21 days prior to infection with IAV and continued throughout infection. Water consumption and body weights of all mice were monitored throughout the exposure period. All animal treatments were conducted with prior approval of the Institutional Animal Care and Use Committee of the University of Rochester. The University has accreditation through the Association for Assessment and Accreditation of Laboratory Animal Care (AAALAC). Animals were treated humanely and with due consideration to alleviation of any distress and discomfort. All guidelines from the U.S. Public Health Service Policy on Human Care and Use of Laboratory Animals were followed in the handling of vertebrate animals.
Influenza A virus infection
Influenza A virus (IAV) strain A/HKx31 (HKx31; H3N2) was propagated and titered as previously described (Warren et al. Citation2000). Virus stocks were grown from a master stock (provided by Dr. Michael Coppola, Argonex, Charlottesville, VA) by inoculating embryonated specific pathogen-free chicken eggs (Charles River, Wilmington, MA) following the methods outlined in Barrett and Inglis (Citation1985). Virus titers were determined by hemagglutination of erythrocytes (Barrett & Inglis, Citation1985). Mice were anesthetized with 0.225-0.250 ml avertin (2% 2,2,2-tribromoethanol; Sigma) given by intraperitoneal (IP) injection. Mice were infected intranasally (in) with 25 µl phosphate-buffered saline (PBS, pH 7.4) containing 120 hemagglutination units (HAU) of HKx31, which is a sublethal inoculum in immunocompetent mice (Warren et al. Citation2000; Boule et al. Citation2014; Winans et al. Citation2015). In all experiments, infection and tissue collection were performed in the morning. All work with infectious agents was conducted with prior approval of the Institutional Biosafety Committee of the University of Rochester, following guidelines of the NIH/CDC.
Tissue collection
Mice were euthanized using a lethal dose of Euthasol (Virbac, Greeley, CO). Blood was collected by cardiac puncture; serum was collected by centrifugation and stored at −80°C. Mediastinal lymph nodes (MLN) were harvested 0, 9, or 14 days after infection, and single cell suspensions prepared as previously described (Post et al. Citation2023). In brief, MLN were pressed between the frosted ends of two microscope slides, and the dissociated cells were then re-suspended in cold Hanks Balanced Salt Solution (HBSS) containing 2.5% fetal bovine serum (HBSS/FBS; Hyclone, Logan, UT). The cell mixtures were then treated with erythrocyte lysis solution (0.15 M NH4CL, 10 mM NaHCO3, 1 mM EDTA) and incubated for 5 min at room temperature. Lysis was then quenched with cold HBSS/FBS. Erythrocyte debris was removed by passing each suspension through a 70-µM filter. The purified cells were then re-suspended in cold HBSS/FBS for enumeration in a TC20 cell counter (BioRad, Hercules, CA), and then immediately stained for flow cytometric analysis.
Analytical flow cytometry
Suspensions of cells from individual animals were used for all analytical flow cytometry. For all samples, nonspecific staining was blocked by incubating cell suspensions with an anti-mouse CD16/32 mAb (clone 93; BD Biosciences, San Jose, CA). Aliquots of 2 x 10⁶ cells/sample were then treated with a previously-determined optimal dilution of a given fluoro-chrome-conjugated antibody against extracellular surface antigens (Table S1), and incubated in the dark at 4 °C for 20 min. Cells were then washed with PBS/1% BSA/0.01% sodium azide solution and then fixed in 2% formaldehyde. All labeling antibodies were purchased from BD Biosciences or Invitrogen (Carlsbad, CA). Fluorescence minus one (FMO) controls were used to determine nonspecific fluorescence and define gating parameters. For analytical flow cytometry, 500,000 events/sample were collected using an LSRII flow cytometer (BD Biosciences, San Jose, CA), and analyzed with Flow Jo v8 (TreeStar, Ashland, OR).
Anti-influenza virus antibody measurement
Relative levels of influenza virus-specific antibodies in serum were measured by enzyme-linked immunosorbent assay (ELISA), as previously described (Boule et al. Citation2018; Houser and Lawrence Citation2022). In brief, flat-bottom 96 well ELISA plates (Greiner Bio-One, Monroe, NC) were coated with purified HKx31 (5 µg/ml; Charles River) at 37 °C overnight. Plates were washed with PBS containing 0.05% Tween-20 in between each step. To reduce nonspecific binding, 100 µl PBS containing 5% BSA was added to all wells, and plates were incubated at 4°C for 2 hr. Serum samples were serially-diluted from 1:100 to 1:819,200 with PBS/5% BSA solution, and 100 µl of each dilution was then added to the plates and incubated overnight at 4°C. Thereafter, biotinylated goat anti-mouse IgM and IgG antibodies (diluted 1:5000 in PBS/5% BSA; Southern Biotechnology, Birmingham, AL) were added to the wells and the plates then incubated at room temperature for a further 45 min. Avidin-peroxidase (1:400 dilution in PBS/5% BSA; Sigma) was added to all wells and the plates then incubated at room temperature for a final 30 min. To induce colorimetric change, 100 µl of 2,2′-azino-bis(3-ethylbenzthiazo-line-6-sulfonic acid) with 0.03% H2O2 was added to each well. Absorbance values were then read at 405 nm in a SpectraMax Plate reader (Molecular Devices, San Jose, CA).
Serum PFAS concentrations
Serum samples were prepared for PFAS analysis using Agilent Enhanced Matrix Removal (EMR) - Lipid cartridges (Agilent Technologies, Santa Clara, CA). EMR cartridges were pre-cleaned by elution with 80:20 acetonitrile and Optima LC-MS grade water. Serum samples were mixed by gentle vortexing before 50 µl of each sample was transferred to an EMR cartridge containing 150 µl of 1% (v/v) formic acid in cold (−20°C) acetonitrile along with 10 µl of 60 ng/ml mass-labeled PFAS standard[s] (MPFAC-24ES, Wellington Laboratories, Guelph, Ontario, Canada). After stirring with a Pasteur pipette, contents of each cartridge were eluted on a positive pressure manifold (under ultra-high purity N2 at 3-5 drops/min) into 2-ml polypropylene autosampler vials.
Background interferences were monitored by analyzing solvent blanks (serum sample replaced with 50 µl Optima water, N = 4) and serum blanks (serum sample replaced with 50 µl of bovine calf serum, N = 2) that were prepared alongside the serum samples. To monitor quantitation accuracy, fortified samples (bovine calf serum with native analytes added) were prepared alongside the samples via the same preparation method. Analytes were added to blank serum using a mixture in methanol purchased from Wellington Laboratories (PFAC-30PAR) to achieve final concentrations of 15 ng/ml (N = 2) and 3 ng/ml (N = 2).
Extracts were injected onto an 1290 Infinity LC equipped with an Poroshell 120 EC-C18 analytical column (3 × 100 mm × 4 µm) that was coupled to a 6545 QTOF-MS system (all Agilent Technologies) to measure PFAS concentrations. The analytical method used was adapted from McDonough et al. (Citation2020). In brief, 20 mM ammonium acetate and acetonitrile were used as the aqueous and organic mobile phases, respectively. Samples were separated on a gradient starting at 95% aqueous:5% organic and reached 0% aqueous:100% organic by 13.5 min with flow rate 0.4 ml/min. The binary pump was equipped with a delay column after the solvent mixer to separate out any analytical interferences in the mobile phase. The QTOF was operated in negative electrospray ionization (ESI-) mode. Acquisition was completed in All Ions Mode (data independent acquisition) at three collision energies (0, 10, 35 eV).
Matrix-matched calibration curves were prepared in bovine serum for the target analytes over a concentration range of 0.01 - 50 ng/ml serum. Within this range, all calibration curves were required to contain at least four consecutive calibration points, with concentration within ± 30% of known concentrations and a linear fit with r2 ≥ 0.95.
As part of quality control methods, method reporting limits (MRL) were determined as the average blank concentration plus 3× the standard deviation of the blanks; these ranged from 0.01 ng/ml serum for branched PFOS (br-PFOS) to 4 ng/ml for PFNA due to detection in serum blanks. Average recoveries from serum samples were generally within 60-140%, ranging from 87 [±3] % for linear PFOS (L-PFOS) to 123 [±52] % for PFOA.
Statistical analysis
All data were analyzed using JMP software (v.16, SAS Institute Inc., Cary, NC) with the exception of area under the curve (AUC) analysis, which was performed using Prism Software (v.10.1.1, GraphPad, Boston, MA). Differences between two groups at a single point in time were compared using a Student’s t-test. Differences between three groups at a single point in time relative to infection were evaluated using analysis of variance (ANOVA) followed by either a Tukey’s Honest Significant Difference (HSD) or a Dunnett’s post-hoc test. Differences between three groups over multiple timepoints were evaluated using a two-way ANOVA followed by a Tukey’s HSD test. Differences were considered statistically significant at p ≤ 0.05. Data shown are presented as either means ± SD or ± SEM. The specific statistical test and error bar denotations are indicated in each figure legend.
Results
Serum PFAS concentrations and Acox1 expression
Mice were exposed to either the 2 PFAS mixture or 4 PFAS mixture via drinking water prior to and throughout infection with IAV (). After 21 days of treatment, the mean water consumption of mice in each of the three groups was 3.9 to 4.3 ml/mouse/day and was not significantly different among the three groups (). The estimated administered dose of PFAS received by each group is listed in . Measured concentrations of PFOS () and PFOA () in serum were equivalent between mice that received the 2 PFAS and 4 PFAS mixtures and were significantly higher than mice receiving plain water (CTRL). The levels of PFHxS and PFNA in serum from mice treated with the 2 PFAS mixture were not different from mice receiving plain water (). In contrast, mice treated with the 4 PFAS mixture had serum levels of PFHxS and PFNA that were significantly higher than serum from mice in CTRL and 2 PFAS groups ().
Figure 1. PFAS serum concentrations and hepatic Acox1 expression after 21 days of treatment. (A) Adult (7-wk-old) female C57BL/6 mice were exposed to PFAS via the drinking water as either a binary mixture of PFOS and PFOA, or a quaternary mixture of PFOS, PFOA, PFHxS, and PFNA beginning 21 days prior to, and continuing throughout, infection with influenza A virus (IAV). Mice (5-9/treatment group/day) were randomly selected to be sacrificed on Day 0, 9, or 14 relative to infection. T- and B-cell populations in the mediastinal lymph node (MLN) were assessed by flow cytometry. (B-E) PFAS concentrations in serum were measured by LC-MS after 21 days of exposure. Data (presented as means ± SD) were analyzed using a one-way ANOVA followed by a Tukey’s HSD post-hoc test. Groups with different letters are significantly different from each other. Corresponding numerical values and multiple comparison p-values are provided in Table S2. (B) Mean serum PFOS (linear + branched isomers) concentration (n = 3 mice/group). (C) Mean PFOA concentration in serum (CTRL: n = 3, 2 PFAS: n = 2, 4 PFAS: n = 3). (D) Mean PFHxS (linear + branched isomers) concentration in serum (n = 3 mice/group). (E) Mean serum PFNA concentration (n = 3 mice/group). (F) qPCR was used to measure relative Acox1 expression in the livers of mice after 21 days of PFAS treatment relative to control (denoted by dashed line). Data shown are means ± SEM, n = 6 mice/group.
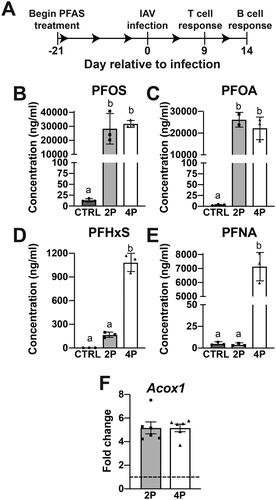
Table 1. Mean body weight, water consumption, and calculated PFAS doses administered throughout the experiment.
Acyl-CoA oxidase 1 (Acox1) is a gene involved in fatty acid oxidation, and is a PPARα target gene that is considered a biomarker of PFOA exposure, although other PFAS also induce its expression (Rosen et al. Citation2017; Schlezinger et al. Citation2020; Evans et al. Citation2022). Both the 2 PFAS and 4 PFAS mixture induced expression of Acox1 (), which indicated that the PFAS dosing strategy resulted in a measurable biological effect. Interestingly, the relative expression of Acox1 was not related to the number of PFAS in the mixture as both mixtures caused a 5-fold increase in its expression relative to control ().
Post-IAV infection body weights and MLN cellularity
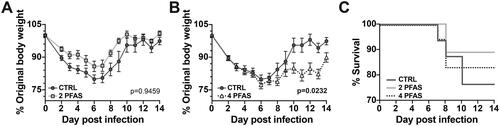
Prior to infection with IAV, there were no differences in body weight between control and PFAS-treated mice (). During infection, there was no difference in body weight between control mice and mice that received the 2 PFAS mixture (). However, mice that received 4 PFAS mixture lost significantly more weight during infection than control mice (). There were no significant differences in mortality between the groups ().
Figure 2. Exposure to the 4 PFAS mixture increased morbidity during influenza A virus infection. Mice were treated with PFAS via the drinking water for 21 days prior to being infected with IAV. Body weight was recorded daily during infection. (A) Graph depicts mean daily body weights of control mice (Day 0-6: n = 16, Day 7: n = 15, Day 8: n = 14, Day 9: n = 7, Day 10-14: n = 6) compared to that of mice treated with the 2 PFAS mixture (Day 0-7: n = 16, Day 8: n = 14, Day 9-14: n = 9). (B) Mean daily body weights of control mice compared to mice exposed to the 4 PFAS mixture (Day 0-6: n = 18, Day 7: n = 17, Day 8: n = 15, Day 9-14: n = 8). A two-way ANOVA was used to determine whether PFAS altered the trajectory of infection associated change in body weight. p-values shown in graphs correspond to treatment*day post-infection effect test. (C) Graph depicts percent survival throughout the 14-day IAV infection. Data shown are means ± SEM.
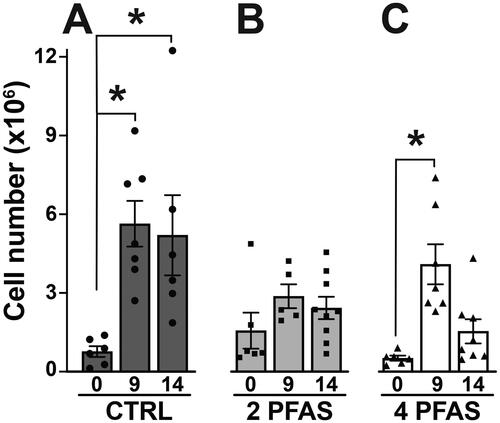
A major site of T-cell and B-cell responses to IAV infection are the lymph nodes that drain the respiratory tract, including the mediastinal lymph nodes (MLN). In mice, the peak day of the T-cell response to IAV is about 9 days after infection, whereas the peak B-cell response is on Day 14 (Lawrence et al. Citation2006; Lam and Baumgarth Citation2019). Compared to uninfected mice, the total number of MLN cells was higher in IAV infected mice. In control mice, IAV infection caused a 7.4-fold increase in the number of MLN cells on Day 9 post-infection, and a 6.8-fold increase on Day 14 compared to uninfected mice (Day 0) (). In contrast, the number of MLN cells in mice that received the 2 PFAS mixture was not significantly different than uninfected mice at either point in time after infection (). Similar to mice in the control group, in mice treated with the 4 PFAS mixture, there was a statistically-significant 7.9-fold increase in the number of MLN cells 9 days after infection (). However, unlike mice in the control group, this increase was not maintained, as the number of MLN cells was only 3-fold higher than uninfected mice on Day 14 post-infection (). These findings suggest that the PFAS mixtures differentially affected the overall magnitude of the response, but do not provide information about specific cell types that may be affected.
Figure 3. Influenza A virus infection increased MLN cellularity in control mice and mice exposed to the 4 PFAS mixture. Mice were exposed to either the 2 PFAS mixture, 4 PFAS mixture, or control (plain water) via drinking water for 21 days prior to infection with IAV, and remained on the same water after infection. (A) Mean number of MLN cells in control mice on days 0 (n = 6), 9 (n = 7), and 14 (n = 6) post-IAV infection. (B) Mean number of MLN cells in mice treated with the 2 PFAS mixture on days 0 (n = 6), 9 (n = 5), and 14 (n = 9) post-IAV infection. (C) Mean number of MLN cells in mice treated with the 4 PFAS mixture on days 0 (n = 6), 9 (n = 7), and 14 (n = 8) post-IAV infection. Differences in mean MLN cellularity within each treatment group were analyzed by one-way ANOVA followed by a dunnett’s post-hoc test using Day 0 as the control level. Data shown are means ± SEM. Asterisk (*) denotes p ≤ 0.05 compared to Day 0 within each treatment group. Between group differences in mean MLN cellularity over the course of infection were assessed by two-way ANOVA followed by a Tukey’s HSD post-hoc test; resulting p-values are listed in Table S3.
The 2 PFAS mixture reduces aspects of the T-cell response to influenza A virus infection
To evaluate whether exposure to the PFAS mixtures affected the T cell response to IAV, flow cytometry was used to enumerate CD8+ and CD4+ T-cells in the MLN. Compared to control, the total number of CD8+ T-cells was significantly reduced by the 2 PFAS mixture, but was not affected by the 4 PFAS mixture (). During infection, CD8+ T-cells differentiate into cytotoxic T-lymphocytes (CTL; CD44hiCD62LloCD8+CD3+) that directly kill infected cells via targeted release of cytotoxic granules (Kohlmeier and Woodland Citation2009). There was a statistically- significant 3-fold decrease in the number of CTL in mice treated with the 2 PFAS mixture compared to control. In contrast, the number of CTL in infected mice treated with the 4 PFAS mixture was not different than infected controls (). Likewise, the 2 PFAS mixture caused a significant reduction in the number of CD4+ T-cells and of activated (CD44hi) CD4+ T- cells, whereas treatment with the 4 PFAS mixture did not (). The percentages of CD8+ T-cells, CTL, CD4+ T-cells, and CD44hiCD4+ T-cells were not affected by exposure to either PFAS mixture (Table S4). With the exception of the number of T-regulatory (Treg) cells which was reduced in mice exposed to the 2 PFAS mixture, there were no differences in the percentage or number of CD4+ T-helper subsets (TH1, TH2, TH17, Tfh) between any of the groups (). These results suggest that exposure to the 2 PFAS mixture may interfere with the aspects of the CD8+ and CD4+ T-cell response to IAV.
Figure 4. The 2 PFAS mixture affected CD8+ and CD4+ T-cells during influenza virus infection. Flow cytometry was used to measure CD8+ and CD4+ T-cell populations in MLN of PFAS-exposed and control mice on Day 9 post-infection. (A) Mean number of CD8+ T-cells. (B) Mean number of CTL (CD44hiCD62LloCD8+). (C) Mean number of CD4+ T-cells. (D) Mean number of activated (CD44hi) CD4+ T-cells. Data (shown as mean ± SEM) were analyzed by one-way ANOVA followed by a Tukey’s HSD post-hoc test. *significant difference (p ≤ 0.05) between groups indicated. p-values from Tukey’s test are listed in Table S4. CTRL: n = 7, 2 PFAS: n = 5; 4 PFAS: n = 7.
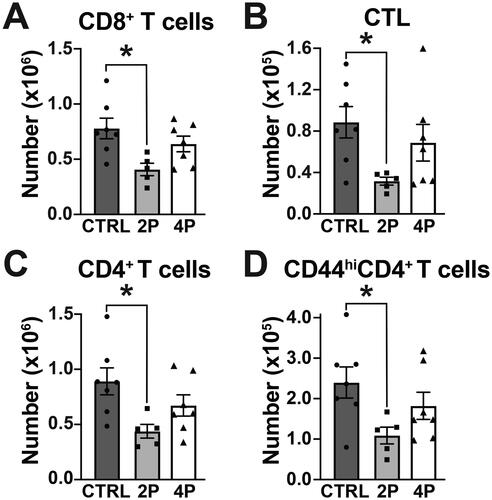
Table 2. Percentage and number of CD4+ T-cell Sub-populations in MLN on Day 9 post-IAV infection.
Treatment with 4 PFAS mixture reduces the B-cell response to influenza A virus infection
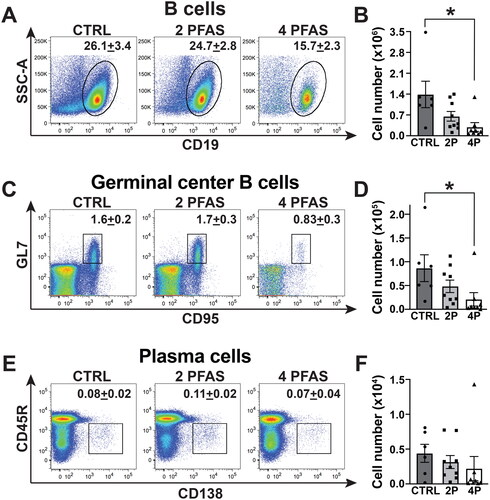
During IAV infection, B-cells form germinal centers that support the production of plasma cells that make high affinity, class switched antibodies (Nera et al. Citation2015). Treatment with the 4 PFAS mixture reduced (p = 0.055) the percentage of B-cells (CD19+CD3-) (). There was also a significant 4.7-fold reduction in the number of B-cells in the MLN (). The percentage of germinal center (GC) B-cells (GL7+CD95+CD45R+CD138-CD19+CD3-) in both PFAS mixture groups was not statistically different from control (). However, the number of GC B-cells was significantly reduced by 75% in infected mice that were exposed to the 4 PFAS mixture (). Neither the percentage (), nor number (), of plasma cells (CD45R +/- CD138+CD19+CD3-) was significantly affected by exposure to either PFAS mixture ().
Figure 5. The 4 PFAS mixture affected the B-cell response to influenza A virus infection. Flow cytometry was used to measure B-cell populations in MLN of PFAS-exposed and control mice on Day 14 post-infection. (A) Representative dot plots depict the percentage of B-cells (CD19+) in MLN. Mean percentage of cells is indicated on each plot. (B) Mean number of B- cells. (C) Representative dot-plots show percentage of germinal center (GC) B-cells (GL7+CD95+CD45R+CD138-CD19+CD3-) in each group. (D) Mean number of GC B-cells. (E) Representative dot-plots show mean percentage of plasma cells (CD45R+/-CD138+CD19+CD3-). (F) Mean number of plasma cells in MLN. Data shown are means ± SEM. A one-way ANOVA followed by a Tukey’s HSD post-hoc test was used to compare the data. *significant difference (p ≤ 0.05) between groups indicated. p-values from Tukey’s test are listed in Table S5. CTRL: n = 6, 2 PFAS: n = 9; 4 PFAS: n = 8.
PFAS mixtures differentially-affect the antibody response to influenza A virus infection
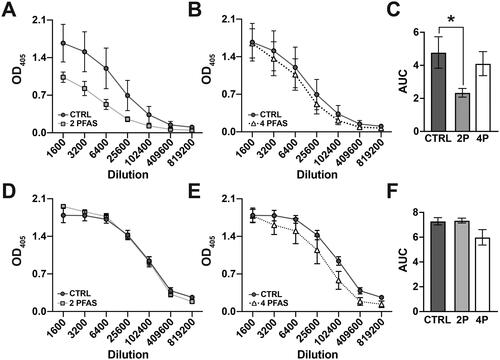
Plasma cells are a subset of activated B-cells that produce antibodies. The relative amount of IAV-specific IgM () and IAV-specific IgG () in serum on Day 14 post-infection was measured by ELISA, and area under the curve (AUC) analysis was performed to facilitate comparisons across groups (). Mice that were exposed to the 2 PFAS mixture had a statistically-significant 2-fold reduction in the relative level of IAV-specific IgM compared to infected controls (). In contrast, there was no significant difference in IgM levels between mice that received the 4 PFAS mixture and control (). Relative levels of IAV-specific IgG were not significantly affected by exposure to either the 2 PFAS () or 4 PFAS () mixture. Taken together, these results suggest that the 2 PFAS and 4 PFAS mixtures differentially affect the adaptive immune response to IAV infection. The 2 PFAS mixture affects the T-cell response and IgM production while the 4 PFAS mixture affects aspects of the B-cell response.
Figure 6. The 2 PFAS mixture caused a reduction in circulating IAV-specific IgM antibodies. Serum was collected on Day 14 post-infection and relative levels of IAV-specific IgM and IgG antibodies were measured by ELISA. (A, B) Line graphs show relative IgM antibody levels in serially diluted serum samples from (A) control mice vs. mice exposed to the 2 PFAS mixture and (B) control mice vs. mice treated with the 4 PFAS mixture. (C) Bar graph depicts the corresponding mean area under the curve (AUC) values for each group. (D, E) Line graphs show relative IgG antibody levels in serially diluted serum samples from (D) control mice vs. mice exposed to the 2 PFAS mixture and (E) control mice vs. mice treated with the 4 PFAS mixture. (F) Bar graph depicts the corresponding mean AUC values for each group. N = 4 mice/group. Data are represented as mean ± SEM. AUC data were analyzed by one-way ANOVA followed by a Tukey’s HSD post-hoc test. *significant difference (p ≤ 0.05) between the indicated groups.
Discussion
Among the thousands of PFAS that exist, PFOS, PFOA, PFHxS, and PFNA are frequently detected and are considered major contributors to the PFAS burden in human serum (Kato et al. Citation2011; Post et al. Citation2013; Guelfo and Adamson Citation2018; EFSA Citation2020; De Silva et al. Citation2021; USEPA Citation2023b). Based on findings from epidemiological and experimental studies, the adaptive immune system is considered sensitive to PFAS (Chang et al. Citation2016; Sunderland et al. Citation2019; ATSDR Citation2021; Fenton et al. Citation2021; Ehrlich et al. Citation2023). PFAS commonly co-occur as mixtures; however, their immunotoxicity has been largely studied as individual compounds (Calafat et al. Citation2019; CDC 2019; Fenton et al. Citation2021; USEPA Citation2023b). The goal of the study reported here was to compare effects of two different PFAS mixtures on the adaptive immune response to infection with a common respiratory pathogen. The analysis here revealed that the binary (PFOS, PFOA) and quaternary (PFOS, PFOA, PFHxS, PFNA) mixtures affected different aspects of the adaptive immune response to IAV. Specifically, the binary PFAS mixture affected the T-cell response and production of IAV-specific IgM, while the quaternary PFAS mixture affected aspects of the B-cell response.
The concentrations of PFAS in the drinking water provided to the mice in this study and the serum concentrations that these exposures produced are greater than those reported in serum of the general U.S. population (Calafat et al. Citation2019). However, the concentration in the water and estimated administered dose are consistent with, or lower than, PFAS doses used in prior animal studies (Dewitt et al. Citation2008; Dong et al. Citation2009; Guelfo and Adamson Citation2018; CDC Citation2019; Narizzano et al. Citation2023; Smalling et al. Citation2023; Taylor et al. Citation2023). Moreover, there are similarities between the overall trends in PFAS serum concentrations of the mice in this study and that of humans. For example, concentrations of PFAS in human serum are generally not equal, and concentrations of PFOS and PFOA are typically higher than that of PFHxS and PFNA (Pérez et al. Citation2013; Calafat et al. Citation2019; CDC Citation2019).
Since some PFAS share common adverse effects in humans and mice, such as suppressed antibody responses, the USEPA has proposed a PFAS mixtures risk assessment strategy based on dose additivity (USEPA Citation2023b). One caveat of dose additivity, which is highlighted by findings from this study, is that while individual PFAS may produce the same effect, the effect of the mixture may not be additive (Cousins et al. Citation2020). In separate studies, PFOS and PFOA each individually suppressed SRBC-specific IgM antibodies (Dewitt et al. Citation2008, Citation2016; Peden-Adams et al. Citation2008; Dong et al. Citation2009). In the present study, levels of IAV-specific IgM antibodies in mice exposed to the binary mixture of PFOS and PFOA were diminished to roughly half that of control mice; however, when PFHxS and PFNA were added to the mixture, levels of virus-specific IgM were not significantly different than control. Likewise, while the binary mixture significantly reduced T-cell endpoints relative to those measured in control mice, treatment with the quaternary mixture did not. These findings suggest that effects of PFAS mixtures are not simply additive and there may be interactions between PFAS in a mixture that influence overall mixture toxicity.
Results of the current study also suggest immunotoxic consequences of PFAS mixtures may vary by cell type. While the quaternary mixture did not affect the T-cell populations measured herein, it did significantly reduce the number of B-cells and germinal center B-cells. Conversely, there were no significant differences in the B-cell populations examined between mice that were treated with the binary mixture and control. Since the present study did not examine the effects of each individual PFAS in the mixture, it was not possible to determine whether the changes in B-cells after exposure to the quaternary mixture are dose-additive or whether they are specific effects of PFHxS or PFNA. Regardless, the results suggest that the mode of action of PFAS mixtures may differ in different immune cell populations. Interestingly, the binary and quaternary mixtures induced equivalent expression of the PPARα target gene Acox1 (Li et al. Citation2019). Given that PFOS, PFOA, PFHxS, and PFNA have each been shown to induce expression of Acox1, this finding suggests that the mixtures may share a common mode of action, although PFAS act through many different signaling pathways (DeWitt et al. Citation2016; Rosen et al. Citation2017; Schlezinger et al. Citation2020; Evans et al. Citation2022).
Compared to the binary mixture and control, mice that were exposed to the quaternary PFAS mixture exhibited significantly increased morbidity during IAV infection. Weight loss during infection is reflective of a culmination of systemic effects and cannot be attributed to a particular cell type, however it provides a general indication of disease severity. In humans, effects of environmental exposures on the immune system include increased duration and severity of infection (Feingold et al. Citation2010; Franchini and Lawrence Citation2018). This finding suggests that exposure to PFAS mixtures may worsen the prognosis of an infection. This is potentially significant because missing work due to illness or spending more time in a hospital has a negative impact on the economy and public health in general. The idea that PFAS exposure may worsen infection severity is consistent with reports from epidemiological studies that PFAS exposure is associated with persistent viral and parasitic infections and may be associated with increased susceptibility to and severity of COVID-19 infection (Grandjean et al. Citation2020; Bulka et al. Citation2021; Ji et al. Citation2021). Taken together, the findings from the current studies demonstrate the importance of studying PFAS mixtures and of examining multiple cell types when assessing the immunotoxic effects of PFAS mixtures.
Author contributions
CMP and BPL conceived and designed research project; CMP and CM performed experi-ments; CMP and CM analyzed data; CMP, CM and BPL interpreted results of experiments; CMP prepared figures; CMP drafted the manuscript; CMP, CM and BPL edited and revised the manuscript; CMP, CM and BPL all approved the final version of the manuscript.
Supplemental Material
Download PDF (130.1 KB)Disclosure statement
The authors declare no competing or financial interests. BPL has served as a consultant for Teva Pharmaceuticals; however, this is unrelated to this research project, and Teva provided no support for this project.
Additional information
Funding
References
- Agency for Toxic Substances and Disease Registry [ATSDR]. 2021. Toxicological profile for perfluoroalkyls. Atlanta (GA): Agency for Toxic Substances and Disease Registry.
- Antoniou E, Colnot T, Zeegers M, Dekant W. 2022. Immunomodulation and exposure to per- and polyfluoroalkyl substances: An overview of the current evidence from animal and human studies. Arch Toxicol. 96(8):2261–2285. doi: 10.1007/s00204-022-03303-4.
- Barrett T, Inglis S. 1985. Growth, purification, and titration of influenza viruses. In: Mahy B, editor. Virology: A practical approach. Washington (DC): IRL Press. p. 119–150.
- Boule L, Burke C, Jin G, Lawrence B. 2018. Aryl hydrocarbon receptor signaling modulates antiviral immune responses: Ligand metabolism rather than chemical source is the stronger predictor of outcome. Sci Rep. 8(1):1826. doi: 10.1038/s41598-018-20197-4.
- Boule L, Winans B, Lawrence B. 2014. Effects of developmental activation of the Ahr on CD4+ T-cell responses to influenza virus infection in adult mice. Environ Health Perspect. 122(11):1201–1208. doi: 10.1289/ehp.1408110.
- Bulka C, Avula V, Fry R. 2021. Associations of exposure to perfluoroalkyl substances individually and in mixtures with persistent infections: Recent findings from NHANES 1999-2016. Environ Pollut. 275:116619. doi: 10.1016/j.envpol.2021.116619.
- Calafat A, Kato K, Hubbard K, Jia T, Botelho J, Wong L. 2019. Legacy and alternative per- and polyfluoroalkyl substances in the U.S. general population: Paired serum-urine data from the 2013-2014 National Health and Nutrition Examination Survey. Environ Int. 131:105048. doi: 10.1016/j.envint.2019.105048.
- Centers for Disease Control [CDC]. 2019, January. Fourth national report on human exposure to environmental chemicals: Updated tables. Vol. 1. Atlanta: Centers for Disease Control and Prevention.
- Chang E, Adami H, Boffetta P, Wedner H, Mandel J. 2016. A critical review of perfluoroocta-noate and perfluorooctanesulfonate exposure and immunological health conditions in humans. Crit Rev Toxicol. 46(4):279–331. doi: 10.3109/10408444.2015.1122573.
- Cousins IT, DeWitt JC, Glüge J, Goldenman G, Herzke D, Lohmann R, Miller M, Ng CA, Scheringer M, Vierke L, et al. 2020. Strategies for grouping per- and polyfluoroalkyl substances (PFAS) to protect human and environmental health. Environ Sci Process Impacts. 22(7):1444–1460. doi: 10.1039/d0em00147c.
- De Silva AO, Armitage JM, Bruton TA, Dassuncao C, Heiger-Bernays W, Hu XC, Kärrman A, Kelly B, Ng C, Robuck A, et al. 2021. PFAS exposure pathways for humans and wildlife: A synthesis of current knowledge and key gaps in understanding. Environ Toxicol Chem. 40(3):631–657. doi: 10.1002/etc.4935.
- DeWitt J, Blossom S, Schaider L. 2019. Exposure to per-fluoroalkyl and polyfluoroalkyl substances leads to immunotoxicity: Epidemiological and toxicological evidence. J Expo Sci Environ Epidemiol. 29(2):148–156. doi: 10.1038/s41370-018-0097-y.
- DeWitt J, Williams W, Creech N, Luebke R. 2016. Suppression of antigen-specific antibody responses in mice exposed to perfluorooctanoic acid: Role of PPARα and T- and B-cell targeting. J Immunotoxicol. 13(1):38–45. doi: 10.3109/1547691X.2014.996682.
- Dewitt J, Copeland C, Strynar M, Luebke R. 2008. Perfluorooctanoic acid-induced immuno-modulation in adult C57Bl/6J or C57Bl/6N female mice. Environ Health Perspect. 116(5):644–650. doi: 10.1289/ehp.10896.
- Dong G, Zhang Y, Zheng L, Liu W, Jin Y, He Q. 2009. Chronic effects of perfluorooctanesulfo-nate exposure on immunotoxicity in adult male C57Bl/6 mice. Arch Toxicol. 83(9):805–815. doi: 10.1007/s00204-009-0424-0.
- Ehrlich V, Bil W, Vandebriel R, Granum B, Luijten M, Lindeman B, Grandjean P, Kaiser A, Hauzenberger I, Hartmann C, et al. 2023. Consideration of pathways for immunotoxicity of per- and polyfluoroalkyl substances (PFAS). Environ Health. 22(1):19. doi: 10.1186/s12940-022-00958-5.
- European Food Safety Authority [EFSA]. 2020. Risk to human health related to the presence of perfluoroalkyl substances in food. EFSA J. 18(9):e06223.
- Evans N, Conley J, Cardon M, Hartig P, Medlock-Kakaley E, Gray L. Jr. 2022. In vitro activity of a panel of per- and polyfluoroalkyl substances (PFAS), fatty acids, and pharmaceuticals in peroxisome proliferator-activated receptor (PPAR)-α, PPAR-γ, and estrogen receptor assays. Toxicol Appl Pharmacol. 449:116136. doi: 10.1016/j.taap.2022.116136.
- Fair P, Driscoll E, Mollenhauer M, Bradshaw S, Yun S, Kannan K, Bossart G, Keil D, Peden-Adams M. 2011. Effects of environmentally-relevant levels of perfluorooctane sulfonate on clinical parameters and immunological functions in B6C3F1 mice. J Immunotoxicol. 8(1):17–29. doi: 10.3109/1547691X.2010.527868.
- Feingold B, Vegosen L, Davis M, Leibler J, Peterson A, Silbergeld E. 2010. A niche for infectious disease in environmental health: Re-thinking the toxicological paradigm. Environ Health Perspect. 118(8):1165–1172. doi: 10.1289/ehp.0901866.
- Fenton S, Ducatman A, Boobis A, DeWitt J, Lau C, Ng C, Smith J, Roberts S. 2021. Per- and polyfluoroalkyl substance toxicity and human health review: Current state of knowledge and strategies for informing future research. Environ Toxicol Chem. 40(3):606–630. doi: 10.1002/etc.4890.
- Franchini A, Lawrence B. 2018. Environmental exposures are hidden modifiers of anti-viral immunity. Curr Opin Toxicol. 10:54–59. doi: 10.1016/j.cotox.2018.01.004.
- Glüge J, Scheringer M, Cousins IT, DeWitt JC, Goldenman G, Herzke D, Lohmann R, Ng CA, Trier X, Wang Z. 2020. An overview of the uses of per- and polyfluoroalkyl substances (PFAS). Environ Sci Process Impacts. 22(12):2345–2373. doi: 10.1039/d0em00291g.
- Grandjean P, Timmermann CAG, Kruse M, Nielsen F, Vinholt PJ, Boding L, Heilmann C, Mølbak K. 2020. Severity of COIVD-19 at elevated exposure to perfluorinated alkylates. PLoS One. 15(12):e0244815. doi: 10.1371/journal.pone.0244815.
- Guelfo J, Adamson D. 2018. Evaluation of a national data set for insights into sources, composition, and concentrations of per- and polyfluoroalkyl substances (PFAS) in U.S. drinking water. Environ Pollut. 236:505–513. doi: 10.1016/j.envpol.2018.01.066.
- Houser C, Lawrence B. 2022. The aryl hydrocarbon receptor modulates T-follicular helper cell responses to influenza virus infection in mice. J Immunol. 208(10):2319–2330. doi: 10.4049/jimmunol.2100936.
- Ji J, Song L, Wang J, Yang Z, Yan H, Li T, Yu L, Jian L, Jiang F, Li J, et al. 2021. Association between urinary per- and poly-fluoroalkyl substances and COVID-19 susceptibility. Environ Int. 153:106524.,. doi: 10.1016/j.envint.2021.106524.
- Kato K, Wong LY, Jia LT, Kuklenyik Z, Calafat AM. 2011. Trends in exposure to polyfluoroalkyl chemicals in the U.S. population: 1999-2008. Environ Sci Technol. 45(19):8037–8045. doi: 10.1021/es1043613.
- Kohlmeier J, Woodland D. 2009. Immunity to respiratory viruses. Annu Rev Immunol. 27(1):61–82. doi: 10.1146/annurev.immunol.021908.132625.
- La Gruta N, Turner S. 2014. T-Cell-mediated immunity to influenza: Mechanisms of viral control. Trends Immunol. 35(8):396–402. doi: 10.1016/j.it.2014.06.004.
- Lam J, Baumgarth N. 2019. The multifaceted B-cell response to influenza virus. J Immunol. 202(2):351–359. doi: 10.4049/jimmunol.1801208.
- Lawrence B, Roberts A, Neumiller J, Cundiff J, Woodland D. 2006. Aryl hydrocarbon receptor activation impairs the priming but not the recall of influenza virus-specific CD8+ T-cells in the lung. J Immunol. 177(9):5819–5828. doi: 10.4049/jimmunol.177.9.5819.
- Li Y, Andersson A, Xu Y, Pineda D, Nilsson CA, Lindh C, Jakobsson K, Fletcher T. 2022. Determinants of serum half-lives for linear and branched perfluoroalkyl substances after long-term high exposure-a study in Ronneby, Sweden. Environ Int. 163:107198. doi: 10.1016/j.envint.2022.107198.
- Li D, Zhang L, Zhang Y, Guan S, Gong X, Wang X. 2019. Maternal exposure to perfluoro-octanoic acid (PFOA) causes liver toxicity through PPARα pathway and lowered histone acetylation in female offspring mice. Environ Sci Pollut Res Int. 26(18):18866–18875. doi: 10.1007/s11356-019-05258-z.
- Maddalon A, Pierzchalski A, Kretschmer T, Bauer M, Zenclussen AC, Marinovich M, Corsini E, Herberth G. 2023. Mixtures of per- and poly-fluoroalkyl substances (PFAS) reduce the in vitro activation of human T-cells and basophils. Chemosphere. 336:139204. doi: 10.1016/j.chemosphere.2023.139204.
- McDonough C, Ward C, Hu Q, Vance S, Higgins C, DeWitt J. 2020. Immunotoxicity of an electrochemically-fluorinated aqueous film-forming foam. Toxicol Sci. 178(1):104–114. doi: 10.1093/toxsci/kfaa138.
- Narizzano A, Bohannon M, East A, Guigni B, Quinn M. Jr. 2023. Reproductive and immune effects emerge at similar thresholds of PFHXs in deer mice. Reprod Toxicol. 120:108421. doi: 10.1016/j.reprotox.2023.108421.
- Nera K-P, Kyläniemi MK, Lassila O. 2015. Regulation of B-cell to plasma cell transition within the follicular B-cell response. Scand J Immunol. 82(3):225–234. doi: 10.1111/sji.12336.
- Nilsson S, Smurthwaite K, Aylward LL, Kay M, Toms LM, King L, Marrington S, Barnes C, Kirk MD, Mueller JF, et al. 2022. Serum concentration trends and apparent half-lives of per- and polyfluoroalkyl substances (PFAS) in Australian firefighters. Int J Hyg Environ Health. 246:114040. doi: 10.1016/j.ijheh.2022.114040.
- Ojo A, Peng C, Ng J. 2021. Assessing the human health risks of per- and polyfluoroalkyl substances: A need for greater focus on their interactions as mixtures. J Hazard Mater. 407:124863. doi: 10.1016/j.jhazmat.2020.124863.
- Peden-Adams M, Keller J, Eudaly J, Berger J, Gilkeson G, Keil D. 2008. Suppression of humoral immunity in mice following exposure to perfluorooctane sulfonate. Toxicol Sci. 104(1):144–154. doi: 10.1093/toxsci/kfn059.
- Pérez F, Nadal M, Navarro-Ortega A, Fàbrega F, Domingo JL, Barceló D, Farré M. 2013. Accumulation of perfluoroalkyl substances in human tissues. Environ Int. 59:354–362. doi: 10.1016/j.envint.2013.06.004.
- Post G, Louis J, Lippincott R, Procopio N. 2013. Occurrence of perfluorinated compounds in raw water from New Jersey public drinking water systems. Environ Sci Technol. 47(23):13266–13275. doi: 10.1021/es402884x.
- Post C, Myers J, Winans B, Lawrence B. 2023. Postnatal administration of S-adenosylmethi-onine restores developmental Ahr activation-induced deficits in CD8+ T-cell function during influenza a virus infection. Toxicol Sci. 192(2):233–246. doi: 10.1093/toxsci/kfad019.
- Rockwell C, Turley A, Cheng X, Fields P, Klaassen C. 2013. Acute immunotoxic effects of perfluorononanoic acid (PFNA) in C57Bl/6 mice. Clin Exp Pharmacol. (Suppl. 4):S4-002.
- Rockwell C, Turley A, Cheng X, Fields P, Klaassen C. 2017. Persistent alterations in immune cell populations and function from a single dose of perfluorononanoic acid (PFNA) in C57Bl/6 mice. Food Chem Toxicol. 100:24–33. doi: 10.1016/j.fct.2016.12.004.
- Rosato I, Bonato T, Fletcher T, Batzella E, Canova C. 2023. Estimation of per- and poly-fluoro-alkyl substances (PFAS) half-lives in human studies: A systematic review and meta-analysis. Environ Res. 242:117743. doi: 10.1016/j.envres.2023.117743.
- Rosen M, Das K, Rooney J, Abbott B, Lau C, Corton J. 2017. PPARα-independent transcrip-tional targets of perfluoroalkyl acids revealed by transcript profiling. Toxicology. 387:95–107. doi: 10.1016/j.tox.2017.05.013.
- Schlezinger J, Puckett H, Oliver J, Nielsen G, Heiger-Bernays W, Webster T. 2020. Perfluorooctanoic acid activates multiple nuclear receptor pathways and skews expression of genes regulating cholesterol homeostasis in liver of humanized PPARα mice fed an american diet. Toxicol Appl Pharmacol. 405:115204. doi: 10.1016/j.taap.2020.115204.
- Smalling KL, Romanok KM, Bradley PM, Morriss MC, Gray JL, Kanagy LK, Gordon SE, Williams BM, Breitmeyer SE, Jones DK, et al. 2023. Per- and polyfluoroalkyl substances (PFAS) in United States tap water: Comparison of underserved private-well and public-supply exposures and associated health implications. Environ Int. 178:108033. doi: 10.1016/j.envint.2023.108033.
- Strutt T, McKinstry K, Marshall N, Vong A, Dutton R, Swain S. 2013. Multi-pronged CD4+ T-cell effector and memory responses cooperate to provide potent immunity against respiratory virus. Immunol Rev. 255(1):149–164. doi: 10.1111/imr.12088.
- Sunderland E, Hu X, Dassuncao C, Tokranov A, Wagner C, Allen J. 2019. A review of the pathways of human exposure to poly- and per-fluoroalkyl substances (PFASs) and present understanding of health effects. J Expo Sci Environ Epidemiol. 29(2):131–147. doi: 10.1038/s41370-018-0094-1.
- Taylor K, Woodlief T, Ahmed A, Hu Q, Duncker P, DeWitt J. 2023. Quantifying the impact of pfoa exposure on b-cell development and antibody production. Toxicol Sci. 194(1):101–108. doi: 10.1093/toxsci/kfad043.
- Torres L, Redko A, Limper C, Imbiakha B, Chang S, August A. 2021. Effect of perfluorooctane-sulfonic acid (PFOS) on immune cell development and function in mice. Immunol Lett. 233:31–41. doi: 10.1016/j.imlet.2021.03.006.
- United States Environmental Protection Agency [USEPA]. 2022. Lifetime drinking water health advisories for four perfluoroalkyl substances
- USEPA. 2023a. Framework for estimating non-cancer health risks associated with mixtures of per- and poly-fluoroalkyl substances (PFAS).
- USEPA. 2023b. Per- and poly-fluoroalkyl substances national primary drinking water regulation. EPA-HQ-OW-2022-0114-0027. 18638–18754.
- USEPA. 2023c. Public comment draft - toxicity assessment and proposed maximum contaminant level goal (MCLG) for perfluorooctane sulfonic acid (PFOS) (CASRN 1763-23-1) in drinking water.
- USEPA. 2023d. Public comment draft - toxicity assessment and proposed maximum contaminant level goal (MCLG) for perfluorooctanoic acid (PFOA) (CASRN 335-67-1) in drinking water.
- Warren T, Mitchell K, Lawrence B. 2000. Exposure to 2,3,7,8-tetrachlorodibenzo-p-dioxin (TCDD) suppresses the humoral and cell-mediated immune responses to influenza A virus without affecting cytolytic activity in the lung. Toxicol Sci. 56(1):114–123. doi: 10.1093/toxsci/56.1.114.
- Winans B, Nagari A, Chae M, Post C, Ko C, Puga A, Kraus W, Lawrence B. 2015. Linking the aryl hydrocarbon receptor with altered DNA methylation patterns and developmentally induced aberrant antiviral CD8+ T-cell responses. J Immunol. 194(9):4446–4457. doi: 10.4049/jimmunol.1402044.