
 ?Mathematical formulae have been encoded as MathML and are displayed in this HTML version using MathJax in order to improve their display. Uncheck the box to turn MathJax off. This feature requires Javascript. Click on a formula to zoom.
Abstract
Concern about the environmental impacts of consumption has drawn research attention to the drivers of conspicuous and luxury (C/L) consumption. Given the prevailing patterns of overconsumption, most studies to date have focused on countries in the global North. However, an emerging high-consuming middle and upper class in nations such as India and Brazil makes it imperative to extend the study of C/L consumption to these contexts. Research that does exist pertaining to India has predominantly focused only on the role of social identity in driving consumption growth among certain groups. Our study proposes a broader conceptual framework, incorporating a variety of possible factors and applying multivariate statistical analysis to household-expenditure data from the India Human Development Survey. We examine how C/L consumption expenditure is correlated not just with the economic ability to consume (income or wealth) but also with potential socio-psychological drivers and moderators. The results show that while the economic ability to consume (income or its proxy) is an enabling factor, mass-media exposure and social network activity appear to influence C/L consumption positively. Education and caste have more mixed relationships with consumption, and interaction effects between these two variables and economic ability to consume are also significant. The results highlight the importance of socio-psychological factors in shaping consumption decisions beyond the enabling role of income and wealth. Improving understanding of this broader set of factors, as well as their interaction effects, is particularly salient for devising better policies for transitioning toward more sustainable consumption patterns in a large developing country such as India.
Introduction
In the last few decades, environmental problems have become severe enough to threaten the sustainability of human existence on Earth (UNEP and Columbia Law School Citation2015) even as they continue to disproportionately affect the lives of socio-economically marginalized sections of society. That this crisis is caused by the production and consumption practices of human beings is obvious, but the debate has been whether it is the “subsistence” consumption of a burgeoning poor population or the “luxury” consumption of the affluent that is responsible for current conditions (Kempf Citation2008). While initial analyses attempted to assign responsibility to population growth for the global environmental crisis (Ehrlich Citation1971), it has now been demonstrated that affluent or luxury consumption practices are the main drivers of the associated problems (Toth and Szigeti Citation2016; York, Rosa, and Dietz Citation2003), leading to the recent “warning on affluence” by a large number of scientists (Wiedmann et al. Citation2020). There is, therefore, an urgent need to understand what drives overconsumption (Princen, Maniates, and Conca Citation2002).
Given that no one consumes with the explicit intent of harming the environment and that environmental impacts are always unintended consequences of consumption choices, overconsumption can only be understood in terms of the utility that consumers derive – or think they derive – whether functional or symbolic, from what is palpably “unnecessary” consumption (Akenji Citation2019). Attempts to understand the underlying motivations for such consumption have a long lineage. Veblen (Citation1899) coined the term “conspicuous consumption” to argue that the highly visible ostentatiousness of wealthy individuals during the Gilded Age was their way of showing their elite social status. More recently, psychologists have sought to explain consumption behavior as identity-building or as a way to express self-worth (Dittmar Citation2007; Shove and Warde Citation2001). Other analysts have argued that “luxury consumption” may take many forms – owning of goods or pursuit of experiences – and is driven by a desire for an easy life, pleasure-seeking, and perhaps also the need to impress one’s peers through branded products and other types of one-upmanship (Akenji Citation2019). It appears then that luxury consumption may be a superset of conspicuous consumption, especially since mass production has made such goods and services more affordable, and the motivations for consumption are hard to distinguish simply from its form. We, therefore, use the term “C/L consumption” to broadly include all such “unnecessary” consumption, whether meant for public display or private enjoyment. This would typically be consumption beyond what is required to sustain a “decent living standard” (e.g., as in Rao and Baer Citation2012), even if generously defined.
Considering the enormous gap in the average levels of affluence (and corresponding pollution-emission levels) between countries in the global North and the global South, it is not surprising that much of the literature seeking to analyze factors causing C/L consumption is focused on the former. However, it has increasingly been pointed out that elite consumerism exists and is rising even in the global South, particularly in emerging economies such as India and Brazil (Ahuja Citation2014; Raj et al. Citation2013). Even if luxury consumption in India does not match the levels of, or is not as widespread as that in, say, the United States, the impacts of such consumption are greater and more unjust when one considers regional environmental impacts in a part of the world with widespread poverty, resource scarcity, and limited pollution-sink capacity. Indeed, Bhar (Citation2021) shows that the water, particulate matter (PM 2.5), and carbon-dioxide (CO2) footprints of households in the top decile of India’s consumers are several times higher than the average levels, causing both global and (more so) regional impacts. Understanding what drives such C/L consumption in emerging economies is, therefore, an equally urgent task. The limited literature on C/L consumption in India focuses largely on the role of social identity in driving consumption growth among previously marginalized groups and not on the wider factors likely to influence such consumption.
In light of this situation, we present a study that explores the broader correlates of C/L consumption in India, drawing upon a publicly available survey of consumption expenditures. The article is organized as follows. The next section presents a detailed review of both theoretical and empirical literature from across the world on drivers of C/L consumption. Based on this discussion, we then outline a conceptual framework to understand the drivers of C/L consumption and describe the methods, variables, data, and statistical models employed in the analysis. This is followed by a presentation of our results, where we also elaborate on how we enhanced the robustness of the analysis given various data limitations. We then present the implications of the results, highlighting their contribution to the empirical literature on drivers of conspicuous or luxury consumption. The final section summarizes the findings, discusses their wider ramifications, and describes the limitations of this study.
Understanding the motives and the drivers of C/L consumption
What do we know about the processes and factors that drive C/L consumption across the globe? A major strand in the literature follows the method of econometric analysis. Among many such analyses of consumption, the study by Ferrer-I-Carbonell and van Den Bergh (Citation2004) stands out for its focus on luxury consumption, in particular second car ownership, vacation expenditure, flying, and energy use. As in other econometric studies, they treat preferences as given and seek to construct demand functions using budget constraints (income), prices, demographic variables such as household size, and some simple socio-economic factors such as education and the presence of a second earner. As in several other analyses, income turns out to be the major correlate, followed by demographic factors and the presence of a second earner.
This approach has two limitations. First, income or higher economic ability may look like the obvious driver of consumption. But, it is not that income drives choices or preferences; rather, it plays an enabling role for the expression of preferences, which themselves are the product of deeper socio-psychological processes. Clearly, there is a need to understand the motivations that induce people to use increased income toward more C/L consumption (as against, say, giving it away to the poor or saving it for the future). These socio-psychological factors are likely to be present across all income classes, but they manifest themselves more apparently when income increases provide the opportunity to consume. Second, the attempt to ascertain these socio-psychological processes is constrained by limited socio-economic data, restricting the analyses to demographic and educational variables. There is clearly a need to dig deeper.
Wilk (Citation2002) provides a comprehensive review of the literature that seeks to understand the sociopsychology of C/L consumption, classifying this work into three categories: individual choice theories, social theories, and cultural theories. First, individual choice theories explain consumption as caused by physical as well as psychological needs such as identity formation, self-image, and expression of selfhood. Wilk (Citation2002) notes that mass media, which are inseparable from advertising (whether in radio, television, or now Internet forms), expose the consumer to notions of the “right lifestyle” and “self-image” and purposefully instigate excessive consumption. Second, social theories of consumption identify the desire to emulate one’s peers (keeping up with the Joneses) as most significant, and therefore consumption levels will be driven by the kind of company one keeps or peers one recognizes (Wilk Citation2002). He also notes that consumption acts as a social code, and people consume to fit in and gain social standing and acceptance or to stand out. Finally, cultural theories point to the symbolic meaning of consumer goods in a cultural setting and how individuals use possession for communication. Schor (Citation1992) discusses how the prevailing consumer culture demolishes local cultural practices to push consumers to go down a spiral of narcissistic spending and unhappiness.
In addition to these socio-psychological drivers of consumption, Wilk (Citation2002) suggests that the socio-cultural disposition of an individual plays an important role. Socio-cultural disposition broadly refers to the values and worldviews that an individual holds, which determine how they filter broad notions (such as needing to keep up with the Joneses, on the one hand, and needing to limit one’s environmental footprint or behave charitably on the other) and concretizes them into preferences and choices.
While the consumer’s psychological makeup (including self-image, identity, tendency to compete with peers, level of narcissism, and socio-cultural disposition) may drive consumption choices, this begs the question: What factors shape this psychology of the consumer? After all, the consumer is not born with this makeup but is socialized mainly into it. Understanding these factors or processes that are “external” to the individual and influence individual thinking (and thereby their consumption choices) has been the focus of much research, which we review briefly, indicating the regional context of each study where possible.
First, an obvious and potent driver of the psychological tilt toward C/L consumption, particularly luxury consumption, is exposure to advertising in all its different forms. To the extent that advertising in the modern world is driven largely by corporate capital, promotional announcements make people materialistically oriented in life (Janssens Citation2012; Krähmer Citation2005). This public messaging does so by exploiting the multiple individual psychological vulnerabilities discussed above and convincing the individual that they need to consume more to feel content and happy (Sirgy et al. Citation2012; Niazi et al. Citation2012; Sama Citation2019). The general communication strategy includes projecting certain (typically lavish) lifestyles as desirable, manipulating self-images, promoting narcissism, and orienting one’s life-project around consumer possessions. Consequently, advertising does not just change people’s tastes but increases their overall “wants” (Paek and Pan Citation2004; Nairn and Berthon Citation2003; Dhaliwal Citation2016; Tomlinson Citation1999).
Second, the nature of one’s social interactions is of paramount relevance as a driver. It is apparent that members of traditional elites are also today indulging in outsized consumption patterns – whether in the form of luxury cruises, multiple holiday homes, lavish cars, or private jets – that have large environmental footprints (Lynch et al. Citation2019). The socio-psychological factor, in this case, is peer pressure, not explicitly caused by social marginalization, but just the general tendency to “keep up with the Joneses” (Gulati Citation2017; Makgosa and Mohube Citation2007). These studies do not tell us what psychology is operating but rather only speculate. Presumably, the kind of peer networks one has will significantly influence one’s consumption choices (Makgosa and Mohube Citation2007).
Third, the current social status of the consumer drives consumption, but this condition manifests in complex ways. Households belonging to a less affluent socio-economic class may – in their search for higher social status – want to prove that they have “arrived” by following the expenditure habits of their richer neighbors. Indeed, several studies show that, across the world, socio-historically marginalized caste or ethnic groups tend to spend more on C/L consumption than other groups, even compromising expenditure on food and education if necessary (Ramakrishnan et al. Citation2020; Marjit, Sattwik, and Hati Citation2018; Jaikumar, Singh, and Sarin Citation2018; Linssen, Kempen, and Kraaykamp Citation2011; Khamis, Prakash, and Siddique Citation2012; Bellet and Shira Citation2016). Such patterns have also been observed in India. For instance, Acharya and Nirjar (Citation2016) show how due to the phenomenon of “massification of luxury,” households from poorer socio-economic strata indulge in luxury consumption patterns even when they cannot afford them.
Fourth, through shaping socio-cultural disposition, an individual’s education level appears to play a significant role in determining the extent to which they indulge in C/L consumption (Memushi Citation2014). Wilk (Citation2002) explains how such tendencies, defined by Bourdieu’s concept of “habitus,” contribute to this process. On one hand, with higher education, individuals are known to develop “tastes” that clearly induce their C/L consumption (Chaudhuri and Majumdar Citation2006). On the other hand, while the concept of disposition is complex, it alerts us to factors that may influence consumption decisions indirectly by shaping the consumer’s outlook – values and worldviews – over the long term. Prominent among these factors is education, which could expose an individual to new values and worldviews beyond those received from their peer group and can reduce the propensity to C/L consumption choices (e.g., Amaldoss and Jain Citation2005; Memushi Citation2014; Chao and Schor Citation1998; Yoon and Seok Citation1996). In addition, individuals with spiritual experiences are found to have lower desires for conspicuous goods (Stillman et al. Citation2012).
Finally, research has indicated that certain “demographic” factors such as age and gender also influence consumer behavior, although in complex ways. Younger individuals have been observed to be more prone toward greater C/L expenditure (e.g., Sims-Muhammad Citation2012; Shukla Citation2008). Janssens et al. (Citation2011) suggest that men have a higher propensity for C/L consumption in the context of attracting prospective partners, whereas Prakash (Citation1992) and Wang and Griskevicius (Citation2014) suggest that women are likely to consume conspicuously to earn higher social status and recognition.
From the above discussion, one observes certain trends in the literature.Footnote1 First, the vast majority of research that adopts an economics-oriented quantitative approach to understand the drivers of C/L consumption has been in countries of the global North. Second, studies in India have either tended to focus solely on income as the primary – or oftentimes only – explanatory variable or has highlighted the role of caste or social marginalization in prompting greater consumption. Third, methodologically, establishing the influence of (or correlation between) “external” factors on consumer choices is possible using large survey-based datasets. But to delve into the deeper psychological understanding of identity and image formation, disposition, and so forth, it is necessary to conduct in-depth qualitative or ethnographic research that is not possible on a large scale. Finally, even survey-based studies have often focused on the role of individual external drivers and less on their combined and interactive effects and have not always controlled for the enabling role played by wealth or income.
Conceptual framework and approach, data, and methods
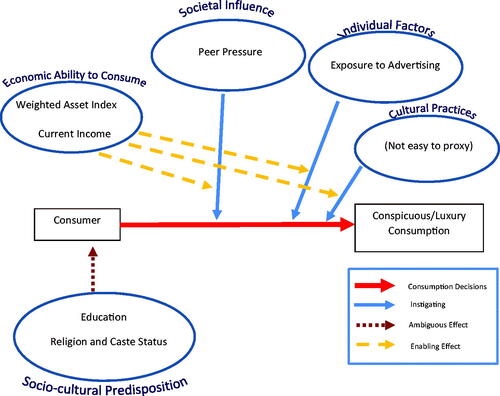
As indicated in the introduction, the primary research question of this article is what drives C/L consumption in India. The literature review presented in the previous section has summarized what is known about the deeper psychological factors – as well as the external factors that may influence this psychology – of C/L consumption. The external factors are not mutually exclusive, although most studies have tended to focus on one factor at a time. To understand how these various factors work in tandem to influence C/L consumption decisions, we propose an inclusive framework, which is shown schematically in . In particular, we allow for the possibility that several external factors, including exposure to advertising, peer pressure, social background, and education, may influence the deeper psychological factors of consumers, be it self-image, tendencies to keep up with the Joneses, narcissistic tendencies, or socio-cultural disposition, and therefore their consumption choices. The economic capacity to consume has an enabling effect. Finally, certain factors such as education or religion may shape consumers’ socio-cultural predisposition so that they react differently to the various instigating effects to which they are subjected. The methodological challenge, of course, is one of finding variables that can capture or be effective proxies for all these factors, and this is the matter to which we now turn.
Figure 1. C/L consumption framework: proximate correlates of C/L consumption.
In this section, we describe how we operationalize the previously discussed conceptual framework. As outlined earlier, a strict econometric approach using budget constraints and prices does not provide insights into the factors that shape preferences. We thus take a broad statistical approach where we include proxies of the different “external” factors in our framework and their interaction in a regression equation while controlling for income or economic ability to consume. We appropriately address any endogeneity and other statistical concerns that may arise. In the following subsections, we first describe the secondary dataset that we used for this investigation and justify our choice in the context of this article. Then we discuss each of the proxies for different factors as available in the dataset. We end this section by explaining the structure of the statistical models.
Consumption data: India Human Development Survey 2012
The dataset used for this analysis of consumption is the India Human Development Survey (IHDS) which is a nationally representative household-level dataset collected by the University of Maryland and the National Council of Applied Economic Research based in New Delhi (Desai, Vanneman, and NCAER Citation2005, Citation2011–2012) and made publicly available.Footnote2 We used the consumption data from the latest available data collection which occurred in 2012 and included data on 42,152 households and 54 consumption items.Footnote3 Out of this range of categories of consumption, 35 variables were estimates of consumption over a thirty-day period, while the values for the other 19 variables represented expenditures over one year. We extrapolated the latter into annual values to make them commensurate with the former values.
The income data comprised the sum total of wages and salaries, non-farm business income, net agricultural income, remittances, property, and other income such as public benefits received by the entire household. This amount included “negative income” such as loan repayments. Consequently, where the loan repayments exceeded gross income, the household's net income was negative. For our analysis, to make the interpretation of results more straightforward, we converted the negative net incomes to zero.
Identifying C/L consumption from the IHDS dataset
How does one define the C/L consumption basket using the IHDS dataset? The 54 variables on consumption in the survey ranged from various food expenditures to expenditures on social functions, vacations, eating out, and so forth.Footnote4 While intuition suggests some variables as “obviously” constituting C/L consumption, are there systematic ways of defining it, given the culturally specific nature of what signals status and what constitutes luxury? Moreover, while some variables can be easily categorized as entirely C/L expenditures, others may include both subsistence and luxury consumption, making it difficult to classify them. For instance, expenditures on jewelry may be easily seen as C/L consumption and, in almost its entirety, as also expenditures on recreational goods. But expenditures on transport equipment are given as a single variable that does not distinguish between purchasing a car or a motorized two-wheeler, let alone between a small car and a sport-utility vehicle (SUV). Similarly, footwear may mean simple shoes or luxury attire. Therefore, not all the expenditures assigned to a C/L category necessarily constitute C/L consumption: some proportion of each item’s consumption would be required even within a “basic needs” lifestyle. We have tried to address these two challenges – what constitutes C/L consumption and how to extract it from broadly defined variables – as follows.
We started with a study conducted by Khamis, Prakash, and Siddique (Citation2012) on identifying “conspicuous” consumption using the same IHDS dataset. Through an online survey, the authors identified which of the 54 consumption categories in the survey were “visible” and thus regarded as being associated with high income. They ended up classifying the following expenditure categories as “conspicuous consumption”: personal transport equipment, footwear, vacations, furniture and fixtures, social functions, repair and maintenance, house rent, entertainment, clothing and bedding, jewelry and ornaments, recreation goods, and personal goods. Their categorization provided the primary list for this analysis, but we modified it as described here. We added restaurants and eating out, cooking and household appliances, and petrol and vehicle maintenance as these categories are typically not “visible” but should arguably be included in a basket that comprises luxury consumption. We verified that these three categories demonstrated a sharp rise in expenditure – comparable to other C/L categories – in higher income deciles. The possibility that these broad expenditure categories could include some subsistence consumption as well (at least in the case of appliances and petrol/vehicle maintenance) is addressed further below.
We also excluded the following three categories from the basket of “conspicuous” consumption:
Mean expenditures on “footwear” demonstrate a slower rise across deciles, making it difficult to determine where C/L consumption in this category might begin, if at all.
“House rents and society charges” is an expenditure that is relevant only to urban areas.
“Repair and maintenance” pertains to incurred costs for house repair and bathroom maintenance and is largely limited to urban areas.
The final list of twelve variables presumed to represent C/L consumption and the other (“subsistence”) consumption categories are summarized in . However, of these, at least five variables are “fuzzy,” in other words, they are likely to contain both subsistence and C/L expenditures: petrol and vehicle maintenance, clothing and bedding, furniture/fixtures, cooking and household appliances, and personal transport equipment. To account for this situation, the mean expenditures in each of these categories were evaluated for each expenditure decile of total consumption. For all these categories, we observed that the mean expenditures increased slowly up until the eighth decile and then showed a sharp increase in the last (topmost) two deciles.Footnote5 This observation suggests that the mean expenditure of the eighth decile could represent the maximum subsistence expenditures for that category. Therefore, expenditures beyond the mean expenditure of the eighth decile in that category were considered as C/L expenditures for that category. We used this modified C/L expenditure estimate in our regression equation. While this adjustment does not eliminate the problem of “fuzziness” entirely, it provides a better approximation that is perhaps the best possible, given the data.
Table 1. Variables assigned to different consumption baskets.
Measure of economic ability to consume
There are two ways to measure economic capacity to consume: current income, which is a flow, and current wealth, which is a stock of assets but might represent historically accumulated savings. The relative usefulness of each variable has been discussed at length in the literature (Scott and Ben Citation1990; Bouis Citation1994; Sahn and Stifel Citation2003). To the extent that households prefer to “live within their means,” their spending may be constrained by annual income. Alternatively, they may draw upon past accumulation/savings both in times of need or when purchasing big-ticket luxury items, and the ability to do so might depend upon pre-existing wealth, which an asset index can represent. Collecting information on assets is known to be somewhat easier and less likely to have errors in comparison to income or total consumption expenditures (Kolenikov and Angeles Citation2009). We, therefore, decided to employ both approaches and constructed two separate regression models corresponding to two different proxies for the economic ability to consume: income and an asset index.
To construct an asset index, we broadly followed the method developed by Filmer and Pritchett (Citation2001) by employing principal component analysis on a group of assets. The first principal component, which captures the highest variation among the other components, is used here as the weight for each asset. Following these authors, the list of assets includes the list of assets used in constructing the standard non-weighted asset index provided in the second phase of IHDS, two housing quality-related dummy variables indicating Equation(1)(1) the quality of roofing, wall, and flooring of houses and (2) a continuous variable denoting land ownership of each household (see the data supplement for details). We have validated the constructed index as suggested by Filmer and Pritchett (Citation2001) by testing for internal coherence (the index produces clean separations across the poor, middle, and rich households based on each of the assets individually) and robustness (it is not sensitive to the inclusion or exclusion of any particular individual asset). Results of the tests are provided in the data supplement.
Socio-psychological drivers of C/L consumption
For socio-psychological drivers of C/L consumption, we looked for variables in the IHDS survey that most closely represented the multiple external factors that might influence the psychology of consumption, as proposed in the conceptual framework discussed above. We constructed the following variables from the data available (summary statistics of all the variables are presented in ). Note that we are constrained by the variables available in the IHDS dataset, and as such, cannot proxy all possible influences.
Table 2. Summaries of all variables used in the analysis.
Hours of mass-media exposure represent exposure to advertising and are hypothesized to have an instigating effect.
Social network index (SNI) is the number of individuals a household knows who hold socially-respected professional positions. It is deemed to represent the household’s peer network and is hypothesized to have an instigating effect.
Education level represents socio-cultural disposition and is hypothesized to have an ambiguous moderating effect.
Religion and caste status, a composite categorical variable representing socio-cultural disposition and is hypothesized to have an ambiguous moderating effect, can impact positively and negatively.
These variables were constructed from the raw individual-level data in the IHDS survey in particular ways, which we describe in greater detail below.
Mass-media exposure: IHDS has a series of variables (e.g., whether a person reads newspapers, regularly listens to the radio, watches television, and the duration of television-watching in hours per day) for assessing the mass-media exposure of individuals in a household. The extent of television watching is measured separately for men, women, and children. We have chosen the total television-watching hours per day and the average television hours per day as two possible ways of representing mass-media exposure. Admittedly, there might be an overlap in the hours of television watching by men, women, and children in a household. However, since no other information is provided to determine the overlap, the simple addition seems the most appropriate strategy to create an aggregate index. Running the regressions with the average hours of television watching per capita did not change the results significantly.
Social network index: The IHDS survey collected data on social network variables to indicate how a particular household is connected to individuals who hold a socially respectable position due to their professions. The rationale behind choosing this as a proxy for “peer pressure” is that an acquaintance of this kind could, to some extent, set a “bar” that the household has to meet in terms of consumption practices. To determine whether any weighting was required, we used principal component analysis. However, the evaluated weights (all are between 0.35 and 0.40) indicate that there was not much of a difference in the relative importance of these variables. Hence, we decided to use a simple addition of the binary values of the following six categories – doctor, school teacher/principal, government officer, police inspector, military personnel, and other government employee – to construct a composite index ranging from 0 to 6 for the social network. The excluded ones are other school workers, elected politicians, political party workers, police constables, and health workers, as these professions are not considered aspirational and thus may not be indicative of social status as compared to the ones included.
Education level: IHDS provides three variables to denote the education level of the household: years of education for the highest educated male, female, and adult individuals (regardless of whether male or female) of households. As women of a household also influence various consumption decisions, instead of the years of education of the highest educated individual adult, we relied on the years of education of the highest educated male and female adults and added them to create a composite index denoting the education level of the household.
Religion and caste status: A composite categorical variable was already provided in the IHDS survey to denote households’ religion and caste status. This variable categorizes households either as Muslims or as Christians and other religions. Hindus were classified into one of the standard groupings: Brahmins, other forward castes, other backward castes (referred as OBCs), Dalit (scheduled backward caste), and Adivasi (scheduled tribe).Footnote6 We used the same variable in our analysis.
Demographic variables: Since consumption expenditures were measured at the household level (not individual level), the size and demographic composition of the household influenced aggregate consumption: larger households tended to consume more and households with more children might have spent larger sums on necessities rather than on luxuries. Following Roychowdhury (Citation2017), we used three variables as demographic controls: the total number of persons in the household, the number of married individuals, and the number of children (below age 18) expressed as proportions of the total number of persons in the household. To control for age and gender, the age and gender of household heads are included as the widely adopted strategy in literature (Roychowdhury Citation2017).
In addition, because rural and urban settings may influence consumption choices, a composite categorical variable denotes the household’s location (rural, urban, metropolitan cities).
Statistical model
At the outset, it is important to note that the conceptually distinct role of different variables – driving, enabling, moderating, and so forth – cannot really be captured in a multiple regression model. Nevertheless, by choosing the interaction terms carefully, some indication of these roles can be obtained. Accordingly, the baseline ordinary least squares (OLS) regression equation, in which income represented economic ability to consume, was specified as:
(1)
where C/L = C/L consumption expenditure [loge of C/L expenditure is used to counter the skewness of the variable (see Ferrer-I-Carbonell and Van Den Bergh (Citation2004)]; IN = economic ability to consume (weighted asset index [WAI] or current income [CI]); SNI = social network index; MM = mass-media exposure; EDU = education level; caste/religion = the composite religion and caste status; DC = demographic controlsi denotes the household number; βs are the coefficients that denote the effects of various dependent variables on C/L expenditure.
The coefficients of the interaction terms are β6 to β11.
The interaction terms are included to assess the enabling or moderating impacts that we anticipated certain factors have on the main drivers. Specifically, as we conceptualized income to have an enabling effect, the interaction terms between income and the main drivers – SNI and mass-media exposure – are included (coefficients: β6 and β7). Similarly, education and caste/religion status are hypothesized to influence consumers’ socio-cultural disposition, and hence interaction terms of these factors with SNI and mass-media exposure are included (coefficients: β8 to β11).
We refined this basic model in various ways. First, WAI was used to proxy the economic ability to consume (instead of income). This was because there was a possibility of endogeneity due to the fact that both WAI and C/L expenditure included the value of various assets purchased in the year preceding the survey. To overcome this endogeneity problem, we adopted three alternative strategies.
We employed an instrumental variable-based two-stage least squares (2SLS) model (Model IV). The instrumental variable is whether a household has liquified petroleum gas (LPG) or not (correlation coefficient 0.95 with WAI and 0.4 with C/L expenditure). This variable concerning LPG usage/ownership in households could very well proxy the long-term economic status of households, but this being a necessity could never be indicative of C/L consumption. So intuitively, this variable seems a good fit as an instrumental variable, considering that an instrumental variable should be ideally correlated with a concerning independent variable but not correlated with the dependent variable.Footnote7 A 2SLS regression analysis employing this instrumental variable was carried out based on EquationEquation (1)
(1) .
By constructing a narrower WAI, we obtained a WAI that incorporates only households’ characteristics (seven variables),Footnote8 land ownership, and possession of a credit card. The Spearman’s rank-correlation coefficient of this asset index with the main asset index is 0.79. This suggests that much of the variation in other assets is captured by this partial WAI. This partial WAI is no longer endogenous because there is no expenditure category in the C/L consumption expenditure that directly relates to household characteristics, land ownership, and credit-card ownership. It is thus appropriate to perform a standard OLS regression with this narrower WAI.
In the third set of models, a partial C/L expenditure is constructed, barring expenditures on transport equipment, recreational goods, and cooking and household appliances. The correlation coefficient between the complete C/L consumption expenditures and the partial C/L consumption expenditures is 0.95. This coefficient indicates that the three excluded consumption categories do not make a notable contribution to complete C/L consumption expenditures. In this case, as well, a standard OLS regression model was employed as the endogeneity concern did not hold considering partial C/L expenditure and WAI are mutually exclusive.
In addition, we used income instead of WAI as the measure of economic ability to consume. However, as the quality of the data was not sufficiently reliable for finer differentiation, and also considering it was comparatively difficult to interpret the interaction effects between two continuous variables, we converted income into a factor variable with five quintiles.Footnote9 Similarly, as education is a continuous variable, we adapted education into a variable with five levels.Footnote10
Results
The descriptive statistics presented in show that all the variables are, broadly speaking, distributed normally and thus suited for regression analysis.
The results of the OLS and 2SLS regressions using WAI as a proxy for income are presented in . The R-squared values are similar across models, clustering around 0.34. This level of R-squared is to be expected in such regressions.Footnote11 This is due to the noise in the data (inaccuracies in reporting of all the variables) and the limited set of variables available (the analysis is restricted to only those available in the IHDS dataset – which does not cover the complete set of potentially influential variables).
Table 3. Coefficients (expressed as the percentage of change in C/L) of independent variables in different models based on weighted asset index (Dependent variable: Loge C/L consumption expenditure).
The significance of different explanatory variables is as follows. First, as expected, C/L consumption is positively correlated with assets (WAI) as well as income (see and ) across models. Specifically, the coefficient of Model IV indicates that with a one-unit increase of WAI, C/L expenditures increase by 54%. The coefficients of WAI vary within a range of 21–54%, and the coefficients for income vary within a range of 1–2% per increase of 10,000 Indian rupees (INR).
Table 4. Coefficients (expressed as the percentage of change in C/L) of independent variables in different models based on income (Dependent variable: Loge C/L consumption expenditure).
Second, mass-media exposure also correlates positively with C/L expenditures of households. With one hour of extra mass-media exposure per day, a household’s annual C/L expenditure increases by about 4–7% across models. Across models, the interaction effects between WAI and mass-media exposure (MM) suggest that poorer households’ C/L expenditures are affected more by an increase in this variable than that of richer households. Throughout models, with higher education, mass-media exposure has a diminishing impact on C/L consumption. The interaction effects between mass-media exposure and religion and caste status are positive (i.e., C/L consumption of castes and religions other than Brahmins are more affected than the C/L consumption of Brahmins) across WAI and income-based models.
Third, SNI correlates with C/L consumption, where a one-unit increase of SNI, C/L expenditure increases by about 10–14%. The interaction effects between SNI and WAI show that SNI slightly influences C/L consumption of poorer households in a stronger manner than that of richer households. The same pattern holds for SNI and income interaction. For WAI-based models, the interaction effects between SNI and education level demonstrate mixed (both positive as well as negative coefficients) opposite patterns, while for income-based models, the effect is negative, i.e., the influence of SNI on C/L consumption decreases with higher education level. The interaction effects between SNI and religion and caste status in both WAI and income-based models show that the C/L consumption patterns of Brahmins are more influenced by peer pressure than other categories.
Fourth, education level alone weakly drives C/L consumption spending across all models. With one year of extra education, a household’s C/L expenditure is likely to increase by about 2–4%.
Finally, most of the coefficients for caste are generally insignificant, with only two models showing that C/L by Dalits is slightly lower than Brahmins.
Discussion
These results are broadly consistent with the hypothesized relationships, but the analysis also raised several unexpected and interesting questions, as outlined below.
Direct effects of economic ability to consume
As expected, regardless of which variable we used to capture the economic ability to consume (WAI, partial WAI, or income), it is positively and strongly significant in all models. The coefficients of WAI are approximately 35–65% in the different models. The same holds for income, but the effect is much smaller (0.1%) because of this variable's high degree of noise. This follows the pattern observed in other studies (e.g., Filmer and Pritchett, Citation2001), where asset data were found to be more reliable than income data.
The impact of mass-media exposure on C/L consumption
The two key variables hypothesized to actually drive C/L consumption were mass-media exposure and SNI. They were both found to be positively correlated with C/L consumption across the different models. These results suggest that increasing mass-media exposure increases the propensity for C/L consumption. This fits our intuition and corresponds well with the findings of Krähmer (Citation2005) and many others that mass media (especially advertising that is inseparable from more general forms in India), especially through the constant portrayal of how C/L consumption practices are absolutely normal and desirable, positively induces C/L consumption.
The interaction effects of mass-media exposure with income and wealth demonstrate contrasting results across the two sets of models. While for the WAI-based model, the effect either slightly decreases or remains indifferent, for income-based models, it increases. Mass-media exposure was predicted to have an increasing impact on C/L consumption with households’ rising wealth or income. This expectation stems from the fact that advertisements generally seek to make viewers feel that they are not good enough and should consume conspicuously to gain social acceptance. The sense of being incomplete ensures that whenever a household has some added disposable income, it tends to spend it on purchasing C/L goods, as found in the income-based models. We speculate that the interaction term with WAI has a slightly negative coefficient because households may not dip into long-term income (wealth) for advertising-induced purchases but rather make these acquisitions through disposable income.
Interestingly, while the level of education appears to be positively correlated with C/L consumption across all models, the coefficient of the interaction term between education and mass-media exposure is negative. This finding suggests that education may act as a moderator of the influence of advertising. Education may foster the ability to critically examine the messages received through mass media, and perhaps also foster some tendencies toward socially/environmentally responsible and irresponsible consumption. That is to say, relatively well-educated households may be less likely to easily fall prey to the messages conveyed in advertisements and are less persuaded to consume conspicuously. This observation, namely the moderating effect of education, is a novel contribution in the context of earlier findings that have tended to characterize education as positively related to (and therefore presumably a driver of) C/L consumption.
The interaction effects between mass-media exposure and religion and caste status across all models have positive coefficients. Christian and other religions seem to be influenced the most by mass-media exposure. Even Dalits, Adivasi, and forward castes are more affected than Brahmins.
The impact of social network index on C/L consumption
The positive impact of the SNI on C/L consumption indicates that when they are part of more affluent peer groups, households tend to spend more on C/L goods. Acquiring and maintaining social status have been posited as major drivers of C/L consumption and our results confirm this contention that social capital acquired through a social network tends to increase the propensity to consume C/L goods.
The interaction effects of SNI with the proxies for economic ability to consume demonstrate that (if we ignore the slight decrease in the WAI-based model), a household’s social network influences C/L consumption more strongly at higher levels of income. This suggests that the urge to keep up with the Joneses intensifies as connections with certain professional classes expand, and this urge is amplified as income/wealth increases. This pattern matches well with the work of Roychowdhury (Citation2017), Khamis, Prakash, and Siddique (Citation2012), Bellet and Shira (Citation2016) in the Indian context, and it supports the hypothesis that comparison with reference groups is an important driver of C/L expenditures of households.
The correlates of SNI increase with higher education levels across all models. As against the patterns observed in the case of interactions between education and mass-media exposure, individuals might also become very ambitious and competitive, especially in contemporary India, as education is seen largely as a means to a more comfortable standard of living. Accordingly, in current society, education does instill competitive spirits among individuals to a large extent and also makes them highly materialistic. In short, it appears that a higher level of education seems sufficient to insulate household-consumption decisions from the impact of mass-media exposure, but it may not provide distance from the impulses of social comparison and competition through their consumption patterns. This points to an interesting situation as it highlights the pervasive nature of social comparison and its strong impact on C/L consumption.
The interaction effects between SNI and religion and caste status show that across models, the C/L consumption of Brahmins is influenced most strongly by SNI. A possible explanation is that Brahmins have always been at the top of the ladder of social prestige and status in India and are focused on maintaining this standing through C/L consumption. In some models, households from so-called other forward castes that share the similar socio-economic status as Brahmins show similar influences of social networks. Given the limitations of the data and of the constructed SNI, we limit our speculations on this point.
Other variables that influence disposition and C/L consumption
The education level of a household is positively correlated with its C/L consumption. In other words, the propensity of C/L consumption increases with higher levels of education. This finding is consistent with the results reported by Amaldoss and Jain (Citation2005) and Chao and Schor (Citation1998) and the relationship is potentially attributable to the fact that with higher education the kind of social milieu to which one belongs also changes. To earn pride and prestige in more educated circles, it becomes necessary to keep up by consuming conspicuously. It is interesting that education does not seem to temper C/L consumption tendencies, although it does, as discussed above, appear to ameliorate the impact of mass-media exposure.
Interpreting the impact of religion and caste status on C/L consumption is not straightforward. Overall, the higher propensity of C/L consumption among forward castes, OBCs, Dalits, and even other religions, in comparison to Brahmins, is consistent with other studies such as Bellet and Shira (Citation2016), Khamis, Prakash, and Siddique (Citation2012). However, in this result, the Adivasi (scheduled tribes/indigenous people) community seems to have a consistently lower propensity for C/L consumption than Brahmins. This outcome could be because this community is economically underprivileged and known to possess a different worldview, which is still far from being materialistic (Sabar Citation2015). Another point of difference with Khamis, Prakash, and Siddique (Citation2012) is that they found Muslims to have a lower propensity toward C/L consumption in comparison to Brahmins and other forward caste members. The difference could have resulted from different model specifications or be due to the fact that Khamis et al. combined Brahmins and forward caste members into a composite category, while we consider them as two separate groups. These results bear further exploration through ethnographic studies or more precise survey data.
Conclusion
We began this article by highlighting the need to study the drivers of C/L consumption in developing countries such as India, where growing high-income consumers are joining the bandwagon of consumerism in a context of limited environmental space, especially at the regional scale. Drawing upon the (largely Northern) literature on drivers of C/L consumption, we proposed an inclusive conceptual framework linking “external” drivers such as the amount of mass-media exposure and extent of social network interaction with C/L consumption both directly and interactively with the main enabling factor – the economic ability to consume. We also hypothesized that factors such as education level, religion, or caste status might affect C/L consumption behavior, albeit in complex ways. We then (1) identified and disaggregated C/L expenditures from total expenditures in the IHDS 2012 dataset, (2) distinguished variables in the dataset that might reasonably represent the hypothesized factors, (3) developed alternative indices for the economic ability to consume and ways to address endogeneity between these indices and C/L expenditure, and (4) carried out a multiple regression analysis of the IHDS 2012 dataset using alternative statistical models.
The results are consistent across models and support most of the original hypotheses, although some of the interactions of the driver and socio-cultural variables are complex. First, it is clear that exposure to advertising and socializing with “elite” households are positively correlated with C/L consumption, after controlling for the economic capacity to consume. Second, education has a mixed effect – while its direct effect is positive, it does appear to ameliorate somewhat the effects of advertising in stimulating C/L expenditure. Curiously, education does not seem to have such a dampening effect on the pressure to “keep up” that is fostered by socializing in elite networks. Even more intriguingly, after controlling for all other variables, education appears to be positively correlated with C/L, possibly because education in India is still primarily a means for upward mobility. Finally, caste and religion have limited impact in and of themselves, but again, contrary to expectations; it is not the aspiration of upward acceptance of the lower castes but what seems to predominate is the impulse to maintain social status of the upper castes and for minorities to join them.
The significance of this work is that it presents an inclusive framework and then analyses the extent to which the hypothesized motivators of consumption might influence behavior, after controlling for income. The findings also indicate the importance of understanding the interaction between potential drivers and putative moderating or culturally specific factors. In the Indian context, this study is one of the few to focus on the category of C/L consumption as worthy of investigation from an environmental point of view and to go beyond the role of caste status in exploring what factors influence the consumer to pursue such consumption.
Inevitably, this study has some limitations. First, the dataset does not precisely capture C/L consumption sufficiently and precisely. In terms of sampling, the data are biased due to higher-income households being underrepresented, resulting in an underrepresentation of C/L consumption as well.Footnote12 In terms of precision, the “resolution” of the data is inadequate to separate essential and luxury consumption in the same board category. For instance, “expenditures on personal transport equipment” do not distinguish between premium brand cars and modest two-wheelers. This points to the need for all “consumption expenditure surveys,” whether by IHDS, the National Sample Survey Organization (NSSO), or others to go beyond an exclusive focus on the consumption of poor households and to provide equally detailed data on the higher-end consumption practices of wealthier households. While the concern driving such surveys historically may have been the need to assess poverty, the environmental impacts that C/L consumption causes are now also a pressing matter, and consumption surveys need to be suitably expanded.
Second, the challenge we faced in converting some of the variables in the IHDS dataset (attributes and practices of the household) into usable proxies of hypothesized drivers of consumption behaviors again points to the need for better-designed surveys in the Indian context and perhaps elsewhere. For example, along with the duration of exposure to various mediums of mass media, it is critical to collect information on exposure to different types of media (e.g., television, radio, social media). While companies invest considerable sums in market research to stimulate more consumption, the public interest would only be served if the state were to devote somewhat comparable amounts to understand how unsustainable consumption may be reduced. Our finding that mass-media exposure is correlated with C/L consumption only serves to underscore the need to limit contact with advertising in the interest of both the health of consumers and of the environment.
Finally, the quantitative approach of our study has a fundamental limitation; we can at best get a handle on the how and what of the correlating factors but cannot provide any insights into the processes leading to such patterns. To do so, will require complementing the findings with more ethnographic or qualitative analyses, especially work which links the so-called “external” factors to the “internal” psychological processes – formation of desires for a materialistic lifestyle, self-image, feelings pressured by peers, and so forth.Footnote13
The dramatic growth of the Indian economy since liberalization in 1991 has unleashed consumerism among the country’s relatively affluent households on a scale and form unimaginable in an otherwise still poor country. This study will hopefully mark the start of a major line of inquiry into (un)sustainable consumption in the global South and also to the possibility of going beyond econometrics (and the focus on income as a driver) into the multiple “social” factors influencing conspicuous and luxury consumption in a wider range of geographic contexts.
Supplemental Material
Download MS Word (34.6 KB)Disclosure statement
No potential conflict of interest was reported by the authors.
Notes
1 There are several studies in consumer studies and marketing that examine how various drivers or instigating factors (e.g., exposure to advertisements, social factors) influence purchasing behavior of particular products such as electrical appliances, consumer durables, organic food, and boutique coffee (Mohideen and Saravanan Citation2015; Wu and Zengh Citation2016; Alamgir et al. Citation2010; Mirzaei and Ruzdar Citation2013). We are consciously refraining from delving further into these studies as they often narrowly focus on a particular product category and do not examine C/L consumption practices as a basket; however, the findings of these studies are quite consistent with the literature we have surveyed.
2 This survey is quite exhaustive as it covered all the states and union territories of India with the exception of Andaman and Nicobar and Lakshadweep, two union territories which combined account for less than 0.05% of India’s total population.
3 The main reasons for selecting the IHDS survey over the more conventional and widely used datasets produced by the National Sample Survey Organization (NSSO) are that the IHDS includes more detail on C/L consumption, provides data on independent variables that can plausibly proxy for drivers of C/L consumption, and reports information on household income.
4 We acknowledge that there can be instances when expenditures can go down but consumption can go up, for instance when a family consumes more homegrown vegetables or vice versa when the price of a product rises. However, the focus of the article is particularly on non-subsistence consumption items that have to be procured from the market. In such cases, consumption and expenditures will be highly correlated.
5 The distribution of mean expenditures across consumption-expenditure deciles for those consumption categories is given in the data supplement.
6 For centuries, traditional Hindu society was divided into four broad categories (castes): brahmins, the class of priests and teachers; kshatriyas, the warrior class, who were the rulers and soldiers; vaishyas, the commercial class; and shudras, the servant and peasant class. Beneath these castes is a fifth population group – those without any caste, literally, outcastes traditionally known as “untouchables.” Then another group was the “tribals,” or the natives of the land before geographically external civilizations expanded in the subcontinent. In independent India, Kshatriyas and Vaishyas are categorized as other upward castes. A new grouping called the OBCs (other backward classes) was created, which falls between the traditional upper castes and the lowest. The “untouchables” or “Dalits,” as they describe themselves, are categorized as “scheduled castes,” and the tribals are designated as “scheduled tribes.”
7 The Wu-Huasman test is significant (at < 0.03), indicating that the IV-based model is an improvement over the model without it. The Weak Instruments tests are also significant (at <0.001) indicating the instrumental variable is strong.
8 The list of these variables can be found in the data supplement.
9 Weighted yearly per-capita mean income (in Indian rupees) for five deciles are: 6,000, 11,000, 18,300, 29,700, and 79,400.
10 Total mean years of education for households in the five levels of the rank education variable are: 1, 7, 13, 19, and 27.
11 For instance, the R-squared values obtained by Ferrer-i-Carbonell and van den Bergh (2004) are much lower than in this study.
12 Consumption expenditures are underreported as total consumption expenditures of all households as reported in the household survey (IHDS) and is slightly more than 50% of total final demand reported in the input-output table of 2011 (EXIOBASE). The underreporting is found to be about 30% higher on average in most of the C/L categories as compared to other consumption categories. Income is also underreported especially for the higher-income households. Only 24 households in IHDS II and three in IHDS I reported more than 2.5 million INR of income, which can be denoted as the income of top 2–3% of India’s population as per Chancel and Piketty (Citation2019). If these numbers are converted into weighted percentages, then for the second phase, it comes to be 0.07%, which is substantially lower than 2–3%. For the first phase, it is almost negligible.
13 A small beginning in that direction has been attempted by the first author in a complementary analysis that forms part of his dissertation (Bhar 2021) but much more remains to be done.
References
- Acharya, M., and A. Nirjar. 2016. “Luxury and Masses: Assessing the Connect in India.” International Journal of Indian Culture and Business Management 12 (4): 446–467.
- Ahuja, P. 2014. “Luxury Cars: A New Definition of Necessity in India.” International Journal of Commerce, Business and Management 3 (2): 260–268.
- Akenji, L. 2019. “Avoiding Consumer Scapegoatism: Towards a Political Economy of Sustainable Living.” PhD dissertation, University of Helsinki.
- Alamgir, M., N. Tasnuba, S. Mohammad, and N. Alexandru. 2010. “Influence of Brand Name on Consumer Decision Making Process: An Empirical Study on Car Buyers.” The USV Annals of Economics and Public Administration 10 (2): 142–153.
- Amaldoss, W., and S. Jain. 2005. “Pricing of Conspicuous Goods: A Competitive Analysis of Social Effects.” Journal of Marketing Research 42 (1): 30–42. doi:10.1509/jmkr.42.1.30.56883.
- Bellet, C., and E. Shira. 2016. Less Food for More Status: Caste Inequality and Conspicuous Consumption in India. LIEPP Working Paper No. 56. Paris: SciencesPo.
- Bhar, S. 2021. “Understanding the Environmental Impacts and Drivers of Consumption in India.” PhD dissertation, Manipal Academy of Higher Education.,
- Bouis, H. 1994. “The Effect of Income on Demand for Food in Poor Countries: Are Our Food Consumption Databases Giving Us Reliable Estimates?” Journal of Development Economics 44 (1): 199–226. doi:10.1016/0304-3878(94)00012-3.
- Chancel, L., and T. Piketty. 2019. “Indian Income Inequality, 1922–2014: From British Raj to Billionaire Raj?” Review of Income and Wealth 65 (S1): S33–S62.
- Chao, A., and J. Schor. 1998. “Empirical Tests of Status Consumption: Evidence from Women’s Cosmetics.” Journal of Economic Psychology 19 (1): 107–131. doi:10.1016/S0167-4870(97)00038-X.
- Chaudhuri, H., and S. Majumdar. 2006. “Of Diamonds and Desires: Understanding Conspicuous Consumption from a Contemporary Marketing Perspective.” Academy of Marketing Science Review 11: 1–18.
- Desai, S., R. Vanneman, and National Council of Applied Economic Research (NCAER). 2005. India Human Development Survey. ICPSR22626-v8. Ann Arbor, MI: Inter-university Consortium for Political and Social Research.
- Desai, S., R. Vanneman, and National Council of Applied Economic Research (NCAER). 2011–2012. Human Development Survey – II. ICPSR36151-v2. Ann Arbor, MI: Inter-university Consortium for Political and Social Research.
- Dhaliwal, A. 2016. “Effect of Advertisement on Consumer Buying Behavior.” International Journal of Scientific Research and Management 4 (9): 4501–4505.
- Dittmar, H. 2007. Consumer Culture, Identity and Well-Being: The Search for the “Good Life” and the “Body Perfect.” London: Psychology Press.
- Ehrlich, P. 1971. The Population Bomb. Rivercity, MA: Rivercity Press.
- Ferrer-I-Carbonell, A., and J. van den Bergh. 2004. “A Micro-Econometric Analysis of Determinants of Unsustainable Consumption in The Netherlands.” Environmental and Resource Economics 27 (4): 367–389. doi:10.1023/B:EARE.0000018514.98541.8b.
- Filmer, D., and L. Pritchett. 2001. “Estimating Wealth Effects without Expenditure Data or Tears: An Application to Educational Enrolments in States of India.” Demography 38 (1): 115–132. doi:10.2307/3088292.
- Gulati, S. 2017. “Impact of Peer Pressure on Buying Behaviors.” International Journal of Research – GRANTHAALAYAH 5 (6): 280–291. doi:10.29121/granthaalayah.v5.i6.2017.2027.
- Jaikumar, S., R. Singh, and A. Sarin. 2018. “‘I Show Off, So I Am Well Off’: Subjective Economic Well-Being and Conspicuous Consumption in an Emerging Economy.” Journal of Business Research 86 (18): 386–393. doi:10.1016/j.jbusres.2017.05.027.
- Janssens, K. 2012. Living in a Material World: The Effects of Advertising on Materialism. London: Lambert Academic Publishing.
- Janssens, K., M. Pandelaere, B. Van den Bergh, K. Millet, I. Lens, and K. Roe. 2011. “Can Buy Me Love: Mate Attraction Goals Lead to Perceptual Readiness for Status Products.” Journal of Experimental Social Psychology 47 (1): 254–258. doi:10.1016/j.jesp.2010.08.009.
- Kempf, H. 2008. How the Rich Are Destroying the Earth. Totnes: Green.
- Khamis, M., N. Prakash, and Z. Siddique. 2012. “Consumption and Social Identity: Evidence from India.” Journal of Economic Behavior & Organization 83 (3): 353–371. doi:10.1016/j.jebo.2012.07.002.
- Kolenikov, S., and G. Angeles. 2009. “Socioeconomic Status Measurement with Discrete Proxy Variable: Is Principal Component Analysis a Reliable Answer?” Review of Income and Wealth 55 (1): 128–165. doi:10.1111/j.1475-4991.2008.00309.x.
- Krähmer, D. 2005. “Advertising and Conspicuous Consumption.” Discussion Paper Series of SFB/TR 15 Governance and the Efficiency of Economic Systems 72. Berlin: Free University of Berlin, Humboldt University of Berlin, University of Bonn, and University of Manheim. https://ideas.repec.org/p/trf/wpaper/72.html
- Linssen, R., L. Kempen, and G. Kraaykamp. 2011. “Subjective Well-Being in Rural India: The Curse of Conspicuous Consumption.” Social Indicators Research 101 (1): 57–72. doi:10.1007/s11205-010-9635-2.
- Lynch, M., M. Long, P. Stretesky, and K. Barrett. 2019. “Measuring the Ecological Impact of the Wealthy: Excessive Consumption, Ecological Disorganization, Green Crime, and Justice.” Social Currents 6 (4): 377–395. doi:10.1177/2329496519847491.
- Makgosa, R., and K. Mohube. 2007. “Peer Influence on Young Adults’ Products Purchase Decisions.” African Journal of Business Management 1 (3): 64–71.
- Marjit, S., S. Sattwik, and K. Hati. 2018. Status Seeking Behavior of the Poor: A Study on India. Munich: CESifo. https://www.cesifo.org/en/publikationen/2018/working-paper/status-seeking-behavior-poor-study-india
- Memushi, A. 2014. “Conspicuous Consumption and Albanians: Determinant Factors.” South-Eastern Europe Journal of Economics 1: 65–87.
- Mirzaei, H., and M. Ruzdar. 2013. “The Impact of Social Factors Affecting Consumer Behavior on Selecting Characteristics of Purchased Cars.” Academic Journal of Research in Business and Accounting 2 (2): 1–13.
- Mohideen, R., and P. Saravanan. 2015. “A Study on Factors Determining Buying Decisions through Television Advertisements for Consumer Durables Goods.” International Journal of Management 6 (1): 473–479.
- Nairn, A., and P. Berthon. 2003. “Creating the Customer: The Influence of Advertising on Consumer Market Segments – Evidence and Ethics.” Journal of Business Ethics 42 (1): 83–100. doi:10.1023/A:1021620825950.
- Niazi, G., J. Siddiqui, B. Shah, and A. Hunjra. 2012. “Effective Advertising and Its Influence on Consumer Buying Behavior.” Information Management and Business Review 4 (3): 114–119. doi:10.22610/imbr.v4i3.971.
- Paek, H., and Z. Pan. 2004. “Spreading Global Consumerism: Effects of Mass Media and Advertising on Consumerist Values in China.” Mass Communication and Society 7 (4): 491–515. doi:10.1207/s15327825mcs0704_7.
- Prakash, V. 1992. “Sex Roles and Advertising Preferences.” Journal of Advertising Research 32 (3): 43–52.
- Princen, T., M. Maniates, and K. Conca, eds. 2002. Confronting Consumption. Cambridge, MA: MIT Press.
- Raj, M., P. Mohan, J. Sashikumar, and S. Sriram. 2013. “A Study on Consumer Brand Preference in SUVs and MUVs: An Effect of Marketing Mix Variable.” Journal of Arts, Science and Commerce 4 (1): 48–58.
- Ramakrishnan, A., M. Kalkuhl, S. Ahmad, and F. Creutzig. 2020. “Keeping up with the Patels: Conspicuous Consumption Drives the Adoption of Cars and Appliances in India.” Energy Research & Social Science 70: 101742. doi:10.1016/j.erss.2020.101742.
- Rao, N., and P. Baer. 2012. “‘Decent Living’ Emissions: A Conceptual Framework.” Sustainability 4 (4): 656–681. doi:10.3390/su4040656.
- Roychowdhury, P. 2017. “Visible Inequality, Status Competition and Conspicuous Consumption: Evidence from Rural India.” Oxford Economic Papers 69 (1): 36–54. doi:10.1093/oep/gpw056.
- Sabar, B. 2015. “Untouched Culture: Myth of Mainstreaming Chuktia Bhunjia Tribe of Odisha.” In Development and Discontent in Tribal India, edited by Y. Sisodia and T. Dalapati. Jaipur: Rawat Publications.
- Sahn, D., and D. Stifel. 2003. “Exploring Alternative Measures of Welfare in the Absence of Expenditure Data.” Review of Income and Wealth 49 (4): 463–489. doi:10.1111/j.0034-6586.2003.00100.x.
- Sama, R. 2019. “Impact of Media Advertisements on Consumer Behaviour.” Journal of Creative Communications 14 (1): 54–68. doi:10.1177/0973258618822624.
- Schor, J. 1992. The Overworked American: The Unexpected Decline of Leisure. New York: Basic Books.
- Scott, C., and A. Ben. 1990. Effect of Recall Duration on Reporting of Household Expenditures: An Experimental Study in Ghana. Washington, DC: World Bank.
- Shove, E., and A. Warde. 2001. “Inconspicuous Consumption: The Sociology of Consumption, Lifestyles and the Environment.” In Sociological Theory and the Environment, edited by R. Dunlap, F. Butel, P. Dickens, and A. Gijswijt, 230–251. Lanham, MD: Rowman and Littlefield.
- Shukla, P. 2008. “Conspicuous Consumption among Middle Age Consumers: Psychological and Brand.” Journal of Product & Brand Management 17 (1): 25–36. doi:10.1108/10610420810856495.
- Sims-Muhammad, T. 2012. “Young Adult Perception and Attitude toward Conspicuous Consumption and Poverty.” Journal of Social Sciences 8 (4): 512–518. doi:10.3844/jssp.2012.512.518.
- Sirgy, M., E. Gurel-Atay, D. Webb, M. Cicic, M. Husic, A. Ekici, A. Herrmann, et al. 2012. “Linking Advertising, Materialism, and Life Satisfaction.” Social Indicators Research 107 (1): 79–101. doi:10.1007/s11205-011-9829-2.
- Stillman, T., F. Fincham, K. Vohs, N. Lambert, and C. Phillips. 2012. “The Material and Immaterial in Conflict: Spirituality Reduces Conspicuous Consumption.” Journal of Economic Psychology 33 (1): 1–7. doi:10.1016/j.joep.2011.08.012.
- Tomlinson, J. 1999. Globalization and Culture. Chicago: University of Chicago Press.
- Toth, G., and C. Szigeti. 2016. “The Historical Ecological Footprint: From Over-Population to Over-Consumption.” Ecological Indicators 60: 283–291. doi:10.1016/j.ecolind.2015.06.040.
- United Nations Environment Programme (UNEP) and Columbia Law School. 2015. Climate Change and Human Rights. Nairobi: UNON Publishing Services Section. https://web.law.columbia.edu/sites/default/files/microsites/climate-change/climate_change_and_human_rights.pdf
- Veblen, T. 1899. The Theory of the Leisure Class: An Economic Study of Institutions. New York: Random House.
- Wang, Y., and V. Griskevicius. 2014. “Conspicuous Consumption, Relationships, and Rivals: Women’s Luxury Products as Signals to Other Women.” Journal of Consumer Research 40 (5): 834–854. doi:10.1086/673256.
- Wiedmann, T., M. Lenzen, L. Keysser, and J. Steinberger. 2020. “Scientists’ Warning on Affluence.” Nature Communication 11 (1): 3107.
- Wilk, R. 2002. “Consumption, Human Needs, and Global Environmental Change.” Global Environmental Change 12 (1): 5–13. doi:10.1016/S0959-3780(01)00028-0.
- Wu, X., and Y. Zengh. 2016. Social Factors that Influence Consumers’ Decisions When Buying Second-hand Cars in China. Bachelor’s thesis, University of Boras.
- Yoon, J., and H. Seok. 1996. “Conspicuous Consumption and Social Status in Korea: An Assessment of Reciprocal Effects.” Korea Journal of Population and Development 25 (2): 333–354.
- York, R., E. Rosa, and T. Dietz. 2003. “STIRPAT, IPAT and ImPACT: Analytic Tools for Unpacking the Driving Forces of Environmental Impacts.” Ecological Economics 46 (3): 351–365. doi:10.1016/S0921-8009(03)00188-5.