
Abstract
Working time reduction (WTR) is a promising policy to enhance well-being in rich countries and an important topic in discourses on a new social vision. Numerous small-scale WTR trials are either underway or planned in various contexts. Properly measuring changes in working time is necessary to evaluate these trials, but challenges abound. Traditional definitions and measurement methods may not work for fragmented, creative, and location-independent jobs. The primary aim of this article is to review relevant work-time definitions and data-collection methods, discuss their complexities, and summarize the implications for WTR research. We reviewed 243 articles and categorize indicators currently used in the literature by relying on 45 methodological studies to identify the main challenges and potential solutions. We conclude that the most dominant definitions and methods, notably usual weekly hours measured by worker surveys, are losing relevance and credibility in many contexts. With the rise of indicators focused on actual hours and measured by time diaries, work grids, interviews, automatic measurements, and time-sampling, we foresee the emergence of non-comparable, job-specific work-time indicators. We propose a new time-sampling approach to deal with some of the least measurable jobs.
Introduction
The reduction of working time (WT) is a widely supported strategy within post-growth economics which also receives substantial attention in the general media and may serve various economic, social, and environmental goals (Kallis et al. Citation2013; Pullinger Citation2014; Soper Citation2020). Arguably, limitations on WT represent the most promising way to keep unemployment low without the need for economic growth (Jackson and Victor Citation2011; Antal Citation2014) and this is important because past growth has generally been environmentally unsustainable (Haberl et al. Citation2020; Vadén et al. Citation2020) and prospects for green growth in the future are highly uncertain (Antal and van den Bergh Citation2016; Parrique et al. Citation2019; Hickel and Kallis Citation2020). Accordingly, post-growth economic models pay a great deal of attention to working time reduction (WTR) (Spangenberg, Omann, and Hinterberger Citation2002; Victor Citation2008; D’Alessandro et al. Citation2020).
Nevertheless, WTR is a very broad concept including dozens of different types of reductions, with potentially divergent economic, social, and environmental impacts (de Spiegelaere and Piasna Citation2017). Whether reductions are compensated (by increasing hourly wages) or uncompensated; whether the scheme is individual, collective, or universal in terms of participation; whether it shortens daily, weekly, annual, or lifetime working hours; what the initial levels of working hours are; and several other factors matter. These may significantly influence how patterns of consumption and time use change, with knock-on effects on employment (Marimon and Zilibotti Citation2000; Bosch and Lehndorff Citation2001), well-being (Kamerāde et al. Citation2019; Lepinteur Citation2019), and sustainability (King and van den Bergh Citation2017; Antal et al. Citation2021; Cieplinski, D’Alessandro, and Guarnieri Citation2021).
Given the variety of WTR programs currently being trialed and planned worldwide, including state-run programs in Iceland, Spain, and Scotland funded by tens of millions of euros as well as large sectoral and corporate schemes in other countries (NEF Citation2022), a proper understanding of causes and effects is key. This requires a careful description of the systems under investigation as well as their changes. The most obvious question refers to changes in WT. If we are unable to correctly tell how WT has changed, then it is not possible to estimate the impacts of similar changes elsewhere. Therefore, it will also be impossible to consciously apply WTR as a strategy to increase well-being or to reduce environmental impacts.
Yet the measurement of WT is very complex in itself. Specialization increases differences between work activities, resulting in job-specific measurement challenges. Digitalization complicates the distinction between work and non-work by fragmenting both and allowing workers to mix these fragments. Certain activities, such as long coffee breaks supporting creative work, may not even fit into a dichotomous work/non-work classification. Therefore, very different values may be obtained for WT depending on its definition and the measurement methods. Calculating aggregate data for groups of workers adds further layers of complexity. So, while measurement methods for well-being and environmental impacts develop, the reliability of WT measurements may actually decline.
Therefore, anyone who wants to understand the impacts of specific types of WTR must pay attention to the complexities of WT measurement. The present methodological review aims to facilitate this by identifying the main problems and their potential solutions based on the literature. Such an overview is useful for both primary and secondary research. When primary data are collected, it is crucial to be aware of the various ways in which WT can be defined and measured, as well as the potential pitfalls of the indicators. In the context of ongoing WTR trials, most researchers studying well-being and environmental impacts are unlikely to be experts in WT measurement, which makes a summary of this fragmented literature very helpful. For instance, knowing when it is necessary to go beyond standard survey questions will be critical, especially with the rise of company-level case studies. In the case of secondary analyses, common mistakes of the literature include the inadequate reporting and misuse of WT indicators (e.g., incorrect references to “actual WT” or flawed country comparisons). This article shows why carefully describing indicators and choosing data sources are so important and highlights data sources suitable for specific purposes. For both primary and secondary research, awareness of the limitations stemming from WT measurement helps to avoid the overinterpretation of results, which is common in scientific studies and even more prevalent in the grey literature and media reports. Together, these contributions may help to increase consistency and avoid confusion in the emerging research field around WTR.
The structure of the article is as follows. The next section gives a short theoretical overview of WT definitions and measurement methods. The third section outlines the research methods for the survey and the fourth section presents our results and a synthesizing discussion where we present WT definitions and measurement methods used in the literature, review their complexities, and describe implications for different types of WTR studies. Finally, the last section summarizes our conclusions for WTR research.
Theoretical overview
WT definitions
The International Labour Organization (ILO) suggests seven different WT definitions for research purposes to make measurement results as comparable as possible: hours actually worked (actual WT), hours paid for (paid WT), normal hours of work (normal WT), contractual hours of work (contractual WT), hours usually worked (usual WT), overtime hours of work (overtime), and absence from work hours (absence). The ILO further provides very detailed measurement instructions for each. For instance, the definition of actual WT is more than a page long (ILO Citation2008, 47–48), with references to productive activity, preparations for work, waiting, travel, on-call duty, trainings, in-between time, and resting time, as well as leave, commuting, education not intended for the economic unit, and longer breaks.
The various concepts can be divided into two groups. Definitions in the first group—usual WT, actual WT, overtime, and absence—refer to activities actually taking place, disregarding formal conditions, e.g., whether work is paid or formally registered. Two of these definitions need special attention: usual WT (which in most cases refers to a week and ignores irregular events, such as irregular overtime) and actual WT (which measures actual hours worked over a specific period, usually the week before the measurement, including all unexpected events, such as absenteeism and overtime). The second group—consisting of contractual WT, paid WT, and normal WT—includes more formal administrative definitions. These are related to official salaries and contracts, as well as norms in a region or an occupation, disregarding actual activities (e.g., whether someone actually worked during their paid WT).
It should be noted that no matter how accurate these definitions are in theory, in practice they are inseparable from the instruments used to measure them. In other words, measurement methods translate hypothetical definitions into practical ones. We use the term WT indicator for the combination of a WT definition and a measurement method.
WT measurement methods
There are four main approaches and a number of methods within them to obtain primary data on WT ().
Figure 1. How are WT data produced?
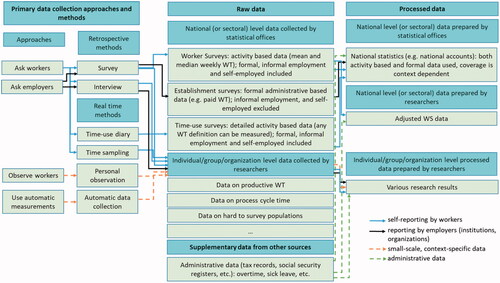
The first main approach involves asking workers about their WT. Within this approach, the most widely used method is the worker survey (WS) which uses retrospective questions to inquire about a specific time interval. WSs are widely applicable: most WT definitions can be measured and all types of workers, including self-employed and informal workers, can be involved. Participation is relatively easy for respondents and data collection through this method is generally inexpensive making it possible to ask numerous people simultaneously. WSs can be cross-sectional or longitudinal, so they are also suitable for investigating changes over time for individuals. The main limitations stem from errors in recalling, calculating, and reporting WT. The most reliable national-level data on weekly WT obtained by WSs come from the European Labour Force Survey (EU LFS) in Europe and the Current Population Survey (CPS) in the United States.
Aiming to address the limitations of WSs, another data-collection method relying on workers is the time diary (TD). Participants register what they are doing during the day, usually in 10-minute intervals. This provides data on all types of time use, including formal and informal WT, commuting, and leisure activities. The reliability of this method has been confirmed with wearable cameras and accelerometers that track physical movements (Gershuny et al. Citation2020). Since TD data covers all types of activities, WT according to any activity-based definition can be constructed. However, TDs are resource intensive. They require a significant commitment from respondents and rejection rates are generally high. Participants rarely register for more than one or two days. Therefore, this method tends to be used at the national level by combining the diary days of different individuals who share certain attributes (e.g., gender, age, family status, place of residence, income) into “synthetic weeks,” exploring broader patterns of time use. A less demanding time-use survey (TUS) to measure WT is a simplified TD called “work grid” (WG) in which respondents record for 15-minute time slots whether they worked or not.Footnote1 The most reliable national-level TUS data come from the Harmonized European Time Use Study (HETUS) in Europe and the American Time Use Survey (ATUS) in the United States.
Less common retrospective and real-time methods are qualitative interviews with employees and time-sampling studies, respectively. The advantage of interviews is flexibility, allowing data collection in almost any context. However, as interviews are rarely used to measure WT, there is little information on their data quality. In the case of time-sampling, respondents register their activities—and potentially a few other things, such as their mood—when a signal arrives. A large quantity of such momentary data is then used to calculate WT.
The second main approach is to ask employers about WT. Establishment-based surveys (ESs) are mostly used to measure WT according to formal, administrative definitions, such as paid work or contracted WT, based on official payrolls, leave papers, and so forth. Before national WSs were launched, WT data came almost exclusively from ESs, so they are indispensable for historical studies. The most reliable national-level data on formal WT come from the European Company Surveys (ECS) in Europe and the Current Employment Statistics (CES) in the United States.
The third main approach is observation by researchers which is the costliest procedure and tends to be used only in very specific cases. On-site observation may be necessary to estimate the productive WT of employees within an institution or to establish industrial standards.
The fourth main approach is to rely on data traces that workers leave behind and calculate WT from these. The simplest option is to gather administrative data, such as contracts, tax papers, and so forth. A more in-depth method is to mine digital data. Due to the diversity of contexts, measurement methods must be developed case by case.
In addition, primary data collected through the previously outlined methods can be used to calculate secondary WT values, such as averages for different groups. Statistical offices produce various aggregates, such as summations that are used in national accounts.
Methods
We had three main research questions, the first two of which required data collection:
Q1. What WT indicators are used in the literature?
Q2. What complexities stem from their definitions and methods and how is it possible to address them?
Q3. What are the implications for WTR research?
Answers to Q1 identify the most widely used definitions and methods. This is useful as these measures are likely to remain important—not only because of the persistence of certain advantages and disadvantages of particular indicators but also because of the drive toward standardization. Exploring Q2 then helps to use the definitions and measurement methods with awareness of their limitations. Finally, answers to Q3 summarize practical lessons for research on WTR, paying special attention to measurement strategies that address contemporary challenges and go beyond current standards.
To answer Q1, we conducted database searches with various combinations of keywords in Scopus. The strings (see Appendix A) were chosen according to the three main goals of WTR. We searched for phrases related to WT within the “Economics” subject area, finding articles on the relationship of WT with economic indicators, such as employment and productivity (WT-ECON). We combined the same WT phrases with expressions on well-being, finding articles on work-life balance and physical and mental health (WT-WB). For environmental articles, we relied on a recent systematic review (Antal et al. Citation2021) that combined the same WT-related search terms with expressions pertaining to the environment (WT-ENV). As our aim was to obtain a rough overview of the WT-ECON and WT-WB fields to complement the comprehensive but narrower picture of the WT-ENV area (consisting of 15 studies), we ranked the findings in terms of “relevance” in Scopus and considered the first 200 results. In addition, we used a search string focusing specifically on WTR, which generated 2,423 results.
We screened these 200 + 200 + 15 + 2,423 articles for relevance, starting with the titles and abstracts, then proceeding with the full texts. We included English language articles that looked at the relationship between WT and an economic/well-being/environmental indicator, relying on empirical WT data. This left 95 WT-ECON, 88 WT-WB, 15 WT-ENV, and 45 additional WTR studies.
For a total of 243 articles, we recorded WT definitions, data-collection methods, and the respective economic/well-being/environmental variables. As the articles often referred to external sources—for example, surveys and databases from which they took WT questions or values—we followed these routes to reach the exact definitions or sources. The result is a rough overview of the main definitions and measurement methods used in the literature. Although this is not a comprehensive or fully systematic review, the sample is appropriate to identify the main types of indicators used in these fields.
To answer Q2, we used a search query on WT measurement in the Scopus database, restricting the subject area to social sciences. This generated 1,088 articles. We screened the titles and abstracts, then the full texts, and identified 18 highly relevant articles focusing on WT measurement methods. Using these publications as a core set, we conducted multiple rounds of citation snowballing to find further relevant papers. Some of the resulting articles were highly relevant, while numerous others were informative but less central to our analysis. In the end, we worked with 45 methodological articles.
To answer Q3, we interpreted insights from the reviewed literature in light of the aims and challenges of WTR research. These discussions are relevant for the planning and evaluation of WTR trials.
Each methodological decision brought important limitations. First, the sample used to answer Q1 is not entirely systematic and not representative of any particular field. Therefore, findings are meant to be interpreted with caution. Only the broad patterns are likely to be meaningful, not the concrete numerical values that characterize our somewhat arbitrary sample. Second, the list of complexities may be incomplete. It is very difficult to properly define the area within which the methodological issues and their possible solutions are sought. The citation-snowballing method was used until we felt that the marginal value of further literature review was minimal, but multiple rounds of complete backward and forward analysis of citations were beyond the scope of this investigation. Third, our interpretations in Q3 could not cover all possible combinations of WT indicators, WTR types, and work contexts. As there are dozens of WT indicators and types of WTR and hundreds of different work contexts, the number of possible combinations is extremely high. Therefore, we tried to give relevant illustrative examples to inspire researchers who study specific cases.
Results and discussion
A diversity of indicators
Q1: A first observation is that a large number of WT definitions and measurement methods are used in the literature (). We identified at least 28 different types of indicators, not counting differences between question wordings and differences between reference periods.Footnote2 These indicators were produced using more than 10 different methods.
Table 1. WT indicators are found in the literature.
Q2: Indicator choice is crucial for at least two reasons. First, not all indicators are equally applicable for all purposes. This is sometimes obvious—for instance, national accounts provide little insight into individual well-being. Other times the difference can only be suspected as is the case between formal and actual WT. Regarding this disparity, Worrall and Cooper (Citation2014) report an average of 1.5 overtime hours a day for managers, which means 46 full days a year (with 8 hours per day). More recent reports from the grey literature offer even higher estimates (ADP Research Institute Citation2021). Similarly, actual WT rarely coincides with hours set by collective agreements or state legislation (Burgoon and Baxandall Citation2004).
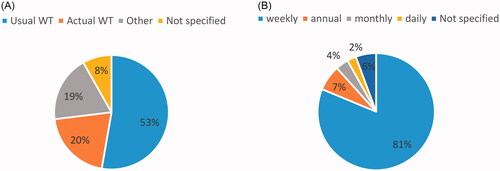
Figure 2. (A) Shares of WT definitions. (B) Shares of WT indicators by the reference period. Note. In 5–10% of the articles, it was not possible to clearly determine what definition was used.
Second, variations between seemingly similar indicators may be substantial. For example, actual WT according to WSs and ESs may be very different, especially for multiple job holders (Bluestone and Rose Citation1998). On one hand, as ESs are specific to establishments, a worker who has two part-time jobs of 20 hours per week each is registered at 20 hours, perhaps even twice. On the other hand, the WS registers 40 hours. Moreover, actual WT in ESs refers only to officially registered WT, so unpaid overtime, informal WT, and self-employed work are usually not measured. Therefore, actual WT tends to be significantly lower in ESs than WSs (Fleck Citation2009).Footnote3 Studying the same workers with the two methods, differences were above 10% in jobs where WT is less measurable (Abraham et al. Citation2013).Footnote4
Q3: Choosing the right indicator is often not straightforward, but no general rules can be given because there are dozens of ways in which WT can change, hundreds of different work contexts, and various potential research goals. In fact, the diversity of indicators is a response to this complexity. Since formal WT data rarely give a good approximation of the duration of work, activity-based indicators are almost always necessary to track progress toward WTR and to study its impacts. However, the direct influence of WTR policies will be on formal WT, so the analysis usually requires information on both.
Dominant definitions
Q1: The most dominant WT definitions are activity based: usual WT is followed by actual WT. In terms of the reference period of retrospective measures, weekly working time is by far the most common ().
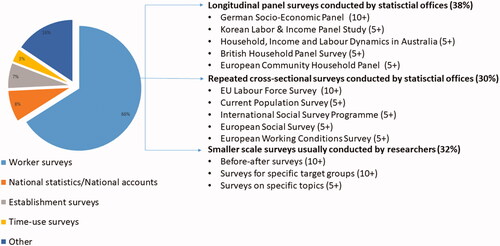
Figure 3. Shares of WT measurement methods. Note. The numbers in brackets next to the surveys on the right side of the figure are not percentages, but the absolute number of articles in our sample in which they were used.
Q2: The most commonly used WT definitions differ from each other. shows weekly usual and actual WT, collected from the same respondents in an LFS.
Table 2. Comparison of hours usually worked and hours actually worked, full-time employees, 2014 (Source: Eurostat Citation2018).
On average, usual WT was 11.8% higher (range: 1.2–18.8%) than actual WT in the European Union (EU) in 2014. Broader findings are similar: in all methodological papers, usual WT was higher than actual WT. This is mainly because of the difference between the definitions. Asked how many hours one usually works, people likely report the most common value, not the average. If the distribution is skewed, which is likely because downward divergence from the most common value is more characteristic than upward divergence, then the usual WT will be above average WT. This is particularly true for workers with long work weeks, as their WT distribution is likely to be more negatively skewed (Lin Citation2012). Similarly, if the social norm is that “more work is better,” then usual WT may be overreported, especially by workers with varied work schedules who do not have standard weeks and by workers who find such calculations difficult.
Another challenge is to use an appropriate reference period. If the period is short (e.g., a day), then the recall bias will generally be smaller, but the indicator will be less informative because longer periods show variation (workdays differ). If the period is long (e.g., a year), then retrospective measures will have a large recall bias. Therefore, longer-term WT data is more reliable if based on repeated data collection using shorter reference periods. This procedure is costly, explaining why weekly values are dominant and why longer-term data, such as annual values are generally produced by large organizations like national statistical offices. A noteworthy consequence is that we know much less about daily, annual, or lifetime WT than about weekly WT.
Q3: Despite its systematic distortions, usual WT will likely remain dominant for some time. It is meaningful for smaller groups of workers or a smaller number of data points than actual WT, which is crucial for smaller-scale case studies. It can provide information on past WT because it does not refer to a definite time period, which facilitates “before/after” WTR comparisons. And it is methodologically much less challenging to measure usual hours than actual hours for a long enough period to assess the impacts of WTR policies.
Nevertheless, current changes in the world of work, notably the unpredictability and fragmentation of WT in many jobs, make usual WT increasingly inadequate. To some extent, such problems can be mitigated by directing attention to non-work periods and overtime. In particular, asking about absences and overtime before total WT in WSs improves data quality for both usual and actual WT because respondents reflect more on irregularities (Eurostat Citation2018). In addition, a shift toward actual hours is a solution, even if this complicates measurements and works better for larger samples.
The characteristics of WTR schemes matter for the limitations of WT data using different reference periods. It is impossible to understand the causes or the long-term impacts of life strategies with a very long time horizon, for example, the reduction of WT after years of long hours with commonly used reference periods. Similarly, the effects of organization-level WTR schemes that increase the length of holidays are often missed by activity-based definitions focusing on weekly hours, which underlines the complementary role of formal WT data or questions focusing on holidays. Variable work schedules also call for the use of annual WT. When weekly hours are adequate, then keeping their limitations in mind is key. For instance, reductions from long weekly hours may significantly reduce the bias of usual WT, so reductions may appear larger than they are.
Dominant methods
Q1: By far the most dominant WT measurement method is the WS. The most commonly used data sources are national household-based surveys (e.g., LFS, CPS). WSs are followed by national statistics, establishment surveys, time diaries, and other methods ().
Figure 4. Causes of large WS errors.
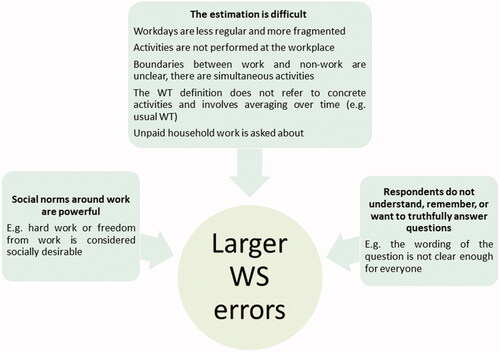
Q2: Worker surveys: Answers to questions like “How many hours per week do you usually work?” or “How many hours did you work last week?” may not always reflect actual behavior. In the United States, respondents spend about 3–10 seconds to answer such questions (Robinson, Chenu, and Alvarez Citation2002). For many people, this is probably not enough to accurately interpret the question and provide a reliable answer (Walthery and Gershuny Citation2019). After all, interpretations of “work” may not be consistent, people may not remember all work episodes, and may not be able to properly add them up, and calculating averages over a time period is even more difficult. The measurement of WT in surveys may be affected by random errors arising from unclear questions or the loss of respondents’ motivation, and systematic errors stemming from incorrect or biased evaluations of the length of work and non-work activities (Niemi Citation1983, Citation1993; Robinson and Bostrom Citation1994; Carrasco and Domínguez Citation2015). shows when errors tend to be larger.Footnote5
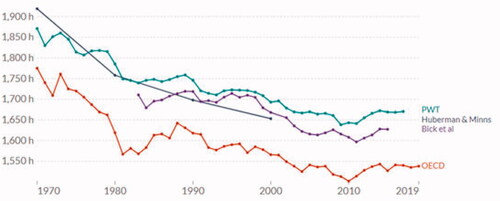
Figure 5. Differences between compiled WT indicators using diverse denominators: the example of annual working hours per worker in the United Kingdom. Source: Giattino, Ortiz-Ospina, and Roser (Citation2020) and adapted from Our World in Data (https://ourworldindata.org/working-hours). Note. OECD data (OECD Citation2020) refers to average annual hours actually worked per worker; Penn World Table (PWT) data (Feenstra, Inklaar, and Timmer Citation2015) refers to average annual hours worked by persons engaged; Bick et al. data (Bick, Brüggemann, and Fuchs‐Schündeln Citation2019b) refers to average annual hours worked per employed person; Huberman and Minns data (Huberman and Minns Citation2007) refers to annual hours of full-time production workers (male and female) in nonagricultural activities.
A consistent finding, and likely the largest source of bias, is that people reporting WT well above the average tend to overreport (especially females) while people reporting WT well below the average tend to underreport (especially males) (Frazis and Stewart Citation2004; Bonke Citation2005; Walthery and Gershuny Citation2019). The larger the difference from the average, the larger the bias tends to be. Regarding other factors, the biggest difference between WS and TD data is usually for atypical workers including the self-employed, agricultural workers, people working from home, people who have many unsocial working hours, and time-squeezed women (Eldrige and Pabilonia Citation2007). Respondents who feel tensions between work and home life and people who more frequently do several things simultaneously tend to overestimate paid hours. Absences and breaks are not always appropriately deducted, so individual WT is more often higher than lower in WSs compared to TDs (e.g., Frazis and Stewart Citation2014; Kan and Pudney Citation2008). Social norms may also partly explain why women tend to overstate market work while men overstate non-market work.
The calculation of average actual WT from WSs brings new sources of errors. For instance, the most widely used labor-force surveys significantly underestimate the number of days off and sick leave in most countries, which leads to a general overestimation of actual WT by WSs. This is because respondents who did little work the previous week often deny responses or talk about normal weeks instead, workers with zero hours are often excluded from the sample (Wingender Citation2018), and in many countries, there is seasonality in data collection (e.g., the Christmas week is not sampled (Bick, Brüggemann, and Fuchs‐Schündeln Citation2019b) or the sample sizes for certain weeks are small (Frazis and Stewart Citation2014).Footnote6 In the EU, using the average of LFS microdata over all 52 weeks has been shown to overestimate the number of workweeks by 7.5% (by missing 3.4 vacation weeks), with significant differences between countries (Bick, Brüggemann, and Fuchs‐Schündeln Citation2019b).
The magnitude of the difference between WS data and TDs (or WGs or calculated WT) was studied in a number of the articles that we reviewed, usually yielding differences of up to 10–30%, with substantial variations between groups of workers (Appendix B).
Establishment surveys
Data ased on ESs are usually limited to formal definitions of WT, notably paid or contractual hours. ESs also lack the data necessary for micro-analysis, such as the socio-economic status of the workers, and getting such data is often difficult or impossible for reasons of confidentiality (Bonke Citation2005). Since ESs give preference to larger firms and formal employment, employees of smaller firms, the self-employed, and informal workers are typically excluded from the sample (Messenger, Lee, and McCann Citation2007; Bick, Fuchs-Schündeln, and Lagakos Citation2018). As a result of these limitations, ESs are usually applied only as complementary sources of information in the social sciences (Abraham et al. Citation2013; Bick, Fuchs-Schündeln, and Lagakos Citation2018; Ohanian and Raffo Citation2012).
National statistics and national accounts
National accounts (NA) are a large subset of national statistics that use a variety of sources to consistently summarize the economic activities of a country. These accounts include data on WT, which are calculated in country-specific ways. Relying on national accounts and making further adjustments, international databases contain time series for WT covering many countries. The most frequently applied sources are the database assembled by the Organization for Economic Co-operation and Development (OECD) and the Total Economy Database (TED), the latter of which also serves as a basis for the Penn World Tables (PWT). For the EU, even more detailed data (e.g., sectoral WT) are available from the EU Klems database.
Such “compiled” indicators have their own issues. To begin with, for the calculation of an average per capita WT at the national level, a reference group must be chosen, which will serve as the denominator variable. Average WT may then refer to the whole population, a reasonable age group, the working population, or a subset of the working population (e.g., the formally employed or nonagricultural workers).
Statistical offices must also decide what data they take as a starting point: some use WSs while others use ESs. Subsequent methodological decisions are about adjustments, such as correcting inaccuracies stemming from absences and overtime hours (Wanger, Weigand, and Zapf Citation2016). While certain data are available almost in real-time (e.g., sick leave), others have a considerable time lag and sampling errors, so they often appear as estimates (e.g., data on secondary jobs from household surveys).
Despite various attempts at standardization, the latest empirical research suggests that NA data are not suitable for international calculations in which the exact level of WT is required (e.g., for productivity comparisons). Thus, the mentioned databases only allow the identification of WT trends within a specific country (Fuchs-Schündeln Citation2019; Ohanian and Raffo Citation2012; Wingender Citation2018).Footnote7 For international comparisons, it is more promising to use adjusted WS data (e.g., starting from standardized LFSs) than national statistics (Bick, Fuchs-Schündeln, and Lagakos Citation2018).
Wingender (Citation2018) found that NA data based on ESs are generally lower than data based on WSs (actual WT from LFSs).Footnote8 As the example in shows, values in different data sources can easily differ by 10%. Furthermore, OECD and TED data have been substantially revised over time: WT values for the same countries in the same years could change by more than 10% (Bick, Brüggemann, and Fuchs‐Schündeln Citation2019a).
Figure 6. The share of articles considering non-market WT.
Time diaries
TD is considered to be almost statistically unbiased for measuring activity-based WT. Despite the fact that recall bias and the impact of social desirability are not ruled out entirely, they are assumed to be very modest—in fact, they are not even quantified (Kan and Pudney Citation2008). TD data is more reliable for regularly occurring activities than for irregular ones (e.g., market work as opposed to irregular overtime) because the reference period of TUSs is typically one or two days (Juster, Ono, and Stafford Citation2003). The accuracy of aggregated TD data can be improved in two ways: by increasing the sample size and by increasing the length of data collection for each participant. The former is appropriate if aggregate WT levels and distributions between socio-economic groups are investigated, while the latter helps if longer-term behaviors of the same persons or households are studied.
TUS-data collection and analysis require large investments and this feature has strongly limited the availability of TD data until recently.Footnote9 National statistical offices only carry out large-scale TUSs every few years and the TD method is also very burdensome for participants (Chatzitheochari et al. Citation2018), especially in the case of multi-day diaries. For weekly diaries, response rates of around 30% are considered very high (Robinson et al. Citation2011). Nevertheless, several experts stress the need for more weekly diaries to make TD data more comparable with data from other measurement methods using longer reference periods (Kan and Pudney Citation2008; Robinson et al. Citation2011; Sullivan and Gershuny Citation2018). This procedure is easier if market WT is in the focus and the WG method is used (Robinson, Chenu, and Alvarez Citation2002), which, however, is rare in the literature.
Interviews
Interviews allow workers to clarify interpretations, so more consistent data can be obtained than with any other retrospective method. Any WT definition and reference period can be studied. The main drawback is that conducting and analyzing interviews for large samples is very expensive, and findings cannot be generalized.
Time-sampling
Time-sampling methods gather data in real-time, but not continuously. Participants report their activities at specific points in time during the day, usually triggered by a beeper or a smartphone application. As postponing responses is not allowed, the recall bias is negligible but many answers—around 25% according to some analysts (Jeong Citation2005)—tend to be missing. Because the length of activities is not measured, a large number of data points is required to accurately measure WT in smaller groups. While the method is hardly applicable at the individual level, it is an option for groups above 30–50 workers, depending on the frequency of measurements per participant (Sonnenberg et al. Citation2012; van Hassel et al. Citation2017).
Personal observation
Direct personal observation eliminates the subjectivity of respondents from the data. However, it is an intrusive procedure, which may alter the behavior of the subjects—this is known as the Hawthorne effect (Guarisco, Oddone, and Simel Citation1994). It is also very expensive to train observers, and it is not guaranteed that even a well-trained observer will be able to accurately identify all work activities (Oddone et al. Citation1995). Finally, it is difficult to apply this method for people with irregular or unsocial working hours, and for mobile or remote work.
Automatic measurements
Automatic measurements—for example, by smart cards and digital timers—are usually designed to measure productive WT excluding any slack time and breaks (Collewet and Sauermann Citation2017). Most types of automatic measurements are limited to highly standardized workplaces like industrial facilities, call centers, or supermarkets (Hodder Citation2020), and to digital work like software development. These measurements are not perfect either: time spent on non-measurable but possibly work-related activities (e.g., thinking) are often missed, while some non-work activities may appear as work.
Portable and wearable automatic devices, such as mobile phones providing global positioning system (GPS) data, accelerometers, and wearable cameras—can be more precise and more applicable for various types of work, but some technological barriers persist (Elevelt et al. Citation2021) and using them for larger samples is not always feasible (Gershuny et al. Citation2020). Furthermore, while these tools may seem to provide objective data, the Hawthorne effect is likely to be very strong because participants are aware of being constantly monitored.
Q3: Depending on the aims of a WTR study, the limitations of different methods will matter. We highlight some of these complications and their potential solutions, which we expect to be particularly important in future research.
White-collar workers with long WT could be a prime target of WTR efforts: they can afford uncompensated reductions and for them the marginal benefit of additional free time is high. However, their WS data are often highly distorted. To mitigate these distortions, repeated surveys of actual hours can be used instead of the usual WT. In addition, separate questions can be asked about WT variability, then people with highly variable or very long WT can be treated separately. If the number of such participants is small, interviews work well. If the number is larger, then WGs may be appropriate. If the fragmentation of WT makes even the 15-minute periods of the WG too long for accurate reporting (Jett and George Citation2003; Wajcman and Rose Citation2011; Chen and Karahanna Citation2018; Puranik, Koopman, and Vough Citation2020) or the WG is too burdensome, then time-sampling is an option. Regardless of the method, pre-measurement interviews are useful to explore context-specific problems of WT measurement.
As WT values according to different measurement methods can differ by 10–30%, and most reduction schemes affect WT by a similar amount, using two different methods before and after WTR is a mistake. In the case of smaller changes in WT, smaller samples, and more uncertain methods, cautious interpretation is advised. Whether pre-WTR and post-WTR measurement errors are likely to differ should be qualitatively assessed by going through the main biases. In particular, the distribution of working hours and the level of time squeeze may change perceptions of working time (Carrasco and Domínguez Citation2015), so changes in these deserve attention.
For methods with a strong Hawthorne effect, it is important to emphasize that various work vs. leisure preferences can be sensible. In addition, exploring individual norms may help to assess whether data are more likely to be distorted upwards or downwards.
For studies relying on aggregate data, such as many environmental papers that investigate the time series of WT and annual resource use or emissions, it is better to use internationally consistent data (e.g., Bick, Brüggemann, and Fuchs‐Schündeln Citation2019b). When cross-country comparisons are only used to contextualize or interpret research findings, then the risk of misusing aggregate data sources is even higher because authors rarely dig into the details for a few introductory or interpretative comments. Therefore, the OECD should replace its cross-country bar chart with one showing trends over time on its main page (OECD Citation2022).
Precise indicators
Q1: Most articles use data from WSs that simplify complex WT definitions into one or two short sentences. More detailed instructions may be given to interviewers: for instance, the EU LFS question on actual hours is one line long while the explanatory notes fill a page (Eurostat Citation2016), but it is unlikely that many respondents inquire about these instructions.
A substantial number of papers do not report WT indicators properly and definitions are confused or missing. The WT-WB literature is the least precise, followed by WT-ENV, while the WT-ECON literature is the most precise, usually giving indicators in full.
Q2: Classifying activities as work or non-work and defining the breaks to be excluded for all types of jobs would require very detailed descriptions in self-reported measurements. This may not be feasible for larger, more diverse samples.
A traditional issue is how lunch breaks are treated. Even 30-minute lunch breaks make up more than 6% of average daily hours in most countries. This adds up to 120 hours a year, or 15 full days (with 8 hours per day), so differences of this magnitude deserve attention. A related question is about longer coffee breaks, which may or may not serve work purposes (Dupre and Lallement Citation2007). Today, questions about the boundaries of WT are especially relevant as creative tasks gain importance, people increasingly work from home, and breaks become increasingly irregular (Messenger and Gschwind Citation2016; Feng and Savani Citation2020; Hodder Citation2020). This leads to the question of whether traditional WT or productive WT is more relevant (Collewet and Sauermann Citation2017). The answer depends on the focus of the analysis (e.g., well-being, environmental, or economic impacts).
Q3: There are at least three lessons for WTR. First, the precision of WT definitions and the feasibility of primary data collection must be balanced against each other. Most importantly, survey questions can be too short and not precise enough, or too long and exhausting for respondents. The optimum depends on the research context.
Second, in the case of smaller (or slower) changes in WT, as well as for statistical analyses, precision is particularly important. Self-reported survey data or aggregate WT values may be too crude for such purposes. If other types of data are not available, then a very serious limitation must be acknowledged.
Finally, the length of breaks and overtime may change as a result of WTR. This means that activity-based WT definitions must be precise enough to measure these periods. One type of WTR receiving a great deal of media attention is when workers complete the same tasks in less time (e.g., four days) and continue to get the same salary.Footnote10 While traditional WT decreases substantially, productive WT may be unchanged. If neither production nor total consumption changes significantly, then economic, environmental, and well-being effects may be smaller than with reductions of productive WT. Exploring how productive WT or the amount of output change is thus useful beyond measuring traditional WT. Obviously, this is more important if productive WT or output are weakly linked to traditional WT.
Non-market work
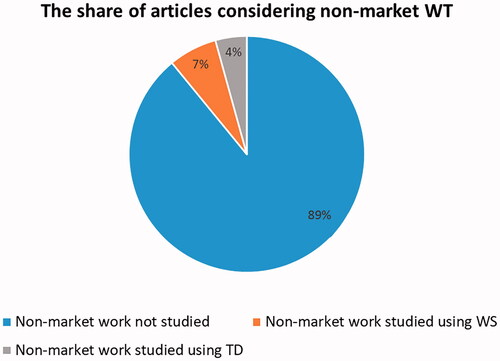
Q1: Non-market or household (including care) work has a huge impact on the well-being of individuals (Steptoe et al. Citation1998; Rotenberg et al. Citation2008; Boye Citation2011; Kamerāde et al. Citation2019) and potentially also on environmental impacts and the living standards of households (Boeri, Burda, and Kramarz Citation2008). If services provided by non-market work in one household are paid for in another, then the same household income results in different discretionary spending (Folbre Citation2020). Furthermore, despite recent convergence, household WT is still unequally shared by men and women, so it is crucial from a gender perspective (Gershuny et al. Citation2020). In other words, ignoring household work, as most statistics do, is misleading from the perspectives of both welfare and well-being. Yet non-market WT receives little attention in the reviewed literature (). Studies that do consider household and other forms of non-monetized work use TDs more often than for market work.
Q2: As there are no administrative records and neither automatic data collection nor direct observation are practically feasible, the length and distribution of non-market WT can only be asked directly from the workers (or other household members). However, there are no international standards to define household WT. As a result, various interpretations co-exist, for example, childcare may be included (Sayer and Gornick Citation2012) or excluded (Berik and Kongar Citation2013). This disparity greatly reduces the reliability of survey data and the validity of comparisons. Moreover, household WT is usually constituted by several short episodes, often carried out simultaneously with other activities, thus retrospective data on household WT is highly unreliable and controversial. One study found household WT to be 36% lower in a WS than in a TD (Bonke Citation2005), while many others found the opposite result (e.g., WS values have been reported in some cases to exceed TD values by 100% (Robinson et al. Citation2011), by 70% for men and 30% for women (Juster, Ono, and Stafford Citation2003), and by 56% for men and 50% for women (Marini and Shelton Citation1993) in different contexts). Note that even TD data are sometimes controversial—for instance, coding childcare at night is a challenge (Kitterød and Pettersen Citation2006).
Q3: When market work is reduced, non-market work often changes substantially. Whether this happens is a key question for WTR studies: it matters for well-being and determines changes in time use, with a strong impact on the composition of consumption. Some authors envisage downshifters engaging in eco-friendly non-market work (e.g., Nørgård Citation2013; Schor Citation2010), while others contend that polluting activities like travel will dominate (Lindsay, Lane, and Humphery Citation2020). Therefore, information on non-market WT is necessary to assess the individual and social desirability of WTR.
As WSs are so unreliable, researchers have proposed TDs and interviews as approaches for measuring non-market WT (Niemi Citation1993; Juster, Ono, and Stafford Citation2003; Robinson et al. Citation2011). If this is not possible, then question wording is key for clarity and congruent answers (Schulz and Grunow Citation2012). In particular, asking about separate activities like cooking, shopping, and cleaning is preferable to aggregated questions on total household WT over a longer reference period. If gender issues are investigated, then asking about the percentage shares of various activities is also a good idea.
Levels of analysis and a web of working times
Q1: Most articles (∼80% in our sample) use WT data of one or more countries from large representative surveys, focusing exclusively on the national level. These surveys usually register the WTs of all members of a household, but they are generally not longitudinal and do not measure non-market WT. Substantially fewer papers deal with lower levels, such as sectors, companies, or households. Among lower-level investigations, studies on the medical sector are dominant (>50%). The overwhelming majority of articles focus on the WTs of particular individuals or groups, treating them as separate, non-interacting entities.
Q2: If WT patterns or dynamics are to be broken down by groups, then national level studies are constrained by the availability of data on respondents. Information on job and family contexts will often be too crude to compare groups of interest (e.g., managers and professionals) or to control for relevant variables (e.g., personal values). Furthermore, statistical models can easily become too complex to have real explanatory value, mainly because so many variables influence WT.
Furthermore, the WTs of individuals, groups, and even nations strongly influence each other, like interconnected nodes in a network (Gerstel and Clawson Citation2018). Within households, the WTs of partners interact, for example, through the sharing of household work. This has been studied in a few contexts (Kitterød and Pettersen Citation2006; Presser Citation2006; Xu et al. Citation2019), but the results are too general to be informative for specific changes in WT. How WTR will affect partners’ (or other household members’) WT is thus usually unpredictable.
Other interactions, for instance between colleagues due to substitution or complementarity and between companies due to competition or supply-chain effects, are almost entirely unknown. Such interactions depend on the state of the economy (e.g., whether newly hired workers were previously employed). Changes in opening hours can also influence time use in broader communities (Anttila, Nätti, and Väisänen Citation2005).
Finally, even countries may have WT interactions. Reductions in one country that affect production, exports, or imports may affect WT abroad. These interactions depend on international power relations, which partly explains why people in poor countries do so much more paid work (Bick, Fuchs-Schündeln, and Lagakos Citation2018). Paying attention to WT leakage is thus important from a justice perspective.
Q3: Due to numerous smaller, non-collective WTR programs running today, individual, household, and firm-level studies are increasingly relevant. This requires primary data collection by researchers in various contexts.
Direct effects of WTRs are easier to describe than indirect ones because “[c]hanges in any given individual’s time create a cascade across other people, organizations, and institutions” (Gerstel and Clawson Citation2018, 80). There is no methodological tradition to reliably quantify such effects. This limits the types of conclusions that can be reached regarding the overall effects of WTR.
To address this limitation, relevant interactions should be identified. This often requires 1) focusing on the combined work schedules of family members and 2) looking at total WT at organizations by investigating the number of people employed as well as the number of hours worked by employees, and 3) considering the state of the macroeconomy.
In most cases, only theoretical speculation and interviews are feasible to explore situations. A more detailed checklist of issues and corresponding methods of analysis, as well as reasons for which expectations about understanding the web should be tempered, are given in Appendix C.
Development of WT measurement over time and steps forward
Q1: Unlike many fields of social science that have been revolutionized by digitalization and large datasets, changes in WT measurement and analysis have been incremental. WSs, first used in 1909, are still dominant (Pencavel Citation1986). So, despite developments in the measurement of well-being (e.g., smart tools supplying physiological data), environmental impacts (e.g., advances in input-output modeling), and economic effects (e.g., the radically increased availability of transaction data), the WT-WB, WT-ENV, and WT-ECON relationships are still difficult to study. While WT definitions and sampling strategies were improved and standardized and electronic data collection spread, the world of work has changed so much that the overall reliability of WT data has likely decreased (Robinson and Bostrom Citation1994; Robinson et al. Citation2011; Walthery and Gershuny Citation2019).
Q2: WT measurement developed insufficiently mainly because of the exploding diversity of work activities and job types compared to the industrial age. While several well-being, environmental, and economic indicators can be measured in a uniform way (e.g., heart rates, emissions, or credit-card transactions), this is impossible with WT. In fact, aggregating all types of activities in a single WT makes little sense for certain types of jobs. For physicians and other medical personnel, sleeping during on-call time is clearly different from treating patients, with large impacts on well-being and non-work time use, so the shares of these activities are crucial. Neither of these activities are comparable to the fragmented work of a researcher who may have new ideas while engaging in sports. So, WT data are not necessarily informative without the measurement of intensity and productivity. This is more challenging for individualized, flexible, and creative work than for industrial jobs where intensity is externally determined. As noncreative work is increasingly mechanized, ongoing specialization brings new work activities, and working from home spreads, the trend is toward poor measurability.
Q3: From a WTR perspective, the situation is challenging. Subnational case studies, including most current trials and schemes worthy of investigation (NEF Citation2022), require case-specific measurements, preferably with high precision. Yet, changes in WT will appear to be different depending on the indicator. As no definition or method is universally applicable, context-specific indicators have to be developed. This will make pre-WTR/post-WTR comparisons more meaningful, while also making comparisons between jobs, and aggregate data, less relevant.
As for measurement tools, interviews, WGs, relying on digital traces, and time-sampling can be expected to gain importance as opposed to WSs. Recognizing the complexities of measurements, researchers should develop interview guides. For WGs, smart and user-friendly registration tools hold the potential to reduce respondent burden and rejection rates (Chatzitheochari et al. Citation2018). For digital traces, the key is careful interpretation, which will be context-specific and not always straightforward, causing divergence between indicators for different jobs. For time-sampling, one could imagine participants registering percentage values expressing the extent to which their current activities can be classified as work: often 0 or 100%, but sometimes values in between, potentially with an option to switch on a default answer (e.g., 0% while sleeping). For larger samples or longer sampling periods, this could be one of the most widely applicable methods, and a rare option to measure very fragmented workdays.
gives a summary of the main practical lessons that have been covered above. Awareness of these complexities and the potential ways in which they can be addressed helps to move forward in the field of WT measurement. This is essential to learn from WTR trials and to facilitate their successful implementation.
Table 3. Main dilemmas of WT measurement and approaches to address them.
Conclusion
The world of work has been radically transformed over the last few decades, and the speed of change has only increased with the COVID-19 pandemic. New WT patterns are emerging with flexible, location-independent, and more fragmented working hours, to which the methodology of WT measurement has not yet been fully adapted. This article reviewed how these challenges are addressed in the literature, discussed the complexities, and drew conclusions for WTR research. To properly monitor and evaluate the impacts of the various WTR schemes and trials emerging around the world, WT measurement would have to satisfy several conditions. Ideally, indicators would refer to the same workers before and after the change (like repeated interviews), refer to a longer time period (like usual WT in WSs), be reliable (like personal observation), accurately measure even short periods of work (like time-sampling), and provide data in real time (like automatic measurements). In addition, the method should be able to measure non-market work (like TDs), allowing the calculation of various types of WT over the chosen groups of workers, large or small, independent of work context, also considering indirect effects. And all this should come at a reasonable cost without overburdening subjects.
As no such method exists, the approach and indicator must be selected by experts who analyze WT from a wide range of options reviewed in this article. The optimal solution will depend on the work context, the type of WTR, and the research goals, which collectively yield thousands of combinations (). In more traditional cases, the currently dominant indicator—usual WT measured by WSs—may still be practicable. However, current trends limit the scope of its application, requiring other definitions, notably actual WT, productive WT, and non-market WT, as well as other measurement methods, such as TDs, WGs, interviews, automatic measurements, and time-sampling.
If new indicators gain ground, the comparability of WT data between contexts will be diminished. This is a cost to be paid for optimizing between accuracy and feasibility on a case-by-case basis. The benefit is that context-specific indicators will make the analysis of trends over time at lower levels more meaningful, which is crucial for the future of WTR research. The divergence of WT indicators calls for indicator-specific standards regarding WT definitions and data-collection methodology. In addition, careful reporting will be inevitable to avoid confusion stemming from seemingly small, but often quite important differences discussed in this article.
Finally, we propose a method that combines time-sampling with a scale to indicate the extent to which activities at the moment of receiving the signal could be considered work. This approach could be used for a variety of contexts including the fragmented work of atypical and creative workers. With two scales, market and non-market WT could be measured simultaneously, using context-specific definitions discussed before data collection. This could be a large step toward reducing uncertainties around unpaid overtime and toward a better understanding of WTR impacts at the household level.
Disclosure statement
No potential conflict of interest was reported by the authors.
Notes
1 Work grids are sometimes called work-schedule calendars.
2 For example, “How many hours do you work in a typical week” and “How many hours do you actually work per week?” both referring to usual hours, as well as “usual weekly hours” and “usual daily hours.”
3 When administrative sources report actual WT, those values tend to be the lowest (Fleck Citation2009).
4 Not all definitions are equally sensitive to methodological differences. The definitions of formal WT indicators are more permanent and objectively verifiable than activity-based definitions, which still differ from each other. It may not make a large difference whether the question “How many hours do you usually work in a week?” is asked in a survey or an interview. More questions arise in the case of actual WT, which refers to a shorter and more definite period.
5 Compared to TD values. We note that no perfect method exists, so every comparison is, to some extent, questionable (Frazis and Stewart Citation2014).
6 This is especially relevant for historical data. Current sample sizes are less uneven. A smaller limitation for the international comparability of LFS data is that even if sampling strategies were uniform over the countries, their seasonality would cause cross-country differences because of the uneven distribution of vacation days over the year (Bick, Brüggemann, and Fuchs‐Schündeln Citation2019a).
7 Yet they are (mis)used in several reviewed papers for international comparisons.
8 This explains, for instance, why Germany appears to have very low annual WT values in certain comparisons (e.g., the OECD database). The country’s calculations start from ES values.
9 For a recent description of harmonized TD data and an overview of methodological changes that enabled international comparisons, see Cornwell, Gershuny, and Sullivan (Citation2019).
10 There are many recent examples from some the best-known news sources (Simpson Citation2022; Nova Citation2021; Joly Citation2022).
References
- Abraham, K., J. Haltiwanger, K. Sandusky, and J. Spletzer. 2013. “Exploring Differences in Employment between Household and Establishment Data.” Journal of Labor Economics 31 (S1): S129–S172. doi:10.1086/669062.
- ADP Research Institute 2021. People at Work 2021: A Global Workforce View. Roseland, NJ: ADP Research Institute.
- Antal, M. 2014. “Green Goals and Full Employment: Are They Compatible?” Ecological Economics 107: 276–286. doi:10.1016/j.ecolecon.2014.08.014.
- Antal, M., and J. van den Bergh. 2016. “Green Growth and Climate Change: Conceptual and Empirical Considerations.” Climate Policy 16 (2): 165–177. doi:10.1080/14693062.2014.992003.
- Antal, M., B. Plank, J. Mokos, and D. Wiedenhofer. 2021. “Is Working Less Really Good for the Environment? A Systematic Review of the Empirical Evidence for Resource Use, Greenhouse Gas Emissions and the Ecological Footprint.” Environmental Research Letters 16 (1): 013002. doi:10.1088/1748-9326/abceec.
- Anttila, T., J. Nätti, and M. Väisänen. 2005. “The Experiments of Reduced Working Hours in Finland.” Community, Work & Family 8 (2): 187–209. doi:10.1080/13668800500049704.
- Berik, G., and E. Kongar. 2013. “Time Allocation of Married Mothers and Fathers in Hard Times: The 2007–09 US Recession.” Feminist Economics 19 (3): 208–237. doi:10.1080/13545701.2013.798425.
- Bick, A., B. Brüggemann, and N. Fuchs-Schündeln. 2019a. “Data Revisions of Aggregate Hours Worked: Implications for the Europe-U.S. Hours Gap.” Review 101 (1): 45–56. doi:10.20955/r.101.45-56.
- Bick, A., B. Brüggemann, and N. Fuchs‐Schündeln. 2019b. “Hours Worked in Europe and the United States: New Data, New Answers.” The Scandinavian Journal of Economics 121 (4): 1381–1416. doi:10.1111/sjoe.12344.
- Bick, A., N. Fuchs-Schündeln, and D. Lagakos. 2018. “How Do Hours Worked Vary with Income? Cross-Country Evidence and Implications.” American Economic Review 108 (1): 170–199. doi:10.1257/aer.20151720.
- Bluestone, B., and S. Rose. 1998. “The Macroeconomics of Work Time.” Review of Social Economy 56 (4): 425–441. doi:10.1080/00346769800000043.
- Boeri, T., M. Burda, and F. Kramarz, eds. 2008. Working Hours and Job Sharing in the EU and USA: Are Europeans Lazy? Or Americans Crazy? Oxford: Oxford University Press.
- Bonke, J. 2005. “Paid Work and Unpaid Work: Diary Information versus Questionnaire Information.” Social Indicators Research 70 (3): 349–368. doi:10.1007/s11205-004-1547-6.
- Bosch, G., and S. Lehndorff. 2001. “Working-Time Reduction and Employment: Experiences in Europe and Economic Policy Recommendations.” Cambridge Journal of Economics 25 (2): 209–243. doi:10.1093/cje/25.2.209.
- Boye, K. 2011. “Work and Well-Being in a Comparative Perspective – The Role of Family Policy.” European Sociological Review 27 (1): 16–30. doi:10.1093/esr/jcp051.
- Burgoon, B., and P. Baxandall. 2004. “Three Worlds of Working Time: The Partisan and Welfare Politics of Work Hours in Industrialized Countries.” Politics & Society 32 (4): 439–473. doi:10.1177/0032329204269983.
- Carrasco, C., and M. Domínguez. 2015. “Measured Time, Perceived Time: A Gender Bias.” Time & Society 24 (3): 326–347. doi:10.1177/0961463X14538917.
- Chatzitheochari, S., K. Fisher, E. Gilbert, L. Calderwood, T. Huskinson, A. Cleary, and J. Gershuny. 2018. “Using New Technologies for Time Diary Data Collection: Instrument Design and Data Quality Findings from a Mixed-Mode Pilot Survey.” Social Indicators Research 137 (1): 379–390. doi:10.1007/s11205-017-1569-5.
- Chen, A., and E. Karahanna. 2018. “Life Interrupted: The Effects of Technology-Mediated Work Interruptions on Work and Nonwork Outcomes.” MIS Quarterly 42 (4): 1023–1042.
- Cieplinski, A., S. D’Alessandro, and P. Guarnieri. 2021. “Environmental Impacts of Productivity-Led Working Time Reduction.” Ecological Economics 179: 106822. doi:10.1016/j.ecolecon.2020.106822.
- Collewet, M., and J. Sauermann. J. 2017. “Working Hours and Productivity.” Social Science Research Network, No. 10722.
- Cornwell, B., J. Gershuny, and O. Sullivan. 2019. “The Social Structure of Time: Emerging Trends and New Directions.” Annual Review of Sociology 45 (1): 301–320. doi:10.1146/annurev-soc-073018-022416.
- D’Alessandro, S., A. Cieplinski, T. Distefano, and K. Dittmer. 2020. “Feasible Alternatives to Green Growth.” Nature Sustainability 3 (4): 329–335. doi:10.1038/s41893-020-0484-y.
- de Spiegelaere, S., and A. Piasna. 2017. The Why and the How of Working Time Reduction. Brussels: European Trade Union Institute.
- Dupre, M., and M. Lallement. 2007. “Regulation of Working Time in SMEs of the Information and Communication Technology Sector in France.” New Technology, Work and Employment 22 (1): 66–82. doi:10.1111/j.1468-005X.2007.00184.x.
- Eldrige, L., and S. Pabilonia. 2007. “Are Those Who Bring Work Home Really Working Longer Hours? Implications for BLS Productivity Measures.” SSRN Electronic Journal 406: 1–48. doi:10.2139/ssrn.985357.
- Elevelt, A., W. Bernasco, P. Lugtig, S. Ruiter, and V. Toepoel. 2021. “Where You At? Using GPS Locations in an Electronic Time Use Diary Study to Derive Functional Locations.” Social Science Computer Review 39 (4): 509–526. doi:10.1177/0894439319877872.
- Eurostat. 2016. EU-LFS Explanatory Notes from 2016 Onwards. Brussels: European Commission.
- Eurostat. 2018. Quality Issues regarding the Measurement of Working Time with the Labour Force Survey (LFS). Brussels: Eurostat.
- Feenstra, R., R. Inklaar, and M. Timmer. 2015. “The Next Generation of the Penn World Table.” American Economic Review 105 (10): 3150–3182. doi:10.1257/aer.20130954.
- Feng, Z., and K. Savani. 2020. “Covid-19 Created a Gender Gap in Perceived Work Productivity and Job Satisfaction: Implications for Dual-Career Parents Working from Home.” Gender in Management 35 (7–8): 719–736. doi:10.1108/GM-07-2020-0202.
- Fleck, S. 2009. “International Comparisons of Hours Worked: An Assessment of the Statistics.” Monthly Labor Review 132 (5): 3–31.
- Folbre, N. 2020. What is Work? What Counts as Work and What Doesn’t? New York: Institute for New Economic Thinking.
- Frazis, H., and J. Stewart. 2004. “What Can Time-Use Data Tell Us about Hours of Work?” Monthly Labor Review 127 (12): 3–9.
- Frazis, H., and J. Stewart. 2014. “Is the Workweek Really Overestimated?” Monthly Labor Review 137 (6): 1–15. doi:10.21916/mlr.2014.21.
- Fuchs-Schündeln, N. 2019. “Hours Worked across the World: Facts and Driving Forces.” National Institute Economic Review 247 (1): R3–R9. doi:10.1177/002795011924700110.
- Gershuny, J., K. Fisher, J. Robinson, and S. Martin. 2007. “Workweek Estimate-Diary Differences and Regression to the Mean.” Unpublished manuscript. http://www.atususers.umd.edu/wip2/papers_i2007/Gershuny_Martin.pdf
- Gershuny, J., T. Harms, A. Doherty, E. Thomas, K. Milton, P. Kelly, and C. Foster. 2020. “Testing Self-Report Time-Use Diaries Against Objective Instruments in Real Time.” Sociological Methodology 50 (1): 318–349. doi:10.1177/0081175019884591.
- Gerstel, N., and D. Clawson. 2018. “Control over Time: Employers, Workers, and Families Shaping Work Schedules.” Annual Review of Sociology 44 (1): 77–97. doi:10.1146/annurev-soc-073117-041400.
- Giattino, C., E. Ortiz-Ospina, and M. Roser. 2020. “How Are Working Hours Measured and What Can We Learn from the Data?” Our World in Data. https://ourworldindata.org/measure-working-hours
- Guarisco, S., E. Oddone, and D. Simel. 1994. “Time Analysis of a General Medicine Service: Results from a Random Work Sampling Study.” Journal of General Internal Medicine 9 (5): 272–277. doi:10.1007/BF02599655.
- Haberl, H., D. Wiedenhofer, V. Doris, G. Kalt, B. Plank, P. Brockway, T. Fishman, et al. 2020. “A Systematic Review of the Evidence on Decoupling of GDP, Resource Use and GHG Emissions, Part II: Synthesizing the Insights.” Environmental Research Letters 15 (6): 065003. doi:10.1088/1748-9326/ab842a.
- Hickel, J., and G. Kallis. 2020. “Is Green Growth Possible?” New Political Economy 25 (4): 469–486. doi:10.1080/13563467.2019.1598964.
- Hodder, A. 2020. “New Technology, Work and Employment in the Era of COVID-19: Reflecting on Legacies of Research.” New Technology, Work and Employment 35 (3): 262–275. doi:10.1111/ntwe.12173.
- Huberman, M., and C. Minns. 2007. “The Times They Are Not Changin’: Days and Hours of Work in Old and New Worlds, 1870–2000.” Explorations in Economic History 44 (4): 538–567. doi:10.1016/j.eeh.2007.03.002.
- International Labour Organization (ILO). 2008. “Report II: Measurement of Working Time.” 18th International Conference of Labour Statisticians, Geneva.
- Jackson, T., and P. Victor. 2011. “Productivity and Work in the ‘Green Economy.’” Environmental Innovation and Societal Transitions 1 (1): 101–108. doi:10.1016/j.eist.2011.04.005.
- Jeong, J. 2005. “Obtaining Accurate Measures of Time Use from the ESM.” In Being Together, Working Apart: Dual-Career Families and the Work-Life Balance, edited by B. Schneider and L. Waite, 461–482. Cambridge: Cambridge University Press.
- Jett, Q., and J. George. 2003. “Work Interrupted: A Closer Look at the Role of Interruptions in Organizational Life.” Academy of Management Review 28 (3): 494–507. doi:10.2307/30040736.
- Joly, J. 2022. “Four-day Week: Which Countries Have Embraced It and How’s It Going So Far?” Euronews, June 6.
- Juster, F., H. Ono, and F. Stafford. 2003. “An Assessment of Alternative Measures of Time Use.” Sociological Methodology 33 (1): 19–54. doi:10.1111/j.0081-1750.2003.t01-1-00126.x.
- Kallis, G., M. Kalush, H. O‘Flynn, J. Rossiter, and N. Ashford. 2013. ““Friday Off”: Reducing Working Hours in Europe.” Sustainability 5 (4): 1545–1567. doi:10.3390/su5041545.
- Kamerāde, D., S. Wang, B. Burchell, S. Balderson, and A. Coutts. 2019. “A Shorter Working Week for Everyone: How Much Paid Work Is Needed for Mental Health and Well-Being?” Social Science & Medicine 241: 112353. doi:10.1016/j.socscimed.2019.06.006.
- Kan, M., and S. Pudney. 2008. “Measurement Error in Stylized and Diary Data on Time Use.” Sociological Methodology 38 (1): 101–132. doi:10.1111/j.1467-9531.2008.00197.x.
- King, L., and J. van den Bergh. 2017. “Worktime Reduction as a Solution to Climate Change: Five Scenarios Compared for the UK.” Ecological Economics 132: 124–134. doi:10.1016/j.ecolecon.2016.10.011.
- Kitterød, R., and S. Pettersen. 2006. “Making up for Mothers’ Employed Working Hours? Housework and Childcare among Norwegian Fathers.” Work, Employment and Society 20 (3): 473–492. doi:10.1177/0950017006066997.
- Lepinteur, A. 2019. “The Shorter Workweek and Worker Wellbeing: Evidence from Portugal and France.” Labour Economics 58: 204–220. doi:10.1016/j.labeco.2018.05.010.
- Lin, K.-H. 2012. “Revisiting the Gap between Stylized and Diary Estimates of Market Work Time.” Social Science Research 41 (2): 380–391. doi:10.1016/j.ssresearch.2011.11.013.
- Lindsay, J., R. Lane, and K. Humphery. 2020. “Everyday Life after Downshifting: Consumption, Thrift, and Inequality.” Geographical Research 58 (3): 275–288. doi:10.1111/1745-5871.12396.
- Marimon, R., and F. Zilibotti. 2000. “Employment and Distributional Effects of Restricting Working Time.” European Economic Review 44 (7): 1291–1326. doi:10.1016/S0014-2921(00)00032-5.
- Marini, M., and B. Shelton. 1993. “Measuring Household Work: Recent Experience in the United States.” Social Science Research 22 (4): 361–382. doi:10.1006/ssre.1993.1018.
- Messenger, J., and L. Gschwind. 2016. “Three Generations of Telework: New ICTs and the (R)evolution from Home Office to Virtual Office.” New Technology, Work and Employment 31 (3): 195–208. doi:10.1111/ntwe.12073.
- Messenger, J., S. Lee, and D. McCann. 2007. Working Time around the World: Trends in Working Hours, Laws, and Policies in a Global Comparative Perspective. London: Routledge.
- New Economics Foundation (NEF) 2022. Newsletter of the European Network for the Fair Sharing of Working Time: Achieving a Shorter Working Week across Europe. London: NEF.
- Niemi, I. 1983. “A Systematic Bias in Hours Worked.” Statistiskt Tidskrift 1983: 4.
- Niemi, I. 1993. “Systematic Error in Behavioural Measurement: Comparing Results from Interview and Time Budget Studies.” Social Indicators Research 30 (2–3): 229–244. doi:10.1007/BF01078729.
- Nørgård, J. 2013. “Happy Degrowth through More Amateur Economy.” Journal of Cleaner Production 38: 61–70. doi:10.1016/j.jclepro.2011.12.006.
- Nova, A. 2021. “A 4-day Workweek is the Norm in Iceland: Could the Same Become True in the U.S.?” CNBC, July 12.
- Oddone, E., M. Weinberger, A. Hurder, W. Henderson, and D. Simel. 1995. “Measuring Activities in Clinical Trials Using Random Work Sampling: Implications for Cost-Effectiveness Analysis and Measurement of the Intervention.” Journal of Clinical Epidemiology 48 (8): 1011–1018. doi:10.1016/0895-4356(94)00229-J.
- Ohanian, L., and A. Raffo. 2012. “Aggregate Hours Worked in OECD Countries: New Measurement and Implications for Business Cycles.” Journal of Monetary Economics 59 (1): 40–56. doi:10.1016/j.jmoneco.2011.11.005.
- Organization for Economic Co-operation and Development (OECD). 2022. Hours Worked: OECD Data. Paris: OECD.
- Organization for Economic Co-operation and Development (OECD). 2020. Hours Worked: OECD Data. Paris: OECD.
- Parrique, T., J. Barth, F. Briens, C. Kerschner, A. Kraus-Polk, A. Kuokkanen, and J. Spangenberg. 2019. Decoupling Debunked: Evidence and Arguments against Green Growth as a Sole Strategy for Sustainability. Brussels: European Environmental Bureau.
- Pencavel, J. 1986. “Labor Supply of Men: A Survey.” In Handbook of Labor Economics, edited by O. Ashenfelter and D. Card, 3–102. Amsterdam: Elsevier.
- Presser, H. 2006. “Employment in a 24/7 Economy: Challenges for the Family.” In Fighting for Time: Shifting Boundaries of Work and Social Life, edited by C. Epstein and A. Kalleberg, 46–76. New York: Russell Sage Foundation.
- Pullinger, M. 2014. “Working Time Reduction Policy in a Sustainable Economy: Criteria and Options for Its Design.” Ecological Economics 103: 11–19. doi:10.1016/j.ecolecon.2014.04.009.
- Puranik, H., J. Koopman, and H. Vough. 2020. “Pardon the Interruption: An Integrative Review and Future Research Agenda for Research on Work Interruptions.” Journal of Management 46 (6): 806–842. doi:10.1177/0149206319887428.
- Robinson, J., and A. Bostrom. 1994. “The Overestimated Work Week? What Time Diary Measures Suggest.” Monthly Labor Review 117 (11): 11–23.
- Robinson, J., A. Chenu, and A. Alvarez. 2002. “Measuring the Complexity of Hours at Work: The Weekly Work Grid.” Monthly Labor Review 125 (4): 44–54.
- Robinson, J., S. Martin, I. Glorieux, and J. Minnen. 2011. “The Overestimated Workweek Revisited.” Monthly Labor Review 134 (6): 43–53.
- Rotenberg, L., I. Portela, B. Banks, R. Griep, F. Fischer, and P. Landsbergis. 2008. “A Gender Approach to Work Ability and Its Relationship to Professional and Domestic Work Hours among Nursing Personnel.” Applied Ergonomics 39 (5): 646–652. doi:10.1016/j.apergo.2008.02.013.
- Sayer, L., and J. Gornick. 2012. “Cross-National Variation in the Influence of Employment Hours on Child Care Time.” European Sociological Review 28 (4): 421–442. doi:10.1093/esr/jcr008.
- Schor, J. 2010. Plenitude: The New Economics of True Wealth. New York: Penguin Press.
- Schulz, F., and D. Grunow. 2012. “Comparing Diary and Survey Estimates on Time Use.” European Sociological Review 28 (5): 622–632. doi:10.1093/esr/jcr030.
- Simpson, E. 2022. “The Workers Getting 100% Pay for 80% of the Hours.” BBC, June 6.
- Sonnenberg, B., M. Riediger, C. Wrzus, and G. Wagner. 2012. “Measuring Time Use in Surveys – Concordance of Survey and Experience Sampling Measures.” Social Science Research 41 (5): 1037–1052. doi:10.1016/j.ssresearch.2012.03.013.
- Soper, K. 2020. Post-Growth Living: For an Alternative Hedonism. London: Verso.
- Spangenberg, J., I. Omann, and F. Hinterberger. 2002. “Sustainable Growth Criteria: Minimum Benchmarks and Scenarios for Employment and the Environment.” Ecological Economics 42 (3): 429–443. doi:10.1016/S0921-8009(02)00125-8.
- Steptoe, A., J. Wardle, Z. Lipsey, R. Mills, G. Oliver, M. Jarvis, and C. Kirschbaum. 1998. “A Longitudinal Study of Work Load and Variations in Psychological Well-Being, Cortisol, Smoking, and Alcohol Consumption.” Annals of Behavioral Medicine 20 (2): 84–91. doi:10.1007/BF02884453.
- Sullivan, O., and J. Gershuny. 2018. “Speed-Up Society? Evidence from the UK 2000 and 2015 Time Use Diary Surveys.” Sociology 52 (1): 20–38. doi:10.1177/0038038517712914.
- Vadén, T., V. Lähde, A. Majava, P. Järvensivu, T. Toivanen, E. Hakala, and J. Eronen. 2020. “Decoupling for Ecological Sustainability: A Categorisation and Review of Research Literature.” Environmental Science & Policy 112: 236–244. doi:10.1016/j.envsci.2020.06.016.
- van Hassel, D., L. van der Velden, D. de Bakker, L. van der Hoek, and R. Batenburg. 2017. “Assessing the Precision of a Time-Sampling-Based Study among GPs: Balancing Sample Size and Measurement Frequency.” Human Resources for Health 15 (1): 1–9. doi:10.1186/s12960-017-0254-8.
- Victor, P. 2008. Managing without Growth: Slower by Design, Not Disaster. Cheltenham: Edward Elgar.
- Wajcman, J., and E. Rose. 2011. “Constant Connectivity: Rethinking Interruptions at Work.” Organization Studies 32 (7): 941–961. doi:10.1177/0170840611410829.
- Walthery, P., and J. Gershuny. 2019. “Improving Stylised Working Time Estimates with Time Diary Data: A Multi Study Assessment for the UK.” Social Indicators Research 144 (3): 1303–1321. doi:10.1007/s11205-019-02074-3.
- Wanger, S., R. Weigand, and I. Zapf. 2016. “Measuring Hours Worked in Germany – Contents, Data and Methodological Essentials of the IAB Working Time Measurement Concept.” Journal for Labour Market Research 49 (3): 213–238. doi:10.1007/s12651-016-0206-0.
- Wingender, A. 2018. “A Consistent Measure of Hours Worked for International Productivity Comparisons.” Economics Letters 166: 14–17. doi:10.1016/j.econlet.2018.02.009.
- Worrall, L., and C. Cooper. 2014. “The Effect of the Recession on the Quality of Working Life of UK Managers: An Empirical Study.” International Journal of Management Practice 7 (1): 1–18. doi:10.1504/IJMP.2014.060540.
- Xu, X., Y. Peng, P. Zhao, R. Hayes, and W. Jimenez. 2019. “Fighting for Time: Spillover and Crossover Effects of Long Work Hours among Dual-Earner Couples.” Stress and Health 35 (4): 491–502. doi:10.1002/smi.2882.
Appendix A. Search strings
Q1
WT-WB search string
(“working time” OR “working hours” OR “work hours” OR “worktime” OR “work time”) AND (“wellbeing” OR “well-being”)
Results ordered by relevance, first 200 results exported (date of search: 18 June 2020)
WT-ECON search string
(“working time” OR “working hours” OR “work hours” OR “worktime” OR “work time”) AND LIMIT-TO (SUBJAREA, “ECON”)
Results ordered by relevance, first 200 results exported (date of search: 22 July 2020)
WT-ENV search string
Articles found by Antal et al. (Citation2021) with the string (“working time” OR “working hours” OR “work hours” OR “worktime” OR “work time”) AND (“energy use” OR “energy consumption” OR “energy demand” OR degrowth OR footprint OR emission OR resource*)
WTR search string
(“working time” OR “working hours” OR “worktime” OR “work time” OR “hours worked” AND reduction*)
This search generated 2423 results (date of search: 11 November 2020).
Q2
(“working time” OR “working hours” OR “worktime” OR “work time” OR “hours worked” OR time-use AND measure*) AND LIMIT-TO (SUBJAREA, “SOCI”)
The search found 1088 articles (date of search: 07 January 2020).
Appendix B. Differences between WS and TD/WG/calculated WT values
Appendix Table B1. Survey data distortions: summary of the main articles analyzing the WS method.
Appendix C. A web of working times
Appendix Table C1. Potential secondary effects, production side, with examples.