
 ?Mathematical formulae have been encoded as MathML and are displayed in this HTML version using MathJax in order to improve their display. Uncheck the box to turn MathJax off. This feature requires Javascript. Click on a formula to zoom.
Abstract
The United Nations’ seventh Sustainable Development Goal (SDG) calls for clean and affordable energy to boost social mobility, especially in disadvantaged rural communities. Regional off-grid budget-allocation planning for rural electrification is traditionally performed following a minimum energy-cost paradigm. However, such a planning paradigm has had little impact on communities’ development. This study proposes a human-centered approach as an alternative planning paradigm. In this regard, we outline a bi-objective optimization model that evaluates the potential contributions of different budget-allocation strategies on energy costs and rural communities’ human development. The model is applied to the Colombian Pacific Coast, an impoverished region with several communities with various unmet human needs including education, nutrition, and health. Our results indicate that when budget-allocation decisions are made by the national government following the energy cost-minimization paradigm only a few communities benefit, leaving many with poor energy access for potential future human development. However, if the maximization of the Human Development Index (HDI) is employed as a planning paradigm the most disadvantaged subregions improve their energy service for a marginal cost, increasing their chances for potential improvements in human development. The results also suggest that the current off-grid electrification budget provided by the national government is not enough to improve the region’s chances of advancing its HDI level from low (HDI < 0.55) to medium (HDI ≥ 0.55), but doubling the budget would do so. Thus, this study contributes to the energy-sustainability literature by proposing a new planning paradigm for regional off-grid electrification.
Introduction
The United Nations’ Sustainable Development Goals (SDG) call in part for clean and affordable energy solutions for all (Giannetti et al. Citation2020). It is well-established that access to modern forms of energy improves well-being and boosts social mobility by reducing the time required to undertake basic household activities such as cooking (Karsu and Kocaman Citation2021). In addition, adequate supplies of energy allow people to pursue business activities and education at night (Mugisha et al. Citation2021). Nevertheless, the International Energy Agency (IEA Citation2022) estimated that 733 million people around the world in 2020 still lacked access to electricity, and about 2.4 billion people had no access to clean cooking fuels. This situation perpetuates poverty and makes achieving other SDGs more challenging (Sarkodie and Adams Citation2020).
Off-grid communities in rural areas of many developing countries have very poor or nonexistent energy services (Salite et al. Citation2021). These communities are widespread and isolated, which makes providing energy costly and connecting to the national grid often infeasible (Riva, Colombo, and Piccardi Citation2019). Governments attempt to improve the situation by allocating funds for community electrification to subsidize energy costs and make the service affordable. Those funds are typically used to operate, repair, overhaul, or install new power-related technologies such as stand-alone power systems and mini-grid solutions (Come Zebra et al. Citation2021).
Off-grid electrification planning, a process that aims to improve energy quality and access, can be divided into two geographic levels: community and regional (Riva et al. Citation2018). Community-level planning focuses on finding the best technologies for an individual community, considering its location, weather, demand, culture, and economic activities (Akbas et al. Citation2022). Regional planning simultaneously covers dozens or hundreds of communities over a larger geographic area (Ciller and Lumbreras Citation2020). It entails overcoming problems such as community interconnection and grid expansion, microgrid design, and budget allocation. Budget allocation is a decision problem where a limited amount of money must be optimally distributed across several communities to provide them with reliable and affordable energy services (Sasse and Trutnevyte Citation2019). The economic paradigm of seeking the lowest energy cost has dominated such planning processes and limited the potential to support the development of communities through appropriate energy services (Grunewald Citation2017).
Budget-allocation decisions that follow the traditional economic paradigm may widen potential inequalities among communities, leaving the most underprivileged ones without sufficient financial resources to meet their basic energy needs (Trotter, Cooper, and Wilson Citation2019) and constraining their future potential for development. Sasse and Trutnevyte (Citation2019) propose using the Gini coefficient to allocate budgets with more equity, ignoring the communities’ current level of development and their potential for improvement with the energy that could be provided with the budget assigned by the national government for off-grid electrification.
We argue that a more equitable way to allocate a budget for regional energization would be by employing the Human Development Index (HDI) rather than the minimum energy cost or the Gini coefficient (Picatoste, Novo-Corti, and Tîrcǎ Citation2020). Research indicates that a community’s HDI, which entails life expectancy, years of schooling, and gross income per capita, is closely related to its level of energy access (Nadimi and Tokimatsu Citation2018). Although energy access is often not on its own enough to improve the HDI, the lack of it hinders a community’s possibilities for future improvement and development. Hence, budget-allocation decisions based on HDI, which has received little attention in the energy-planning literature, may better reflect the potential of energy to contribute to supporting community development.
Although extensively employed to represent human development, it is important to note that the HDI is limited since it does not account for people’s quality of education or overall well-being (Kurnia et al. Citation2022). Also, as mentioned above, energy access on its own is insufficient to markedly improve people’s living conditions (Tomei et al. Citation2020). Holistic developmental plans that target other specific needs such as education, nutrition, health, gender equality, and so forth are required. In this regard, our view is that energy is one key component of this needed holistic intervention, and lacking access to it, makes the satisfaction of other needs challenging (Tomei et al. Citation2020).
Thus, this study attempts to fill this gap in the literature by proposing a human-centered budget-allocation approach for regional electrification planning. We develop a bi-objective optimization model that assesses different resource-allocation strategies through various levels of energy provision for the communities that we analyze. The model calculates the trade-offs such energy provisions entail in terms of energy costs and the HDI.
More specifically, this research contributes to the literature by proposing a human-centered approach to support budget-allocation decisions that accounts for the communities’ current level of development and their future potential improvement due to a designated budget. This challenges the traditional economic-based paradigm of energy planning and proposes an alternative human-centered perspective.
The remainder of the article is organized as follows. The next section reviews the literature on regional electrification planning, including the importance of non-economic dimensions. We then provide an overview of the Colombian Pacific Coast, the region chosen as a case study, and the fourth section explains the proposed bi-objective optimization model for budget-allocation planning. We present the model results in the fifth section. The sixth section discusses the policy implications derived from the approach and the seventh section offers our conclusions.
Literature review
This section discusses the literature on regional electrification planning, the use of the Gini index to obtain equitable solutions in budget-allocation problems, and the benefits of employing the HDI to represent the potential energy impacts on community development.
We observe that most studies on regional electrification planning focus on the technical aspects such as the design of microgrid systems, grid expansion, power-line construction, interconnections between communities, and resource allocation (Ciller and Lumbreras Citation2020).
In terms of budget allocation, various studies have suggested different ways to distribute economic resources among communities (Domenech et al. Citation2018; Nock, Levin, and Baker Citation2020; Trotter, Cooper, and Wilson Citation2019), but mostly from an economic perspective, seeking to minimize energy costs and financial expenditures (Grunewald, Citation2017). For example, Blechinger, Cader, and Bertheau (Citation2019) developed a simulation model to find the lowest-cost electrification solution for five counties in Nigeria, evaluating the feasibility of extending the national grid or installing stand-alone systems. Moretti et al. (Citation2019) formulated an optimization model to control microgrids to improve operational performance at the lowest possible cost for communities in sub-Saharan Africa. These models generally focus on assigning financial resources to the most cost-efficient electrification alternatives and to define the communities and regions where electrification is feasible within the available budget (Ciller and Lumbreras Citation2020).
Energy-planning approaches that have attempted to include non-economic indicators are rare (Mandelli et al. Citation2016). Equity metrics, especially the Gini coefficient, are a notable exception in this context. The Gini coefficient, the most popular equity measure in the literature, measures the statistical dispersion of a variable (e.g., income and wealth) across a geographical area. In this context, perfect equity is achieved when each community has access to the same electricity per capita. In contrast, total inequity occurs when all of the available electricity is accessed by a single community in a region (Drechsler et al. Citation2017). Sasse and Trutnevyte (Citation2019) developed an optimization model to assess the trade-offs between the lowest-cost approach and the Gini coefficient in the context of the national Swiss power system. Drechsler et al. (Citation2017) applied the same principles to the German case and found that a relative cost increase of 2% produces more equitable solutions in many scenarios.
The Gini coefficient measures the dispersion in the distribution of energy as a resource but does not account for the level of development and well-being that communities could achieve through electrification (Wu, Li, and Wei Citation2022). The HDI, adopted by the United Nations to track human-development progress in several countries and regions of the world, is a widely accepted proxy of human development, but arguably provides a limited account of well-being as mentioned earlier (Nadimi and Tokimatsu Citation2018; Sarkodie and Adams Citation2020).
The relationship between access to electricity and HDI has been studied extensively (Eustachio et al. Citation2019; Nadimi Citation2019). Although it is difficult to determine the extent to which electricity increases human development and well-being, empirical evidence shows a positive relationship between electricity access and literacy, income, and health, especially for women (Nguyen and Su Citation2021). Studies have proposed logarithmic functions to model this relationship, as its non-linearity captures the decreasing improvement in well-being as access to electricity improves beyond a certain level (Lambert et al. Citation2014). Research has shown that the benefits from electricity tend to spike when access is initiated (in other words, going from no electricity to some), but decrease as access increases (Bridge, Adhikari, and Fontenla Citation2016). This outcome is due to the types of needs or services that are satisfied at different access levels (Lambert et al. Citation2014). At the lowest levels, electricity meets fundamental needs from a human-development perspective such as cooking, heating, cooling, and lighting which are essential to human survival (Nadimi Citation2019). At intermediate access levels, electricity is used to support basic needs such as education and health. At higher access levels, electricity is used for productive purposes, namely promoting employment and generating income (Riva and Colombo Citation2020). Finally, when all of those needs are met, most people start using electricity for recreational activities that focus on amusement, enjoyment, and pleasure, such as, video games, fairs, and festivals (Nadimi Citation2019).
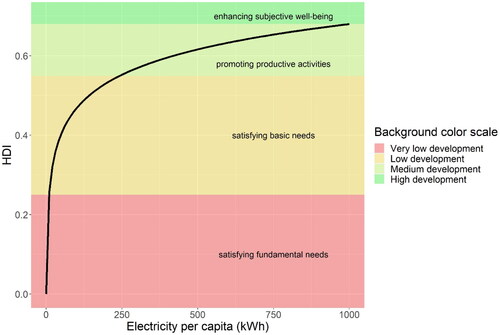
shows the annual electricity per capita required to achieve different levels of human development (Nadimi and Tokimatsu Citation2018). This function that relates per capita electricity to HDI is used later in this article to assess the expected impact of energy access on a community’s level of human development.
Figure 1. Relationship between electricity per capita and HDI. Source: Nadimi and Tokimatsu (Citation2018).
Case study: the Colombian Pacific Coast
Colombia’s Pacific Coast region is greatly affected by poverty, illiteracy, illegal armed groups like drug cartels and guerrillas, and weak governmental institutions (Galvis-Aponte, Moyano, and Alba Citation2016; Garces et al. Citation2021). Located in the western part of the country, the region includes the departments of Chocó, Valle del Cauca, Cauca, and Nariño. These jurisdictions are subdivided into rural municipalities comprising communities, villages, and hamlets (see ). Overall, the region has excellent natural resources that could be used for energy production and high biodiversity. However, it is geographically isolated from the country’s main urban centers, making it challenging to provide most services, including electricity (Tomei et al., Citation2020). The four panels in show the percentage of the region’s population living in poverty, extreme poverty, illiteracy, and with no-school attendance, respectively.
Figure 2. The Colombian Pacific Coast.
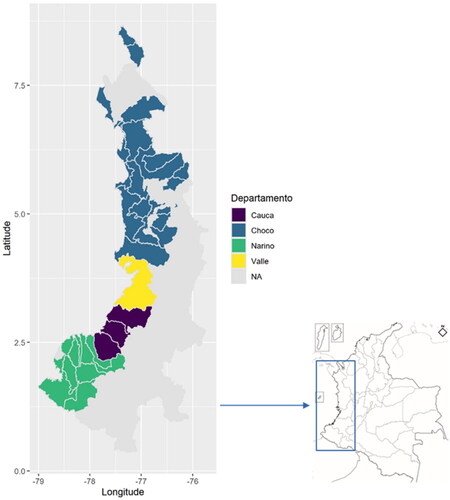
Figure 3. Percentage of population in (a) poverty, (b) extreme poverty, (c) Illiteracy, and (d) no-school attendance. Source: DNP (Citation2019).
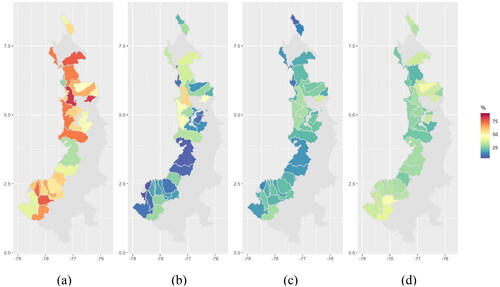
As can be seen, the departments of Nariño and Choco in the southern and northern parts of the coast, are the most impoverished areas of the region (). These departments have municipalities where up to 80% of the population lives in poverty (), with 60% living in extreme poverty in Choco (). Illiteracy abounds, especially in Choco where it reaches up to 35% of the population (). Nariño has the highest non-school attendance rates, as high as 50% in some places (DNP Citation2019).
The electrification rate in the region’s urban settlements is 100%, while in rural areas, it is about 89% (DNP Citation2019). In addition, the existing service, especially in rural areas, is largely inefficient, expensive, and polluting. Its topography, widespread (low-density) population, and distance from large urban centers make connecting to the national power grid infeasible. Outdated, inefficient diesel generators are the most common sources of power (Garces et al. Citation2021).
Due to the inhabitants’ challenging socioeconomic condition, the Colombian government has created funds to subsidize local electricity rates (Gaona, Trujillo, and Guacaneme Citation2015). The most common scheme finances generation costs regardless of the technology or fuel source employed. The scheme reimburses the difference between the rates paid by the consumers and actual generation costs (Gaona, Trujillo, and Guacaneme Citation2015). The main drawback is that it treats renewable and polluting energy sources equally and does not incentivize cost-efficient technologies (Viteri et al. Citation2019).
Nearly 10 years ago, the Colombian government enacted a subsidy program to finance the capital costs of power-generation systems, aiming to promote the adoption of renewable energy sources and technology transitions (UPME Citation2015). However, the program has not been effective because the currently subsidized diesel-generation plants are still profitable for service providers, leaving insufficient incentives to switch from polluting to renewable sources (Minenergia Citation2018). Changing to a new technology only carries additional investment costs and risks, prompting calls to change the regulations to further incentivize the switch to renewable sources (BID Citation2020).
Methods
In this section, we present our optimization model to guide budget-allocation decisions in off-grid regional electrification planning. The model assesses different allocation strategies, estimates tradeoffs between the HDI and electricity costs, and considers various socio-technical and economic constraints.
The e-constraint method
The e-constraint approach to optimization assesses tradeoffs between multiple conflicting objectives within an optimization model (Burke and Graham Citation2014). The model developed in this research seeks to maximize a region’s HDI () while minimizing the costs of electricity (
); these equations will be explained in further detail below. The e-constraint method optimizes the first objective function (e.g.,
while the other function (e.g.,
) acts as a constraint (Burke and Graham Citation2014). A set of Pareto solutions is obtained by systematically varying the values of the right-hand side limit (
of the
constraint, as follows:
(1)
(1)
subject to
, where
is the feasible region.
The final optimal solution calculated by the iterative process described above corresponds to minimizing energy costs, with
unconstrained.
Decision variables
The planning process starts by dividing the region (typically a large portion of a country) into different subregions (), each of which comprises several communities and villages. During each e-constrain iteration the optimization model suggests the optimal amount of electricity (
) that should be supplied annually by the service providers to each subregion (
), subject to the off-grid electrification budget of the national government. In addition, the model suggests the most appropriate energy source to produce that electricity by choosing from a combination of technologies, in this case, solar photovoltaic (PV) and diesel, the most common sources commercially available for off-grid communities in Colombia. Those decision variables allow us to identify the subregions where a technology transition is desirable. Two decision variables,
and
, represent the new power capacity that should be installed by the service providers in each subregion
(in peak kilowatts, kWp) of solar PV and diesel, respectively. Finally, the amounts of electricity to be produced with solar PV and diesel are represented through two decision variables,
and
(in kilowatt hours, kWh), respectively.
Objective functions
As mentioned above, the goal of the optimization is to improve two objective functions. The first objective is to enhance communities’ human development, while the second is to choose the most affordable energy mix possible. As discussed above, the HDI is employed as an imperfect proxy for people’s well-being, and the cost of electricity is used to reflect service affordability. These two objective functions are in conflict, so evaluating their tradeoffs is crucial (see next section).
Human Development Index
The optimization model uses a weighted average approach to calculate the regional HDI based on each subregion’s HDI, with weight factors determined by the subregion’s percentage of the total population (EquationEquation (2)(2)
(2) ). This approach allows us to take into consideration the relative importance to each subregion based on its population size (
). In addition, the model uses the logarithmic function discussed above to estimate each subregion HDI (
), which depends on the electricity per capita (
) assigned to subregion i (Nock, Levin, and Baker Citation2020), thus capturing the decreasing returns in terms of human development as a result of more extensive electricity access, as shown in EquationEquation (3)
(3)
(3) (Nadimi Citation2019). The variable
is calculated as a function of the electricity supplied to subregion i from solar PV and diesel sources (EquationEquation (4)
(4)
(4) ). Finally, EquationEquation (5)
(5)
(5) limits the amount of electricity per capita assigned to each subregion using a maximum of 1,000 kWh, the typical value consumed in high-development urban centers (Sarkodie and Adams Citation2020). A piecewise linearization function is applied to EquationEquation (3)
(3)
(3) to facilitate the numerical connections in the optimization method (Walther Citation2014). The equations employed for the linearization process are provided in Appendix A.
(2)
(2)
(3)
(3)
(4)
(4)
(5)
(5)
(6)
(6)
(7)
(7)
Constraints
Solar PV electricity generation
EquationEquation (8)(8)
(8) shows the electricity produced with solar PV systems, which depends on the power-capacity installation (
), a technology-capacity factor (
), and the total number of hours in a year (8,760). The capacity factor
is calculated based on the solar radiation available (determined by the number of hours of daylight and intensity) in each subregion and expected technical losses (Fuso Nerini et al. Citation2015). The capacity factor varies across subregions due to the individual solar resource levels.
(8)
(8)
Diesel electricity generation
EquationEquation (9)(9)
(9) determines the maximum amount of electricity that can be generated with diesel technology, which is limited by the current installed capacity in each subregion i,
, any new capacity additions
, the technology-capacity factor (CFd), and the number of hours in a year (Gupta, Saini, and Sharma Citation2011).
(9)
(9)
Level of service
The last constraint, as shown in EquationEquation (10)(10)
(10) , guarantees that the amount of electricity supplied to all subregions is greater than or equal to the level of service they currently receive (
). Hence, the optimization model cannot decrease or worsen conditions in any subregion compared with its current level.
(10)
(10)
Data collection
The Colombian Pacific Coast is divided into 33 regions, as listed in Appendix B. We used the following data sources to populate the optimization model.
Fuel costs for generating electricity using diesel technology () were obtained from the Colombian Superintendency of Residential Public Services, Superservices (Superservicios Citation2019), which provides the costs for each subregion. The capacity factors for PV systems operating in all subregions (
) were calculated as the ratio between the maximum amount of electricity that could be produced given the solar radiation available during a year and the electricity that would be produced at full load over the same period. Solar radiation data for each subregion were retrieved from the National Renewal Energy Laboratory’s National Solar Radiation Database (Sengupta et al. Citation2018). We obtained solar PV system costs from IRENA (Citation2018) and population data (
) from the Colombian National Planning Department (DNP Citation2019).
We next present results from the model and sensitivity analyses.
Results
This section describes the results obtained by applying the optimization model to the Colombian Pacific Coast region. We begin with a brief description of the current state of electrification in the region (the baseline). We then present the model results in detail, with a sensitivity analysis of the limitation imposed by the budget constraint to estimate what would be required to lift living conditions and development in the region to a medium HDI level.
The electrification baseline in the Colombian Pacific Coast
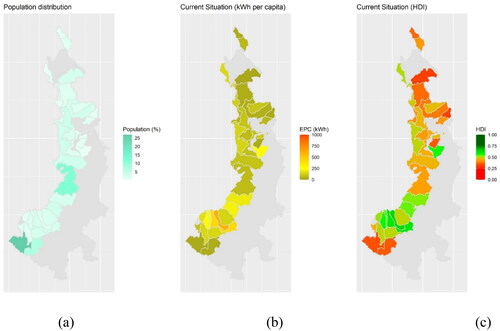
The government’s annual budget for off-grid rural electrification in the Colombian Pacific Coast region is currently around US$25 million (Superservicios Citation2019). On average, inhabitants receive electric service per capita ranging from 20 to 600 kWh annually, for which they pay about 0.44 US$/kWh (Superservicios Citation2019). Urban centers in Colombia pay 0.20 US$/kWh or less and can access more than 1,000 kWh per capita annually. Electricity in the region is expensive, primarily because, as noted above, it is generated with outdated diesel systems. Using the logarithmic HDI function presented in , this level of electrical service produces an HDI score of approximately 0.425 for the region, far lower than the average HDI level of 0.75 for Colombia.
Maps 4b and 4c show subregions in the south with high electricity access (yellow areas in ) and HDI values (green colors in ), despite their low population and economic productivity compared to the rest of the Pacific Coast. This observation suggests that energy access may be influenced by corruption, political influence, or pressure, rather than solely linked to economic activity or population. Previous research has suggested that some community leaders and properties belonging to favored borrowers may receive preferential treatment, which contributes to inequalities in energy access (Abdul-Salam and Phimister Citation2016). However, further investigation is necessary to fully understand the reasons behind uneven energy access across different regions.
Figure 4. Population distribution (a), electricity per capita (b), and HDI levels (c) for the Colombian Pacific Coast.
Model results: the e-constraint method
This section presents the results from the optimization model subject to the government’s current annual budget of US$25 million. Using the e-constraint method, we compute 10 different trade-off optimal solutions—hereafter referred to as S1, S2,…, and S10. The S1 solution represents the minimum cost for electricity (i.e., , while the S10 solution represents the maximum regional HDI level achievable (i.e.,
. Solutions S2 to S9 are intermediate solutions between the minimum electricity cost and the maximum HDI. The Pareto optimal curve obtained from plotting the 10 trade-off solutions, S1 to S10, is shown in .
Figure 5. Pareto curve between HDI and electricity costs under the current budget constraint.
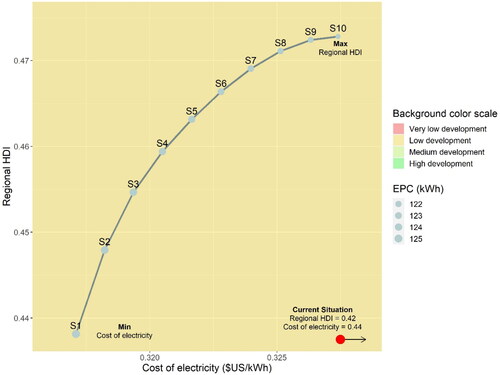
We see that the minimum electricity cost is approximately 0.317 US$/kWh, which increases by 3.25% moving from solution S1 to solution S10. Moving from the minimum cost state (S1) to the maximum HDI (S10) increases the HDI score from 0.438 to 0.473, an 8.0% improvement. The current electrification situation (shown in ) is represented by a red dot at the bottom right of . This indicates the region has higher electricity costs and lower HDI levels than any of the other 10 “trade-off” solutions suggested by the model, including the traditional minimum cost solution (S1). This shows that the current situation is inequitably allocating the annual budget and that better results could be achieved, both in terms of costs and human development, by using any of the trade-off solutions proposed by the optimization model.
The color scale on the right-hand side of indicates the level of development the region could achieve when moving from one trade-off solution. In other words, it shows the types of needs an individual could satisfy with the electricity provided in each solution (). Here, the background color is yellow for all 10 trade-off solutions, indicating that the region would remain at a low-development state, even under the best HDI scenario (S10). This suggests that the current annual budget is not enough to lift the region’s living conditions to a higher state of development using any of the trade-off solutions. However, the level of development that could be achieved with any of the 10 trade-off solutions would be better than the region’s current state, which is close to the very low-development category.
and show heat maps for per capita electricity and HDI levels across the region as assigned by the model. The figures compare the region’s current state of electrification and development with the proposed trade-off solutions S1, S4, S7, and S10. The maps that correspond to the S1 solution, where electricity costs are minimized, allocate a large portion of the budget to the northern subregions. This solution would enable those subregions in the north to achieve high levels of electricity per capita and HDI, but create inequalities in the remaining subregions, including those in the middle and bottom parts of the map. The low state of development in those subregions would be unchanged by the S1 solution.
Figure 6. Electricity per capita heat maps of the current state of electrification and the proposed trade-off solutions S1, S4, S7, and S10 (from left to right).
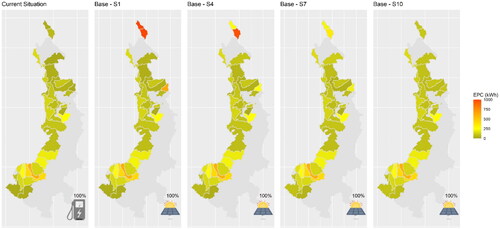
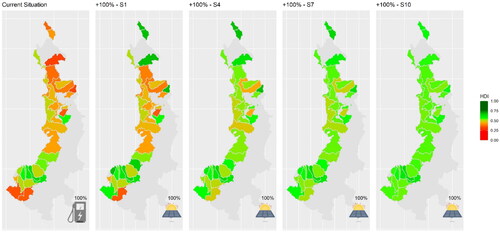
Figure 7. HDI heat maps of the current state of electrification and the proposed trade-off solutions S1, S4, S7, and S10, from left to right.
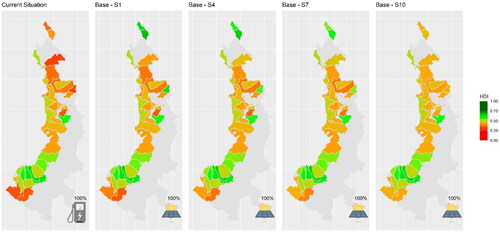
In contrast, in the solutions with greater emphasis on optimizing the HDI (solutions S4 to S10), we see a more equitable or homogeneous distribution of the budget. The S10 solution maps show more homogeneous energy-supply levels among the subregions in the middle of the region, with similar levels of electricity per capita provided. Note that the areas at the bottom of the map highlighted in yellow remain at the same levels of energy access as in the baseline scenario. This shows that when regional HDI is maximized, the allocation process focuses more on the subregions that are left behind or have more significant needs. The HDI heat maps () show more substantial improvements than the electricity per capita maps () as solutions move closer to S10, because the HDI analysis acknowledges the marginal improvements obtained with greater electricity access.
The bottom right corner of each map ( and ) shows the predominant energy source chosen by the optimization model for each subregion under each situation. As can be seen, solar PV technology is the preferred solution in all the cases analyzed, in terms of both the economics and human-development objectives. This strongly suggests that to advance both economic and human development, the region should pursue a technology transition to replace diesel plants with modern solar PV plants.
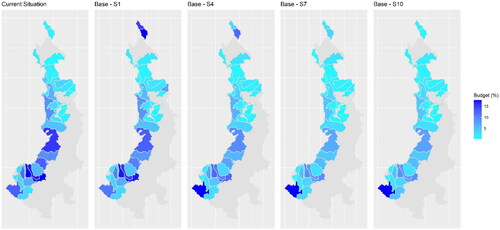
compares the current budget distribution with the distributions proposed by the optimization model in trade-off solutions S1, S4, S7, and S10, for all subregions. The results show a highly unequal budget distribution under the current electrification approach between the subregions in the north and south. Currently, the subregions in the south receive more budget per capita than those in the north. The cost-minimization approach, S1, tends to maintain the status quo with respect to the budget allocation, indicating that the dominant objective of the current budget-allocation process is to minimize cost. The percentage of the budget allocated to the southern subregions decreases under the HDI maximization approach. The human-centered approach (S10) distributes the budget in a way that affects more of the subregions in the north with higher unmet needs. With maximizing HDI as the goal, the budget allocation would likely drift even further away from the status quo except that the model prevents electricity per capita from worsening in any subregion. In order words, the optimization model must improve or at least maintain the same level of service currently provided, for all subregions. Otherwise, the model would further reshape the budget allocation to provide even more benefit to some of the most highly deprived subregions at the expense of reducing the service currently provided in other subregions.
Figure 8. Budget distribution heat maps of the current state of electrification and the proposed trade-off solutions S1, S4, S7, and S10, from left to right.
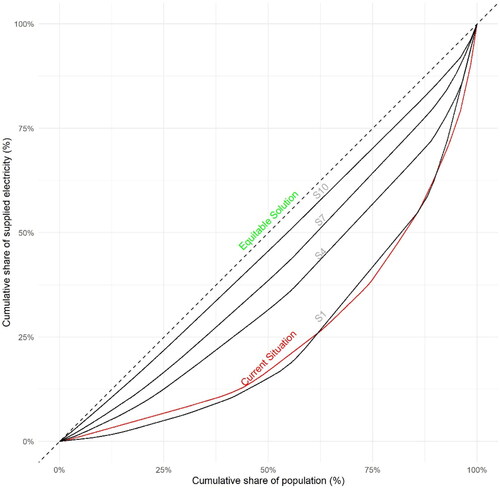
shows the Lorenz curve for the baseline state of electrification in the Colombian Pacific Coast region and the four trade-off solutions, S1, S4, S7, and S10. The x-axis represents the cumulative share of the population, and the y-axis represents the cumulative share of electricity access. The curve represents the level of equity within a population with respect to access to a particular resource. An ideal or “total equality” condition is when a given percentage of a population has access to that same portion of the resource. With respect to electricity, an ideal solution would mean that, for example, 50% of the population consumes 50% of the region’s electricity. The straight line at a 45° angle in represents this condition.
Figure 9. Lorenz curves of the current state of electrification and solutions S1, S4, S7, and S10.
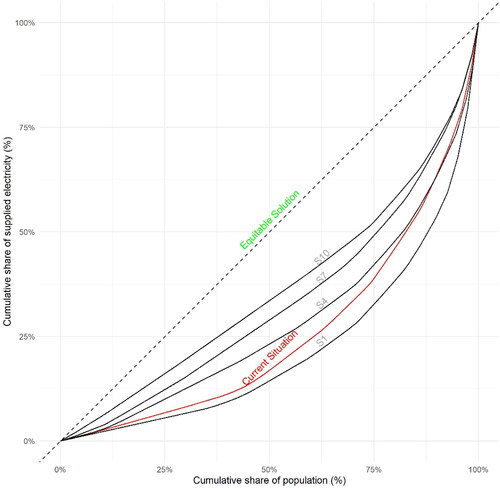
In contrast, a highly inequitable situation would be when a tiny portion of the population consumes a large percentage of the resource in question. The red line in , which shows the baseline situation on the Colombian Pacific Coast, reveals a highly unequal electricity distribution: 25% of the population consumes about 62.5% of the region’s electricity. The solution that minimizes electricity cost, S1, shows a similar pattern. However, the more priority given to the regional HDI, the closer the modeled solution moves to an ideal equity condition. In other words, inequality decreases when the solution moves toward S10, indicating a fairer budget allocation.
Thus, the graph suggests that applying the economic paradigm (S1), which seeks to minimize electricity costs, may not be the best approach to budget allocation decisions in providing off-grid electricity on the Colombian Pacific Coast. Although S1 suggests a more cost-efficient way to employ the region’s economic resources compared to the current approach, it perpetuates inequalities and human- development gaps among the subregions. Maximizing the HDI (S10) reduces these development gaps and improves conditions in every subregion, to the extent the current budget allows.
Next, we perform sensitivity analyses regarding the available budget and assess the trade-offs between the budget limit and HDI.
Budget-based sensitivity analyses
As shown in the previous section, the baseline-electrification budget of US$25 million is not enough to raise the Pacific Coast region’s level of development (HDI) from low to medium. In the S10 solution, where HDI is maximized, the level of HDI achieved is 0.47, which is below the minimum threshold of 0.55 for the “medium” level of development. Another possible planning approach to improve regional HDI with the same budget is to redistribute the budget without the constraint of maintaining the current energy-service levels in each subregion (see EquationEquation (10)(10)
(10) ). However, this would require sacrificing the level of service in some subregions, potentially worsening their development conditions in order to achieve higher collective HDI results. This approach would be highly controversial, politically and ethically speaking, and therefore, not desirable. Hence, it is reasonable to conclude that the current annual off-grid electrification budget provided by the national government is insufficient to achieve a medium level of development for the population, and that the only viable solution is to increase it.
In this section we conduct sensitivity analyses with respect to the government’s annual electrification budget to understand what would be required to bring the region to a medium development level. We consider increases in the baseline-electrification budget in increments of 25% until the current budget is doubled. Thus, we re-run the optimization model using four different budget levels to calculate new trade-off curves: +25%, corresponding to US$31.25 million, +50%, which equates to US$37.50 million, +75% representing US$43.75 million, and +100%, for a budget of US$50 million, twice the current budget.
shows the trade-off curves obtained from the four new budget levels. The lowest curve, base, was obtained in the previous section using the original US$25 million budget (see ). The four new curves, based on budget increases ranging from +25% to +100%, are above the base curve. As can be seen, only by doubling the current budget and optimizing the regional HDI (i.e., S10 or ) would the Colombian Pacific Coast start entering the medium development level, with an overall HDI value of 0.55. This suggests that the lag of development the region has suffered for decades cannot be overcome only through energy access but needs to be accompanied by sustained, holistic, human-centered policies. Also, note that the minimum electricity cost decreases in S1 compared to the base curve presented in . This is because, with the current budget, only the savings from migrating from diesel to solar PV would contribute to improve the communities’ HDI level. However, by having a budget increase of +100%, more economic resources could be used to achieve higher HDI levels at lower electricity costs.
Figure 10. Sensitivity analysis trade-off curves between HDI and electricity costs.
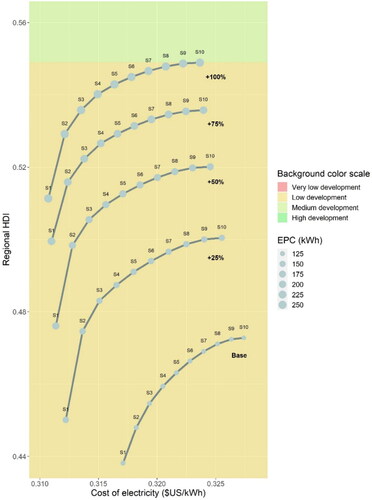
and show heat maps for the levels of electricity per capita and HDI under the current state of electrification in the region, and for the trade-off solutions S1, S4, S7, and S10 under the +100% budget scenario. Budget distribution heat maps are not shown because the allocations in percentage terms are almost the same as in . Compared to current conditions, the increased budget significantly improves conditions across the region under all of the trade-off solutions, especially under S10, where HDI is maximized. The S10 solution allocates resources so that similar levels of per capita electricity are provided to all subregions, improving living conditions to medium HDI levels (over 0.55). In contrast, considerable disparities result from the cost-minimization planning approach (S1). With S1, only a few regions achieve medium and high HDI values (shown in green in ), while many others are left in a low-development state (terracotta/orange in ). Therefore, the human-centered resource-allocation approach creates better conditions across the region. Communities reach a medium level of development, as measured by HDI, allowing them to satisfy basic needs and use medium-intensity appliances to improve education and health.
Figure 11. Electricity per capita heat maps of the current electrification state and the trade-off solutions S1, S4, S7, and S10 under the +100% budget scenario.
Figure 12. HDI heat maps of the current electrification state and the trade-off solutions S1, S4, S7, and S10 under the +100% budget scenario.
The Lorenz curves of trade-off solutions S1, S4, S7, and S10, under the +100% budget scenario (), are closer to the ideal, equitable situation (represented by the 45° line) than those presented in . The S10 solution achieves the highest equity levels (closest to the equitable solution). This indicates that while seeking to maximize the region’s HDI levels at the lowest cost, the human-centered planning approach prioritizes the communities with the lowest electricity access because they have more room for potential HDI improvement than those with initial greater energy access.
Figure 13. Lorenz curves for the current state of electrification and trade-off solutions S1, S4, S7, and S10, under the +100% budget scenario.
The next subsection discusses the model results and policy implications.
Discussion
The results presented above show that favoring human development in budget-allocation decisions for off-grid electrification creates more equitable conditions with respect to HDI across the entire region than traditional economic planning. The economic (i.e., cost-minimization) paradigm perpetuates inequalities among subregions by allocating more resources to the subregions with better-existing power-generation conditions. In contrast, the human-centered perspective produces more equitable solutions due to the marginal-benefit effect captured by the logarithmic function that associates HDI with electricity access. Our model shows that the human-centered approach views a high concentration of resources in a few subregions as less equitable than partially intervening in many unprivileged subregions with more funding at a slight cost increase.
In addition, the results suggest that off-grid electrification public funds are inefficiently spent when they are used to finance the operation of old and maybe obsolete diesel plants. Those facilities are proved to be more expensive and less sustainable than the solar PV alternative. The model recommends transitioning from diesel fuel-based power to solar PV to reduce fuel and transportation costs, and using the cost savings to invest in other subregions. The baseline scenario, representing the way public funds are currently allocated, results in a lower HDI value than any of the trade-off solutions proposed by the optimization model, including the minimum cost solution S1 (see ). This observation suggests that, even under the current level of public spending, changing technologies can increase the chances to improve the region’s human-development dimension and to reduce carbon-dioxide (CO2) emissions by about 15,040 tons per year (USEIA Citation2022).
The sensitivity analysis demonstrates that the current budget of US$25 million is insufficient to increase the level of human development in the region from low to medium. Even the scenario that maximizes HDI, S10, cannot significantly enhance the region’s chances to improve its human development under the current budget. To move the region to the medium development level of HDI would require a significant increase in the annual budget designated by the national government to US$50 million, plus a more holistic developmental intervention that targets other community needs. The Lorenz curve shows that equity could be substantially improved if the government’s energization planning paradigm is changed toward maximizing HDI. Increasing the budget would further increase the chances of obtaining more significant positive effects on human-development terms.
As mentioned before, the living conditions in off-grid regions will not improve if more holistic interventions that systemically target social and human aspects are not taking into consideration in energy planning (Tomei et al. Citation2020). In addition, key stakeholders, such as the communities, private investors, multilateral organizations, and the Colombian government, need to coordinate efforts and be actively involved in the electrification process including planning, building, maintaining, and operating energy solutions (BID Citation2020). Garces et al. (Citation2021) report different case studies in Colombia that show how a well-coordinated collaboration between stakeholders can bring positive electrification outcomes. For example, there are various communities in Amazonas and Ándes where energy-service providers are in charge of managing and maintaining energy infrastructure, while the community performs its daily operation and payment collection.
Additionally, the Colombian legislation that promotes electrification in rural off-grid regions is complicated and bureaucratic, making the sector less attractive for business (Gómez-Navarro and Ribó-Pérez Citation2018). The Inter-American Development Bank (IADB), in a report on subsidy design and formulation, identifies several financing sources that create opposite incentives that slow down the transition from diesel to renewable technologies (see also Garces et al. Citation2023). In this regard, Contreras and Rodríguez (Citation2016) propose a financial derivative that recognizes the variability in renewable energies and assigns prices accordingly. The idea is to share a project’s risk with the government and incentivize the participation of private investors in off-grid areas.
Finally, some positive signs of progress in the country are worth noting. For instance, the Colombian National Planning Department and the Ministry of Energy are implementing a roadmap to close further the gaps in electricity access in the country’s off-grid areas (Minenergia Citation2018). In addition, the government enacted the law CONPES 4075 in 2022 to add US$20 million to the off-grid energization budget to renovate old power facilities and install renewable energy systems (CONPES Citation2022).
Conclusions
This research proposes a bi-objective optimization approach to make budget-allocation decisions in regional electrification planning. The resulting model assesses the potential impacts of different strategies on energy costs and communities’ HDI. The article’s main contributions lie in the human-centered perspective and the model results, which show how a budget for rural electrification could be allocated to improve future chances of human development in a region.
The model was applied to the Colombian Pacific Coast, a region greatly affected by poverty, weak governmental institutions, and lack of access to essential services such as electricity.
The main findings of this research are threefold. First, we find that the trade-offs between the human and economic dimensions are not as substantial as one might expect, and that favoring human development in allocating economic resources is more equitable than the current situation in the region, from a human-development perspective. It is also more equitable than the traditional economic planning paradigm, which creates inequalities among various subregions.
Second, the inefficiency associated with the current state of electrification in the region results from the continuous use of outdated diesel plants that are highly polluting and costly. Transitioning to solar PV technology is recommended for the entire region and can be undertaken with the current budget in place. The government should discourage diesel by penalizing it for slowing down such a transition.
Finally, the optimization model and sensitivity analysis show that the current off-grid electrification budget provided by the nation is insufficient to improve the chances of the Pacific region to progress from a low to a medium development level, regardless of the budget-allocation approach followed. Therefore, the recommended changes concerning technology and planning are not enough; a substantial increase in the off-grid electrification budget is needed, as well as holistic interventions that target other human needs, such as education, health, nutrition, and so forth. That would provide a better opportunity for the region to move from its current low-development state to a medium state and reduce some inner inequalities.
As mentioned earlier, this research does not intend to claim that energy infrastructure alone is enough to achieve improvements in human development. We focus exclusively on the relationship between energy access and HDI, aiming to highlight its role in enhancing future chances for development. If communities have poor energy access, the opportunities to grow by other means could be harmed. Also, this research does not consider the complex dynamics and interactions among key stakeholders. However, rural electrification should be in an environment where stakeholder cooperation is promoted, especially between energy suppliers and communities. Universities and research centers could also play a role by facilitating stakeholder interactions and empowering communities to embrace new technologies, as well as to manage and operate them. Future research endeavors could focus on discussing more deeply the aspects outlined above, as well as all the economic policy issues associated with the electrification of rural communities, particularly on the Colombian Pacific Coast.
Future research should explore the effectiveness of various energy policies and financing schemes, such as incentives, subsidies, and other methods, to promote off-grid electrification and technology transition. It is important to note that the optimization model assumed that the data used in this study, which we obtained from governmental institutions such as the National Planning Department and the Superintendence of Public Services, is accurate and without uncertainty. However, collecting precise data from remote off-grid communities is challenging, making it difficult to avoid inaccuracies. Therefore, future research studies could incorporate stochastic characteristics in the model to account for the main uncertainties associated with costs, level and quality of service, among others.
Acknowledgments
We express our deep gratitude to Maurie Cohen for his invaluable revisions, which have greatly enhanced the quality of our manuscript.
Disclosure statement
No potential conflict of interest was reported by the authors.
Data availability statement
The data employed in this research can be provided upon request.
References
- Abdul-Salam, Y., and E. Phimister. 2016. “The Politico-economics of Electricity Planning in Developing Countries: A Case Study of Ghana.” Energy Policy 88: 1–19. doi:10.1016/j.enpol.2015.10.036.
- Akbas, B., A. Kocaman, D. Nock, and P. Trotter. 2022. “Rural Electrification: An Overview of Optimization Methods.” Renewable and Sustainable Energy Reviews 156: 111935. doi:10.1016/j.rser.2021.111935.
- Banco Interamericano de Desarrollo (BID) 2020. Misión de Transformación Energética y Modernización de la Industria Eléctrica [Energy Transformation and Electricity Industry Modernization Mission]. Bogotá: BID. https://www.minenergia.gov.co/documents/7686/Foco_4._Cierre_de_brechas_mejora_de_la_calidad_y_dise%C3%B1o_y_formulacion_eficient_JTF0ADK.pdf.
- Blechinger, P., C. Cader, and P. Bertheau. 2019. “Least-cost Electrification Modeling and Planning – A Case Study for Five Nigerian Federal States.” Proceedings of the IEEE 107 (9): 1923–1940. doi:10.1109/JPROC.2019.2924644.
- Bridge, B., D. Adhikari, and M. Fontenla. 2016. “Electricity, Income, and Quality of Life.” The Social Science Journal 53 (1): 33–39. doi:10.1016/j.soscij.2014.12.009.
- Burke, E., and K. Graham. 2014. Search Methodologies: Introductory Tutorials in Optimization and Decision Support Techniques. New York: Springer. doi:10.1007/978-1-4614-6940-7.
- Ciller, P., and S. Lumbreras. 2020. “Electricity for All: The Contribution of Large-scale Planning Tools to the Energy-access Problem.” Renewable and Sustainable Energy Reviews 120: 109624. doi:10.1016/j.rser.2019.109624.
- Come Zebra, E., H. van der Windt, G. Nhumaio, and A. Faaij. 2021. “A Review of Hybrid Renewable Energy Systems in Mini-grids for Off-grid Electrification in Developing Countries.” Renewable and Sustainable Energy Reviews 144: 111036. doi:10.1016/j.rser.2021.111036.
- Consejo Nacional de Política Económica y Social (CONPES) 2022. Documento CONPES 4075: Política de Transición Energética [CONPES Document 4075: Energy Transition Policy]. Bogotá: CONPES.
- Contreras, J., and Y. Rodríguez. 2016. “Incentives for Wind Power Investment in Colombia.” Renewable Energy. 87: 279–288. doi:10.1016/j.renene.2015.10.018.
- Departamento Nacional de Planeación (DNP) 2019. Conceptos Básicos Para un Mejor Uso de TerriData [Basic Concepts for a Better Use of TerriData]. Bogotá: DNP. https://terridata.dnp.gov.co.
- Domenech, B., M. Ranaboldo, L. Ferrer-Martí, R. Pastor, and D. Flynn. 2018. “Local and Regional Microgrid Models to Optimise the Design of Isolated Electrification Projects.” Renewable Energy. 119: 795–808. doi:10.1016/j.renene.2017.10.060.
- Drechsler, M., J. Egerer, M. Lange, F. Masurowski, J. Meyerhoff, and M. Oehlmann. 2017. “Efficient and Equitable Spatial Allocation of Renewable Power Plants at the Country Scale.” Nature Energy 2 (9): 17124. doi:10.1038/nenergy.2017.124.
- Eustachio, J., A. Caldana, L. Liboni, and D. Martinelli. 2019. “Systemic Indicator of Sustainable Development: Proposal and Application of a Framework.” Journal of Cleaner Production 241: 118383. doi:10.1016/j.jclepro.2019.118383.
- Fuso Nerini, F., R. Dargaville, M. Howells, and M. Bazilian. 2015. “Estimating the Cost of Energy Access: The Case of the Village of Suro Craic in Timor Leste.” Energy 79: 385–397. doi:10.1016/j.energy.2014.11.025.
- Galvis-Aponte, L., L. Moyano, and C. Alba. 2016. “La Persistencia de la Pobreza en el Pacífico Colombiano y Sus Factores Asociados [The Persistence of Poverty in the Colombian Pacific Region and Its Associated Factors].” Documentos de Trabajo Sobre Economía Regional 238: 1–57. https://www.banrep.gov.co/sites/default/files/publicaciones/archivos/dtser_238.pdf.
- Gaona, E., C. Trujillo, and J. Guacaneme. 2015. “Rural Microgrids and Its Potential Application in Colombia.” Renewable and Sustainable Energy Reviews 51: 125–137. doi:10.1016/j.rser.2015.04.176.
- Garces, E., C. Franco, J. Tomei, and I. Dyner. 2023. “Sustainable Electricity Supply for Small Off-grid Communities in Colombia: A System Dynamics Approach.” Energy Policy 172: 113314.113314. doi:10.1016/j.enpol.2022.
- Garces, E., J. Tomei, C. Franco, and I. Dyner. 2021. “Lessons from Last Mile Electrification in Colombia: Examining the Policy Framework and Outcomes for Sustainability.” Energy Research & Social Science 79: 102156. doi:10.1016/j.erss.2021.102156.
- Giannetti, B., F. Agostinho, C. Almeida, G. Liu, L. Contreras, C. Vandecasteele, L. Coscieme, P. Sutton, and C. Poveda. 2020. “Insights on the United Nations Sustainable Development Goals Scope: Are They Aligned with a ‘Strong’ Sustainable Development?” Journal of Cleaner Production 252: 119574. doi:10.1016/j.jclepro.2019.119574.
- Gómez-Navarro, T., and D. Ribó-Pérez. 2018. “Assessing the Obstacles to the Participation of Renewable Energy Sources in the Electricity Market of Colombia.” Renewable and Sustainable Energy Reviews 90: 131–141. doi:10.1016/j.rser.2018.03.015.
- Grunewald, P. 2017. “Renewable Deployment: Model for a Fairer Distribution.” Nature Energy 2 (9): 17130. doi:10.1038/nenergy.2017.130.
- Gupta, A., R. Saini, and M. Sharma. 2011. “Modelling of Hybrid Energy System – Part I: Problem Formulation and Model Development.” Renewable Energy. 36 (2): 459–465. doi:10.1016/j.renene.2010.06.035.
- International Energy Agency (IEA) 2022. The Energy Progress Report. Paris: IEA. https://www.iea.org/reports/tracking-sdg7-the-energy-progress-report-2022.
- International Renewable Energy Agency (IRENAI) 2018. Renewable Power Generation Costs in 2017. Masdar City: IRENA. https://www.irena.org/publications/2018/Jan/Renewable-power-generation-costs-in-2017.
- Karsu, Ö., and A. Kocaman. 2021. “Towards the Sustainable Development Goals: A Bi-objective Framework for Electricity Access.” Energy 216: 119305. doi:10.1016/j.energy.2020.119305.
- Kurnia, H., R. Masbar, Sirojuzilam, and Zulham. 2022. “Effect of Regional Planning on Social Welfare in the Islands and Mainland of Aceh Province.” Journal of Human Behavior in the Social Environment 32 (3): 356–374. doi:10.1080/10911359.2021.1900013.
- Lambert, J., C. Hall, S. Balogh, A. Gupta, and M. Arnold. 2014. “Energy, EROI and Quality of Life.” Energy Policy 64: 153–167. doi:10.1016/j.enpol.2013.07.001.
- Mandelli, S., J. Barbieri, R. Mereu, and E. Colombo. 2016. “Off-grid Systems for Rural Electrification in Developing Countries: Definitions, Classification and a Comprehensive Literature Review.” Renewable and Sustainable Energy Reviews 58: 1621–1646. doi:10.1016/j.rser.2015.12.338.
- Minenergia 2018. Plan Nacional de Electrificación Rural [National Rural Electrification Plan]. Bogotá: Minenergia. https://www.minenergia.gov.co/documents/10180/23517/47918-res_40809_020818.pdf.
- Moretti, L., M. Astolfi, C. Vergara, E. Macchi, J. Pérez-Arriaga, and G. Manzolini. 2019. “A Design and Dispatch Optimization Algorithm Based on Mixed Integer Linear Programming for Rural Electrification.” Applied Energy 233–234: 1104–1121. doi:10.1016/j.apenergy.2018.09.194.
- Mugisha, J., M. Ratemo, B. Bunani Keza, and H. Kahveci. 2021. “Assessing the Opportunities and Challenges Facing the Development of Off-grid Solar Systems in Eastern Africa: The Cases of Kenya, Ethiopia, and Rwanda.” Energy Policy 150: 112131. doi:10.1016/j.enpol.2020.112131.
- Nadimi, R. 2019. Relationship between Quality of Life and Energy Usage. Singapore: Springer. doi:10.1007/978-981-13-7840-9.
- Nadimi, R., and K. Tokimatsu. 2018. “Modeling of Quality of Life in Terms of Energy and Electricity Consumption.” Applied Energy 212: 1282–1294. doi:10.1016/j.apenergy.2018.01.006.
- Nguyen, C., and T. Su. 2021. “Does Energy Poverty Matter for Gender Inequality? Global Evidence.” Energy for Sustainable Development 64: 35–45. doi:10.1016/j.esd.2021.07.003.
- Nock, D., T. Levin, and E. Baker. 2020. “Changing the Policy Paradigm: A Benefit Maximization Approach to Electricity Planning in Developing Countries.” Applied Energy 264: 114583. doi:10.1016/j.apenergy.2020.114583.
- Picatoste, X., I. Novo-Corti, and D. Tîrcǎ. 2020. “Human Development Index as an Indicator of Social Welfare.” No Poverty. Encyclopedia of the UN Sustainable Development Goals, edited by W. Leal Filho, A. Azul, L. Brandli, A. Lange Salvia, P. Özuyar, and T. Wall. Cham: Springer. doi:10.1007/978-3-319-69625-6_42-1.
- Riva, F., and E. Colombo. 2020. “System-dynamics Modelling of the Electricity-development Nexus in Rural Electrification Based on a Tanzanian Case Study.” Energy for Sustainable Development 56: 128–143. doi:10.1016/j.esd.2020.04.001.
- Riva, F., E. Colombo, and C. Piccardi. 2019. “Towards Modelling Diffusion Mechanisms for Sustainable Off-grid Electricity Planning.” Energy for Sustainable Development 52: 11–25. doi:10.1016/j.esd.2019.06.005.
- Riva, F., A. Tognollo, F. Gardumi, and E. Colombo. 2018. “Long-term Energy Planning and Demand Forecast in Remote Areas of Developing Countries: Classification of Case Studies and Insights from a Modelling Perspective.” Energy Strategy Reviews 20: 71–89. doi:10.1016/j.esr.2018.02.006.
- Saldarriaga-Loaiza, J., J. López-Lezama, and F. Villada-Duque. 2020. “Levelized Cost of Electricity in Colombia under New Fiscal Incentives.” International Journal of Engineering Research and Technology 13 (11): 3234–3239. doi:10.37624/IJERT/13.11.2020.3234-3239.
- Salite, D., J. Kirshner, M. Cotton, L. Howe, B. Cuamba, J. Feijó, and A. Zefanias Macome. 2021. “Electricity Access in Mozambique: A Critical Policy Analysis of Investment, Service Reliability and Social Sustainability.” Energy Research & Social Science 78: 102123. doi:10.1016/j.erss.2021.102123.
- Sarkodie, S., and S. Adams. 2020. “Electricity Access, Human Development Index, Governance and Income Inequality in Sub-Saharan Africa.” Energy Reports 6: 455–466. doi:10.1016/j.egyr.2020.02.009.
- Sasse, J., and E. Trutnevyte. 2019. “Distributional Trade-offs between Regionally Equitable and Cost-Efficient Allocation of Renewable Electricity Generation.” Applied Energy 254: 113724. doi:10.1016/j.apenergy.2019.113724.
- Sengupta, M., Y. Xie, A. Lopez, A. Habte, G. Maclaurin, and J. Shelby. 2018. “The National Solar Radiation Data Base (NSRDB).” Renewable and Sustainable Energy Reviews 89: 51–60. doi:10.1016/j.rser.2018.03.003.
- Superservicios. 2019. Zonas No Interconectadas: Diagnostico de la Prestación del Servicio de DEnergía Eléctrica [Non-interconnected Zones: Diagnostic of the Provision of Electric Energy Services]. Bogotá: Superservicios. https://www.superservicios.gov.co/sites/default/files/inline-files/informe_sectorial_zni_2021%20%281%29.pdf.
- Tomei, J., J. Cronin, H. Arias, S. Machado, M. Palacios, Y. Ortiz, Y. Cuesta, R. Lemus, W. López, and G. Anandarajah. 2020. “Forgotten Spaces: How Reliability, Affordability and Engagement Shape the Outcomes of Last-mile Electrification in Chocó, Colombia.” Energy Research & Social Science 59: 101302. doi:10.1016/j.erss.2019.101302.
- Trotter, P., N. Cooper, and P. Wilson. 2019. “A Multi-criteria, Long-term Energy Planning Optimisation Model with Integrated On-grid and Off-grid Electrification – The Case of Uganda.” Applied Energy 243: 288–312. doi:10.1016/j.apenergy.2019.03.178.
- Unidad de Planeación Minero Energética (UPME) 2015. Integración de las Energías Renovables no Convencionales en Colombia [Integration of Non-conventional Renewable Energies in Colombia). Bogotá: UPME. https://www1.upme.gov.co/Paginas/Estudio-Integraci%c3%b3n-de-las-energ%c3%adas-renovables-no-convencionales-en-Colombia.aspx.
- United States Energy Information Agency (USEIA) 2022. Carbon Dioxide Emissions Coefficients. Washington, DC: USEIA. https://www.eia.gov/environment/emissions/co2_vol_mass.php.
- Viteri, J., F. Henao, J. Cherni, and I. Dyner. 2019. “Optimizing the Insertion of Renewable Energy in the Off-grid Regions of Colombia.” Journal of Cleaner Production 235: 535–548. doi:10.1016/j.jclepro.2019.06.327.
- Walther, T. 2014. Constraint Handler for Piecewise Linear Functions. Berlin: Zuse Institute. https://opus4.kobv.de/opus4-zib/frontdoor/index/index/year/2014/docId/4911.
- Wu, S., C. Li, and C. Wei. 2022. “Electricity Consumption as a New Indicator of Inequality.” Energy Research & Social Science 90: 102677. doi:10.1016/j.erss.2022.102677.
Appendix A.
Piecewise linearization: convex combination method
The convex-combination method is the most widely used Mixed Integer Linear Programming (MILP) formulation for piecewise linear functions. It uses convex combinations of two neighboring nodes, allowing the function values to compute between nodes. For this model, the logarithmic function (EquationEquation (5)(5)
(5) ) was split into j pieces, j = 1…1,000 for each subregion i.
and
from EquationEquation (5)
(5)
(5) are transformed to EquationEquation (11)
(11)
(11) and EquationEquation (12)
(12)
(12) where
and
are the nodes and
are the lambda multipliers. Each interval [
is also influenced by a binary variable
. EquationEquation (14)
(14)
(14) ensures that only one binary variable is 1 and the rest must be zero. EquationEquation (15)
(15)
(15) and EquationEquation (17)
(17)
(17) guarantees that if
= 1, only
and
are positives which implies that
. Further information about the method can be found in Walther (Citation2014).
(11)
(11)
(12)
(12)
(13)
(13)
(14)
(14)
(15)
(15)
(16)
(16)
(17)
(17)
Appendix B.
Subregions in the Colombian Pacific Coast
Table B1. Parameters by subregion.
The following are the economic parameters considered for the model (IRENA Citation2018; Tomei et al. Citation2020; Viteri et al. Citation2019):
Investment costs of solar systems with batteries: US$4,435 per kW.
Operation costs of solar systems: US$30 per kW.
Investment costs of diesel systems: US$650 per kW.
Operation costs of diesel systems: US$9 per kW.
Capacity factor of diesel systems: 90%.
Discount rate is applied following the regionalized discount rates proposed for energy projects in Colombia by Saldarriaga-Loaiza, López-Lezama, and Villada-Duque (Citation2020).