
Abstract
The concept of sharing, enabled by emerging technologies, is playing an increasingly important role in contributing to a transformation toward more sustainable transportation. This study aimed to contribute to the growing body of literature on on-demand transportation services, with a particular emphasis on sharing or pooling a ride when using services such as transportation-network companies (TNCs) and microtransit. The study conducted a shared mobility survey of over 2,500 respondents from selected locales across Texas—ranging from large urban areas to small cities and rural areas. We analyzed the survey data in detail using extensive statistical analysis and inferential techniques and adopted an analysis approach toward implementation-oriented research to address the gap between theory and practice. Demographic, as well as geographic and built-environment, factors were found to play an important role in determining whether users will opt for a shared or pooled service and/or how they perceive these alternatives. The findings highlight the importance of improving safety and security, increasing awareness of the benefits of ride-sharing, and designing appropriate policy measures to promote sustainable mobility. We identified potential operational improvements, government policies, and employer programs to improve shared-ride services and encourage their use, such as reducing uncertainty in shared rides and minimizing inconvenience for passengers. A critical finding was the need to prioritize operational improvements in shared-ride trips over solely relying on financial incentives to induce behavior change. Enhanced public awareness and education were also determined to be crucial regardless of the nature of improvements, policies, or programs that are implemented.
Introduction
Sharing the ride for sustainable mobility
With advancements in technology and data analytics, new mobility options have emerged, such as on-demand and app-based services, which could significantly affect travel behavior and demand. While these new mobility options have the potential to address transportation issues like traffic congestion and air pollution, well-designed policies and planning strategies are necessary, supported by a robust understanding of the role of these services in the overall transportation ecosystem.
Without policies meant to promote sustainability, these new transportation modes will only exacerbate existing problems in mobility and travel. Transportation-network companies (TNCs), microtransit, and other forms of on-demand transportation provide vehicles to users who otherwise would not have access to them, increasing the demand for cars. As more people start demanding cars, more drivers would turn to working for on-demand services to meet this demand, increasing the number of cars on the road. An analysis of TNCs in San Francisco found that between 2010 and 2016, these services were responsible for increasing vehicle miles traveled (VMT) by 13 percent and vehicle hours delayed (VHD) by 62 percent (Erhardt et al. Citation2019), contributing to increased traffic congestion in the downtown area of the city. A survey conducted in New York City revealed that 65 percent of users of ridehailing services would have instead relied on transit, walked, or biked if the services were not available to them (NYC DOT Citation2018). These findings imply that users might be substituting and avoiding green, low-carbon-emitting transportation modes in order to use ride-hailing services, contributing to more pollution and greenhouse-gas emissions (GHGs).
The concept of sharing, supported by the evolution of emerging technologies, is particularly important in transforming mobility and providing opportunities to increase shared-ride trips in vehicles. Instead of individuals traveling in a personal vehicle for every trip, having users pool rides together in the same vehicle based on a common destination, travel direction, or proximity to current routes would be a much more efficient use of resources. To make sharing a more prevalent and convenient part of sustainable mobility, further policies and improvements are needed. For example, increasing pooling rates among users of TNCs can be achieved through incentives and promotions (that can be provided by the service operators) for splitting rides, especially for trips to public transit stations, employment centers, and other designated locations. Microtransit services operated in partnership with public transit agencies play a critical role to fill gaps in service between the fixed-route network and group travel where fixed-route transit has not performed well.
By contrast, acquiring reliable information on these shared mobility services can be challenging as (potential) user preferences change and research is limited due to evolving business models, proprietary data, and hypothetical scenarios. As noted by Zhu et al. (Citation2022), the advantages may differ based on individual travel behavior and the supply of services provided by the companies offering shared mobility solutions. It is crucial for researchers, practitioners, and policymakers to track and monitor usage patterns to develop insights into the roles of these emerging and future mobility options in fostering sustainable practices.
On-demand shared-ride services: insights, operations, and economic perspectives
Sharing will be key if on-demand services are to have a future in a more sustainable world. If people who do not own a personal vehicle suddenly have access to one via the convenience of an app on their phone, they may be more likely to take a trip when they otherwise may not have, thus inducing more demand for cars. Alternatively, they may opt to substitute out a greener form of transport—such as walking, biking, or public transit—in exchange for using a private ride in an on-demand mode. Both activities have the potential to increase the number of cars on the road, in turn increasing VMT and GHGs.
Another possible source of inefficiency would be deadheading, or drivers cruising around without passengers, either to commute from their homes to major urban centers or to look for new customers between rides. An analysis of ridesourcing data from the city of Austin (Texas) in the United States found that a passenger was only present during 55 percent of the total miles driven by TNC drivers (Wenzel et al. Citation2019). That same study found that a best-case scenario (30 percent of all rides are shared) would increase net energy usage by 41 percent, while a worse-case scenario (15 percent of all rides are shared) would increase net energy use by 90 percent, with both accounting for alternative modes of transport TNC rides would replace. Clearly, shared rides have the potential to reduce VMT and energy consumption, however, the exact tipping point at which a net negative energy use can occur may be higher than what is currently seen in the market without any sort of intervention.
Several studies have aimed to measure the rates of shared-ride or pooled trips involving new mobility services. For instance, a 2016 dataset from Lyft found that 29.2 percent of all Lyft trips (32 percent for peak-hour trips) were pooled in Los Angeles County (Brown Citation2019). In 2017, pooled rides made up 20 percent of all Uber rides and 40 percent of all Lyft rides in the United States (Shaheen and Cohen Citation2018). In 2017, UberPool trips made up 20–30 percent of total Uber rides in India (Meshram, Choudhary, and Velaga Citation2020). A series of surveys conducted in California between 2018 and 2019 found that 12–15 percent of TNC trips were pooled (Circella et al. Citation2018). In New York City in 2018, around 60 percent of microtransit trips on Via were shared (Schaller Citation2018). For DiDi Chuxing trips in China, ridesplitting made up less than 8 percent of total trips (Li et al. Citation2019; Ma, Koutsopoulos, and Zheng Citation2019).
An opportunity to pool a greater percentage of rides is possible for TNCs and microtransit services based on their attractiveness to consumers compared with more traditional shared mobility options. Enticing passengers to use such pooled services typically involves providing a discounted fare if they will share the ride with others matched with their vehicle on the fly, which may mean additional pickups, drop-offs, or route deviations during their trip. For a TNC ridesplitting service, riders may be grouped with other riders or may end up traveling alone if there are no suitable matches for their travel pattern (Morris et al. Citation2020). Microtransit services do not provide the option to take an exclusive ride but instead have a lower fare for the service compared to a ridesourced trip from a TNC or taxi; conversely, microtransit fares are typically higher than traditional public transit but may be more convenient for some travelers.
Most pooled trips on TNCs or microtransit services require the traveler to meet the vehicle at a designated pickup point or walk to a dynamic stop rather than be picked up at their initial location. For example, services for Uber Express Pool and Lyft Shared Saver were launched in some markets in 2017; these services resemble typical microtransit services in that they require passengers to walk a short distance to/from their pickup or drop-off point (Circella et al. Citation2018). The goal of these service designs is to increase operational effectiveness while reducing delays for passengers already in the vehicle (Schaller Citation2021). In return, the traveler is effectively trading the personal convenience of a direct pickup for lower fare prices (compared to an exclusive-ride service product) (Hawkins Citation2018).
For TNCs, the economic advantages of ridepooling services are dependent on the match rate, or the percentage of rides requested that are paired with another ride (Huet Citation2015). A calculation based on data from ridesourcing services in Toronto found that, while 15 percent of ridesourcing trips were pooled, only 52 percent of pooled trips were actually matched. Trips beginning in downtown Toronto had a higher probability (65 percent) of being matched, while trips between 10 am and 3 pm were least likely to be matched (Young, Farber, and Palm Citation2020). In 2018, Uber launched the Express Pool in a few major cities to improve its match rate for pooled trips by providing improved travel times for riders. This product—designed more as an exclusive-ride Uber service—was distinct from previous products such as Uber Smart Routes or UberHop that relied upon public transit-design concepts including traditional bus routes and fixed points, respectively (Hawkins Citation2018).
While challenges exist, a higher percentage of pooled rides can still be preferable from a sustainability perspective when supported by effective matching algorithms, optimized fleet operations, appropriate incentive structures, behavioral shifts, and robust system-level analysis. If higher rates of users are matched together for rides, there are several benefits, not just for individual users and society, but for suppliers as well. The shift from single-occupancy vehicle (SOV) use to shared or pooled rides presents several opportunities for transportation-service providers, vehicle manufacturers, infrastructure developers, and other suppliers to adapt and provide services and solutions that support the growth of shared mobility and contribute to sustainable transportation ecosystems. For example, transportation-service providers can develop innovative technology platforms, facilitate efficient matching algorithms, and provide seamless and equitable user experiences. Vehicle manufacturers can adapt their production strategies and develop vehicles that address barriers, such as those related to accessibility and safety, to sharing rides for improved passenger experience and trust in the vehicle.
An analysis of vehicle-trajectory data from taxis in Beijing found that ridepooling could reduce VMT by 33 percent when implemented on a large scale across the entire fleet. Widespread shared rides in taxis in the region could likewise save 28.3 million gallons of gasoline and reduce carbon dioxide (CO2) emissions by 2,392 tons annually (Cai et al. Citation2019). By utilizing effective fleet-management systems, operators can improve resource allocation, minimize deadhead mileage, lower overall operational costs, and reduce energy consumption, thereby increasing the sustainability of their operations. If proper methods of pairing users together are implemented, savings (such as regarding fuel and labor costs) could prospectively offset the loss in revenue from user incentives and the costs of running a more complex matching algorithm. Users would see cost savings in the form of sharing incentives, and everyone collectively could benefit from having reduced emissions, congestion relief, and cost savings. Pooled rides could be a way to meet the ever-growing demand for transportation services while mitigating some of the environmental, health, and economic effects of SOVs.
The study in context
In recognition of its importance in the overall transportation ecosystem, this study contributes to the growing literature on new mobility options with a particular focus on pooling through on-demand transportation services (from TNCs and microtransit services). An extensive review of existing pooled travel-choice studies—including factors affecting pooling as well as existing or suggested strategies for encouraging pooled rides—is detailed in Hansen and Sener (Citation2022). Building on insights obtained from this prior study, the work reported here is based on survey-based research—through a rich set of data obtained from an online survey conducted in Texas in 2022—to explore the factors influencing service usage and trends, barriers to using shared mobility services, and potential improvements to make sharing or pooling a trip more attractive. The study made a concerted effort to adopt an inclusive language and framework, focused on policy improvements, and aimed to provide a more nuanced understanding of the transportation needs and preferences of communities.
Our approach chose to bundle microtransit and pooled rides on TNC services as both involved sharing rides with non-friends or family members in a vehicle for an on-demand service. For both services, a trip is (usually) requested spontaneously through a smartphone app (or else using a web platform to input the trip request), then a vehicle is matched with the rider in real-time based on dynamic algorithmic routing. For microtransit, the service is inherently meant to share rides with other traveling parties. For TNCs with pooled rides and ridesplitting options, riders directly choose whether they are willing to share the ride with another party. In both cases, riders are making a choice of whether to use the service when making their trip through an on-demand travel option.
While studying shared rides within the broader concept of sustainable mobility, we have adopted the definition of sustainability developed by the United States Environmental Protection Agency (USEPA Citation2022) which emphasizes fulfilling current needs without sacrificing the capacity of future generations to meet their own needs, and “is about taking action to protect our shared environment—air, water, land, and ecosystems—in ways that are economically viable, beneficial to human health and well-being, and socially just in the long term.” Accordingly, our work follows the sustainability framework that acknowledges the interconnectedness of the environment, economy, and society (as defined by USEPA) and thus the principles of strong sustainability, which “aims for the maintenance of economic, environmental, and social capital through an efficient use of resources and by replacing non-renewable natural resources with renewable ones” (de Oliveira Neto et al. Citation2018).
Assessing sustainability, particularly in the transportation sector, is a complex task. By adopting a strong sustainability perspective, we aim to explore the potential of promoting shared rides as a sustainable transportation solution while considering broader societal benefits and the well-being of future generations. Our work addresses multiple dimensions of sustainability, which can be assessed through indicators such as modal split, vehicle occupancy rate, travel experience (e.g., distance, time, and cost) as well as user satisfaction.
The remainder of the article is structured as follows. The next section describes the methods, including the shared mobility survey, with details of the data and methods used. The third section presents the survey-data analysis through an extensive discussion of the findings related to pooling or sharing a ride when using on-demand transportation services. For this undertaking, we adopted an approach that aimed to make the research more implementation-oriented and applicable. The final section concludes the article with culminating remarks on emerging mobilities and sharing a ride.
Methods
Survey design and administration
In this study, an online survey (shared mobility survey) was developed and implemented to examine on-demand transportation services with a focus on pooling decisions among Texas residents. The researchers received approval from the Institutional Review Board (IRB) prior to collecting data (IRB2021-0699M).
The survey was designed to collect a rich set of data from participants, including the following:
Individual demographics, socioeconomic characteristics, work-related characteristics, and household characteristics.
Use of various transportation modes for travel in participants’ local area.
Use of on-demand transportation services and pooling, including trends, attitudes, perceptions, and concerns.
Potential improvements that could make sharing/pooling more attractive for participants.
We developed an electronic survey using Qualtrics survey software that was administered to an online panel through Qualtrics to complete the fielding process. Qualtrics builds samples from multiple sources (through certified sample partners) instead of relying on a single panel, checks every IP address, and uses digital fingerprinting technology to exclude duplication and ensure validity. Prior to survey deployment, each sample from the panel base is proportioned to the general population and then randomized. Qualtrics uses niche panels created through specialized recruitment campaigns to access hard-to-reach groups. Panel respondents are compensated based on the length of the survey, their specific panelist profile, and the difficulty of acquiring a target (Qualtrics Citation2014).
The soft launch of the survey was initiated in early February 2022. Following review of the survey data from the soft launch, the full launch was initiated in late February 2022, and the survey ended in early May 2022. The survey was administered in both English and Spanish to persons 18 years old or older who lived in selected cities in Texas. Nearly all surveys were completed in English (98 percent in English versus 2 percent in Spanish). This is reflective of the 3 percent of participants who said a language other than English was the primary language spoken at home. Responses indicated that 35 percent of the sample spoke a language other than English at home, which is almost identical to the share of all Texans who do so (USCB Citation2022), implying the survey was not biased against multilingual or non-English speakers.
The mean time to complete the survey was 24 minutes, while the median time to complete the survey was 17 minutes. Quotas were established to ensure that the sample was well-balanced and representative across a variety of demographic characteristics, including age, gender, race, and income. Quotas were also used for the study area that included ten Texas cities—ranging from large urban areas to small cities and rural areas—where microtransit services and TNCs were in operation at the time of the survey. These cities included Arlington, Austin, Bastrop, Dallas, Denton, Edinburg, Houston, Lubbock, San Antonio, and Terrell. shows the spatial distribution of these cities in the study area, together with the final sample size for each city. Even though some cities did have very small sample sizes, constituting a relatively minor portion of the overall sample, their inclusion remains valuable to the analysis as they often represent smaller and more rural areas. Excluding them from the analysis could potentially introduce bias toward larger, metropolitan areas.
Figure 1. Study-area cities in Texas and their final survey-sample sizes.
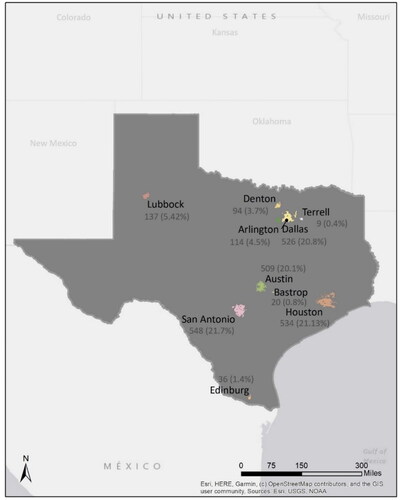
The study-area cities targeted within Texas for the survey each have/had either microtransit services and/or pooled-ride TNC services available for riders to use (during the execution of the shared mobility survey). Service examples include Arlington OnDemand in Arlington, Via Link in San Antonio, Community Connector/curb2curb in Houston, GoLink in Dallas (which includes Uber as a provider), Lewisville Lakeway On-Demand in Denton, Citibus On-Demand in Lubbock, Pickup in Austin, CARTS Now in Bastrop, STARNow in Terrell, and Edinburg FAST RIDE in Edinburg. The study looked at both shared rides in microtransit and TNCs together as some TNC services allow for pooled rides and ridesplitting between riders of different traveling parties.
The data were reviewed throughout the fielding process to meet the sample targets. Toward the end of the fielding—when it was not feasible to gather more data from a particular group—some of the quotas were relaxed to allow for larger sample sizes. Qualtrics was able to determine nonmeaningful responses (i.e., responses from speed fillers who randomly select options to maximize their financial returns) and filter them out. Additional checks were performed during data collection and review prior to data analysis.
Survey-data analysis
We analyzed the survey data using a combination of univariate and bivariate descriptive statistics, as well as statistical inferential techniques. The focus of the initial analysis was to examine attitudes and perceptions as well as trends in sharing or pooling a ride through on-demand transportation services (particularly TNCs and microtransit services). The shared mobility survey included questions to establish an overall understanding of participants’ attitudes toward shared-ride services. A 5-point Likert scale was used to convert the qualitative responses to numerical values: extremely positive was assigned a numerical value of 2, somewhat positive was assigned a numerical value of 1, and so on until extremely negative was assigned a numerical value of −2. We calculated the average score for each population of interest and conducted a Kruskal-Wallis test to determine whether the mean score was the same across all populations for each type of service.
A binary logistic regression model was then developed using data from respondents who had reported using one or more on-demand transportation service to examine who is more likely to share a ride when using such services. Survey respondents were asked if they have ever, “shared, split, or pooled a ride using a TNC, taxi, or on-demand transit service?” This binary outcome (“yes” or “no”) served as the dependent variable in the model. During the model development, various functional forms were tested to explore the relationships between the explanatory variables and the dependent variable. For categorical variables (such as household income), one category was designated as the base or reference category, while the other categories were transformed into binary indicators—accounting for the effects of different categories while providing valuable insights into the decision-making process. The final variable specification was obtained through a systematic process of eliminating variables found to be statistically insignificant, parsimony in representing variable effects, and intuitive considerations. In the final model, all explanatory variables, with the exception of Technology Adoption, were classified as binary dummy variables. Technology Adoption was a factor with three levels, indicating whether survey participants were early adopters of new technology, late adopters, or those who rarely if ever adopt new technology.
We conducted detailed descriptive statistics for the rest of the analyses. First, the survey data was examined to investigate the trip-related characteristics of shared-ride services in terms of day of week and time of day for various trip purposes, as well as shared vehicle occupancy. The relevant survey questions for this analysis were posed to respondents who indicated that they had previously shared a ride or were willing to share a ride while using on-demand transportation services. Next, barriers and solutions to encourage sharing or pooling were examined together with potential improvements that could be implemented by policymakers and agencies to make sharing or pooling a trip more attractive for individual travel needs. The analysis started with an examination of factors that positively or negatively affected individuals’ satisfaction/dissatisfaction with sharing a ride. To achieve this, participants were asked if they generally felt satisfied with their trips when they selected a shared/split/pooled ride. Based on their answers, they were then asked what positively or negatively affected their level of satisfaction. Several questions were also posed to examine changes that could be made to improve shared-ride services and encourage individuals to use them. We identified recommendations related to operational improvements, government policies, and employer programs.
Results and discussion
Data descriptives and characteristics
We collected a total of 2,527 usable surveys. displays the characteristics of participants in the analytical sample, as well as the Texas population (based on the selected demographic quotas). Compared to the statewide population data from the American Community Survey 2020 (USCB Citation2022), respondents skewed slightly toward younger age groups and females. Hispanics and people in the highest income bracket (>$100,000) were slightly undersampled compared to the Texas population at large. Overall, the sample was fairly representative of the entire adult population of the state.
Table 1. Comparison of the survey sample and the Texas population.
Online surveys are inherently biased against people with limited or no Internet access, producing possible issues for any analysis. Uniformly distributed Internet access among different groups could lessen this bias, but prior research has shown that such uniformity does not exist. The Pew Research Center (Citation2022) found that, as of 2021, 99 percent of those aged 18–29 used the Internet, while only 75 percent of those aged over 65 did. They also found that 99 percent of those who made over $75,000 annually and 98 percent of college graduates used the Internet, compared to 86 percent of those who made under $30,000 annually and 86 percent of those who had a high school education or less, respectively. They did not, however, find significant differences in Internet use across race, gender, or community type, with 95 percent, 94 percent, and 90 percent of urban, suburban, and rural respondents using the Internet, respectively. These rates of Internet use, while not identical, are similar enough that they can explain why prior studies have shown no statistically significant difference in online survey-response rates between rural and urban residents (Boyer, Adams, and Lucero Citation2010) and across different annual family incomes (Jang and Vorderstrasse Citation2019). These prior results are a positive sign of the efficacy of the results of this article, but efforts to make online surveys more expansive and inclusive are critical and expected to yield better results.
While valid concerns have been raised regarding potential bias attributable to online survey methods and financial incentives for participants, existing research has shown that the positive aspects of these methods and strategies outweigh the negative aspects. For example, an online survey of undergraduate students at a midwestern American university found that financial incentives not only improved the response rate of participants, but they also enhanced the representativeness of the sample in relation to the target population (DeCamp and Manierre Citation2016). Although some differences between the sample and the true population proportions were observed in this study, the researchers felt these differences were minor enough not to be significantly influential to the analysis. This is especially important considering the focus on behavioral patterns—an emphasis shared with several prior studies.
Key findings and implications
Attitudes toward shared-ride services
Of the 2,527 survey participants, 1,459 (58 percent) said they have never shared, split, or pooled a ride using a TNC, taxi, or on-demand transit service, while 1,068 (42 percent) reported that they had shared. Out of the 1,068 people who confirmed using shared-ride services, around 2 percent indicated using them daily, and more than half said that they had used them only a couple of times. However, not all of these respondents were current users of on-demand transportation services (TNCs, taxis, and on-demand transit). At the time of the survey, 1,337 people (53 percent) said they currently used one or more on-demand transportation services. Of these current users, 730 (55 percent) said they had shared rides while using these services.
Roughly half of the respondents were positive toward shared services, around 16 percent were negative, and one-third were neither positive nor negative. However, important variations were observed across different groups. Using the Kruskal-Wallis test, details the attitudes toward shared-ride services based on the various sociodemographic characteristics of the survey participants.
Table 2. Attitudes toward shared-ride services based on select characteristics.
The results showed a significantly higher mean score among male respondents compared to female respondents, indicating a more positive attitude toward shared-ride services. Many of the safety concerns females might have regarding solo travel through on-demand transportation services also exist for pooled rides and may in fact be compounded. A survey conducted across 16 metropolitan areas in the United States found that men and women were equally likely to try pooled-ride services, but women had a higher likelihood of abandoning them, citing safety as the primary concern (Morris et al. Citation2019). In addition to worrying about a potential assault or unwanted advances from drivers, females may consider their fellow riders as potential threats as well.
Attitudinal differences related to age mimic the previous trends observed for on-demand services: shared-ride services were viewed most positively by respondents aged 25–34 and 35–44 and most negatively by respondents 65 and older. Here, technology and age may be related; the median age of respondents who said they tend to be the last to adopt new technology was 12 years older than respondents who said they were among the first to adopt the technology. These early adopters had the most positive view of shared-ride services compared to other population groups. Conversely, the last adopters had the most negative view of shared-ride services across all groups, with almost half of the respondents saying they had neither a positive nor negative attitude toward shared rides. This finding suggests that older people either tried the service and were indifferent toward it or, more likely, never tried the service. The older adults may already face technology-related barriers when accessing on-demand services; asking them to also share the ride may present an additional disincentive. The older adults may also tend to have a disability that makes shared-ride services an inconvenience more often than younger individuals.
Respondents with no disabilities had more favorable opinions toward sharing rides than respondents who had at least one disability. The same set of challenges noted for disabled persons using on-demand transportation services, in general, exists when sharing rides; respondents with disabilities may need additional space or facilities that the driver is unable to provide. Other passengers sharing the limited space would probably cause more inconvenience, and people with disabilities may fear discrimination from other passengers as a result.
Morris et al. (Citation2019) found that Black or Hispanic groups had a higher probability of trying pooled services but were also more likely to discontinue using the service. Despite the potential risks of discrimination detailed in previous studies (Ge et al. Citation2016), and with the added risks of discrimination from fellow passengers, Black or African-American respondents were still much more likely to have positive attitudes toward shared rides than White respondents. The results highlighted similar trends of positive attitudes among other nonwhite population groups including Asians, Native Hawaiian/other Pacific Islanders, and Native American Indian or Alaska Natives. Higher mean scores for Hispanic respondents, compared to non-Hispanic respondents, also indicate a more positive attitude toward shared rides. These findings are consistent with previous literature; surveys conducted in Dallas, Texas, in 2017 and Austin, Texas, in 2019 found that non-Hispanic Whites had a lower propensity to choose pooled rides (Kang et al. Citation2021; Lavieri and Bhat Citation2018). Attitudinal differences related to income also mimic the previous trends observed for on-demand transportation services.
Attitudes toward shared rides were more favorable as income levels increased, which is surprising considering that shared rides tend to be cheaper and thus more accessible to lower-income passengers. The financial benefits of sharing rides appear to be outweighed by the disadvantages. This finding is contradictory to previous literature, which has tended to find lower-income users choosing the pooled option. For example, a survey of TNC users in China found that over 75 percent of ridesharing users were from lower-income households (Chen et al. Citation2021). In California, respondents with incomes less than $35,000 were more likely to choose a pooled ride, and a higher proportion of shared rides in Los Angeles occurred in lower-income neighborhoods (Brown Citation2019; Shaheen et al. Citation2021). These results may suggest that despite financial incentives to make them cheaper, shared-ride services may still be beyond the reach of many low-income households, thus explaining their negative opinions of the service.
Use of shared-ride services
To avoid having a bias toward negative outcomes, the binary logit model—outlined in the previous section—included only the 1,337 individuals who reported current usage of one or more on-demand services. The final sample size for the model was 1,321 respondents after cleaning the data to account for missing values in the explanatory variables (mainly people who did not disclose their household income).
The final model specification contains a couple of variables that were statistically significant at only the 0.10 level of significance; however, they were retained in the model due to their potential to provide guidance in future studies. All other variables were statistically significant at the standard 0.05 level of significance. The final model results showed a good model fit with a statistically significant chi-square statistic.
provides the results of the binary logit model for shared-ride service users—to examine who is more likely to share a ride—including coefficients of the final logistic regression, as well as their corresponding t-statistics and p-values. The table also includes the sample statistics for each model variable.
Table 3. Binary logit model results for shared-ride service users.
Older respondents were less likely to pool than younger ones—as consistently shown in the literature (Gehrke and Reardon Citation2021; Moody and Zhao Citation2020). Specifically, those respondents aged 18–34 were 34.2 percent more likely to share a ride than their older peers. As previously shown in , respondents aged 25–34 had the most favorable opinion of sharing rides, while respondents aged 65 and older had the least favorable opinion. The technology-adoption variables had the largest coefficients and thus the largest impact on the probability a respondent would opt to share a ride. Respondents who tended to be among the earliest adopters of new technology were 142.3 percent more likely to share their ride than respondents who lagged in the adoption. Because many ridesharing and on-demand services are either through an online platform or mobile app, they oftentimes require the use of a smartphone and a certain level of technology savviness. This technology requirement is often to the detriment of senior citizens—while younger travelers are typically more comfortable with smartphone apps, most older riders prefer scheduling rides over the phone because they want to speak directly to someone when providing information, asking questions, or reporting issues (Bayne et al. Citation2021).
Male respondents were found to be 40.5 percent more likely to share a ride compared to female and nonbinary and third-gender respondents. A potential reason for this is safety, with women citing concerns over sexual harassment or assault (Ge et al. Citation2016; Panjwani Citation2018). Victims of intimate partner violence were even more likely to report being concerned about unwanted attention and stalking behavior (Silva, Andrade, and Maia Citation2018). According to a study by Tang et al. (Citation2021), the larger the number of strangers that are in the car, the more likely women are to feel uncomfortable, with one exception—a gender-dedicated system where only riders and drivers of the same gender would be present in the vehicle. This type of system could be preferable for women than the standard, gender-free system of randomly connecting the closest rider and driver (Tang et al. Citation2021), but more research is needed for its potential implications and true benefits for all genders.
As noted previously, race has a complicated relationship with TNC use. While White, Black, and Hispanic users do not significantly differ in their use of TNCs in general (Smith Citation2016), multiple studies have shown that non-Hispanic Whites are less likely to share a ride through a TNC (e.g., Kang et al. Citation2021; Lavieri and Bhat Citation2018). The model results did not indicate race to be a sufficiently influential covariate in predicting whether someone will share a ride, with one exception—whether someone was Hispanic or not was found to be significant at the 0.05 level. Respondents who identified as Hispanic were 30.5 percent more likely to choose a shared-ride option than respondents who did not, consistent with the literature (Kang et al. Citation2021; Lavieri and Bhat Citation2018).
The binary variable indicating whether someone was deaf or had serious difficulty hearing was significant at the 0.10 level and surprisingly found to have a positive coefficient, implying that respondents who had hearing difficulties were 51 percent more likely to share a ride than respondents who did not. While most individuals with a disability may be less likely to share a ride based on the challenges that they face (e.g., needing a wheelchair or service animal to travel), those who are deaf or have serious difficulty hearing could theoretically book and complete a trip via an on-demand transportation service by using an app to schedule rides and select trip types. These individuals may complete their travel without ever needing to communicate with the driver or other passengers, thus making them more comfortable with sharing. The concept of sharing a ride may also be appealing to this demographic due to the potential for support and assistance in communicating with other passengers. Future research would greatly benefit from a thorough investigation of these potential factors to create effective strategies for people with disabilities to share rides.
Education and income variables followed similar patterns. Respondents who had no post-high school education or training were 24.6 percent less likely to share a ride than respondents with higher education levels, and respondents who made less than $25,000 a year were 30 percent less likely to share a ride than their higher-income peers. The education effect was consistent with previous findings. For example, Vinayak et al. (Citation2018) found that college-educated individuals were more likely to be pro-environment, with a pro-environment attitude being a predictor for sharing rides because shared rides would mean fewer cars on the road and thus less pollution. The relationship between income and willingness to share rides remains disputed; select studies found that lower-income individuals were more likely to share rides (Brown Citation2019; Chen et al. Citation2021; Gehrke and Reardon Citation2021; Shaheen et al. Citation2021), while the findings in this study and by Moody and Zhao (Citation2020) indicated that higher-income individuals were more willing to share rides. Lower household-income levels did not indicate a greater willingness to share rides on on-demand services, meaning that other perceived downsides outweighed the benefit of lower trip costs; this finding implies that incentives may need to be increased to make sharing rides more attractive and attainable for those in the lowest income brackets. Only 37.6 percent of those in the lowest income bracket reported being early adopters of new technology (compared to 55.1 percent of the model sample) while 19.9 percent said they were among the last to adopt new technology, if at all (compared to 8 percent of the model sample). This pattern may be attributable to the typical initial high cost of technology when first arriving on the market, leading lower-income individuals to wait until the technology becomes somewhat outdated and prices begin to fall. This hesitancy to try new technology may also explain their lower propensity to use shared-ride services. It is also possible that others on the trip, including the driver and passengers, may not want to pass through low-income neighborhoods to pick up and drop off passengers, thus effectively denying low-income individuals the ability to share rides with those respondents from other neighborhoods. Also, note that some participants in this study have experienced such discrimination; expressing an interest to share a ride but unable to do so because no one paired with them due to their location.
Perhaps a more perplexing finding from the survey is that respondents from households with no children were 30.3 percent less likely to share a ride than households with kids. Bringing younger passengers along on a trip would require additional seats, making it harder to find vehicles with enough space for the primary user, their children, and other travelers. Also, many parents may be uncomfortable bringing their kids into a car with strangers, particularly if the parent is a woman traveling alone with her children. Furthermore, because kids may make noise or be hard to control in a car, causing a disturbance to other passengers, parents may want to avoid the hassle and have their own car. All these reasons highlight why this result seems to be counterintuitive. It may be that respondents did not consider children as part of the trip journey while taking shared-ride services. Alternatively, they may have been more mindful of potential expenses due to additional child-care costs, or they may have been more accustomed to the concept of sharing due to the presence of children in the household. In any case, this result necessitates a thorough investigation into its possible causes.
Respondents who reported having a hybrid workplace—where they spend some time working at home and some time working outside of the home—were 46.5 percent more likely to share a ride than respondents who exclusively worked from home or worked outside of the home. Several reasons might be related to this finding. For example, respondents who travel to an office or somewhere outside of their home daily for work may choose to take some other form of transportation that has more regular travel times, such as a personal car, rather than ordering and waiting for an on-demand service. If they do use an on-demand service, they may not want the added uncertainty that comes with other passengers and stops during their commute. By contrast, respondents who work in a hybrid environment may be more likely to use TNCs or other on-demand services on the few days that they go in to work because they may not need the same consistency as daily commuters or may have more flexibility in terms of their work arrival time.
Respondents who had a positive attitude toward sharing a ride, frequently used transit, and often used on-demand services were 104 percent, 66 percent, and 58 percent more likely, respectively, to share a ride. These results are intuitive. People who have positive attitudes toward sharing or pooling a ride are expected to be more likely to share than people who have a negative outlook. Riders who frequently use transit and on-demand services may not have a personal car or feel comfortable traveling in public with strangers—both good reasons to share a ride. If someone frequently uses on-demand transportation anyway, they might be more inclined to share the ride to save money on their regular trips.
Trip characteristics of shared-ride services
The responses were generally consistent across trip purposes, illustrating a higher willingness to share/split/pool rides with strangers only if not in hurry. Participants were more likely to share rides to/from the airport, and less likely to share rides for school/college/training and medical or therapy appointments.
In terms of the time of day, most respondents indicated that they would be willing to share a ride only during the day, regardless of the day of the week, for most trip purposes. Exceptions were noted for social and leisure activities and airport trips; respondents were more willing to share a ride for these trip purposes at any time of day.
In terms of vehicle occupancy, the highest percentage of respondents reported a willingness to share a ride with two to three people (47 percent), while 40 percent of respondents reported a willingness to share a ride with only one other person. Among the remaining respondents, 13 percent reported no preference, and 6 percent reported a willingness to share a ride with more than three people. Note that the size or type of the vehicle was not specified in the question, but respondents were asked to consider all forms of on-demand transportation services (e.g., TNCs, taxis, microtransit).
Positive and negative aspects of shared-ride services
provides the top five positive and negative factors identified for each group (i.e., for respondents who indicated being not satisfied with sharing a trip as well as those who indicated being satisfied with sharing a trip). Respondents were given a list of 10 positive and 12 negative issues to choose from and were also given a chance to specify any other factors, in writing, that positively or negatively impacted them.
Table 4. Top five factors affecting satisfaction among shared-ride service users.
Respondents identified the same top five factors that negatively affected them—generally related to a time extension or unreliable travel time due to additional passengers, unpleasant or contagious passengers, or general discomfort talking to strangers—regardless of their level of satisfaction. The order of the factors, however, differed slightly, and the percentages of negative factors were higher across the board (anywhere from 9 to 21 percent) for those not satisfied with sharing a trip. While those who were unsatisfied did show a relatively higher share of concern about these issues, the marginal difference of as little as 9 percent between satisfied and unsatisfied customers indicates that these concerns are pertinent to all users. Addressing these concerns would benefit a larger share of the population. The positive factors were also generally consistent between the two groups, with the top positive factor being cost savings from sharing a ride. Respondents also mentioned the mode’s convenience and comfort (when compared to other modes of transit or active transportation), the possibility of meeting new people (although this only appeared in the top five for those respondents who were generally satisfied with their trip on a shared ride), and the belief that they were helping the environment. Minor differences were observed between males and females. Females ranked being helpful to the environment higher than males, while males ranked comfort higher than females.
It is interesting to note that both sets of users rated germs from contagious passengers as one of their top concerns, with those who were satisfied with shared trips saying it was their biggest priority. These numbers are likely higher than expected because of the COVID-19 pandemic making people more conscious about their health and spreading diseases. To gauge the effects of the pandemic on transportation behavior, survey participants were asked if their prior (pre-pandemic) use of various modes of transport differed from their current use, as well as how they anticipated their use of those modes to change once COVID-19 is no longer a threat. For all forms of on-demand services, at least half of respondents said they either did not use that service and would not do so in the future or that their usage frequency of that service had not been influenced by COVID-19. Only very small percentages (between 4.1 percent and 7.9 percent) indicated any reduction (current or anticipated) in the frequency with which they used any on-demand service. Many of those who currently do not use or do not anticipate using on-demand services in the future, particularly pooled services, may be doing so due to the health risks associated with traveling with strangers.
Revised versions of these questions were also posed to respondents who indicated that they had not previously shared a ride. Respondents who reported that they had not used shared-ride services but would/might (not) consider sharing a trip—if the service were available in their area or feasible for their trips—were asked why they would (would not) do so. summarizes these responses.
Table 5. Top five factors affecting satisfaction among shared-ride service nonusers.
Potentially getting paired with unpleasant strangers was the top factor adversely affecting respondents who indicated that they would not consider sharing a trip. This factor was found to be especially critical for females compared to males, who were shown in previous studies to be more intimidated in shared rides than their male counterparts (Sarriera et al. Citation2017). While extended travel time was one of the top five factors, it was not as important to nonusers as experienced users of shared-ride services. Positive factors identified by respondents who would consider sharing included monetary savings (most important) and a sense of contributing to the environment. Lower-income respondents ranked cost savings higher, while higher-income respondents ranked environmental considerations higher.
Potential improvements to shared-ride services
provides the top five recommendations related to operational improvements, government policies, and employer programs that could be implemented by various entities.
Table 6. Top five recommendations to improve shared-ride services.
To identify potential operational improvements to on-demand services that would make sharing and pooling rides more attractive, survey participants were presented with a list of potential changes to service operations and asked to select those actions that would make them more likely to personally share a ride with a stranger when using an on-demand service (first column in ). The top three operational improvements recommended by respondents—having a guaranteed drop-off window, providing financial compensation for late trips, and limiting the number of stops added to the trip—all sought to guarantee that customers’ travel times were not excessively lengthened, although they were selected at only slightly higher rates than the next two improvements. This finding represents one of the toughest compromises to be made when sharing rides: finding an optimum route and service for the collective without inconveniencing the individual. In other words, the findings may indicate that travel time of sharing rides may be a more important factor than those factors previously discussed and more important than the lower cost/cheaper fares for agreeing to split a trip on a taxi or TNC as well as using microtransit service. A future survey that asks participants to rank which broad “cluster” of policies they would prefer or issues they care about (e.g., relating to cost, safety, convenience) may give some clarity on which set of changes could have the largest impact on consumer behavior and allow for more targeted policies.
The next-ranked operational improvements—introducing video surveillance and broadcasting car location to trusted friends and family—addressed issues regarding safety. Approval of these ideas may indicate that higher safeguards against potential safety incidents are more important to riders than lessening personal privacy through these measures. Regardless, for some persons, the fear of being harassed or worse while riding in a vehicle with a stranger is still a huge barrier impeding the possibility of increasing their willingness to take a shared ride. Further policy and operational improvements that can better guarantee safe as well as comfortable ride experiences will likely need to be developed to influence behavior for these travelers.
All respondents were also presented with a list of potential policy changes that local and regional governments could implement to encourage more pooling (second column in ). The highest-ranked recommendation was to implement added security at designated boarding zones. This action, coupled with requiring private providers to report safety incidents, would allow governments to help mitigate the safety concerns of travelers and hold companies accountable. Policies regulating fares and providing subsidies (for rides that connect to transit hubs) would not only financially incentivize more people to choose the shared option but could also help address any inequity by providing more access to these services for low-income households. Improving connections to public transportation hubs was also identified as one of the top five policy recommendations for encouraging shared rides, emphasizing the importance of multimodality when providing new services.
Financial incentives—in the form of rewards programs for taking shared rides—also ranked very high when respondents were asked to recommend actions that could be taken by employers to encourage their workers to pool rides. A guaranteed ride-home program to give workers another option when their transportation option falls through was also recommended as a potential employer program to encourage sharing a ride. This finding confirms prior research that highlighted the effectiveness of guaranteed ride-home programs in promoting high-occupancy vehicle use (e.g., transit, vanpool, carpool) (Kadesh and Elder Citation1989). When concerns about being stranded due to emergencies or unplanned schedule changes are assuaged, individuals tend to show a greater willingness to opt for pooled options. With safety again of concern, employer-based surveillance and security at boarding zones were the next top-rated recommendations, which could enhance a worker’s sense of security and ensure their safe return home should they feel unsafe sharing a ride. Allowing flexible work hours and working from home were also identified actions that would encourage sharing a ride by mitigating worker fears over excessively long or unpredictable shared-ride travel times causing problems at work. While flexible work hours may mean fewer potential partners to share with during rush hours, spreading out commutes throughout the day would also mean less demand during peak times, potentially leading to less traffic, lower costs, and a higher chance of getting paired with a partner since competition for rides is less fierce.
In addition to the aforementioned improvements, policies, and programs, the survey participants were asked about the potential effect of cost and time on their travel choices, to better identify potential incentives for shared rides. Approximately 43 percent of respondents indicated the importance of having a low-fare cost for shared rides, while 37 percent of respondents noted the increased cost of gasoline for driving. Lower-income respondents were more affected by the cost of the ride, whereas higher-income respondents were more affected by the unreliability of parking availability.
These responses along with the top-ranked policy ideas are interesting given that travel time was indicated as most important for encouraging shared-ride choices; respondents also indicated that time-sensitive trips such as medical appointments and classes were those for which they were least likely to share a ride. Given that information together, it may be important to address operational improvements of shared-ride trips first rather than rely solely on offering financial incentives to change behaviors. The results show that travelers who are too inconvenienced by additional travel time or unreliable service delivery from shared-ride services, particularly for trips that require punctuality, are not going to be encouraged enough by financial incentives to choose a shared-ride option unless the other travel alternatives become prohibitively expensive.
Conclusions
Emerging technologies have the potential to cause major disruptions in transportation over the course of the next few years. The best example that highlights such potential disruption is the recent rise in the popularity of TNCs and the impact that this development has had on the customary taxi industry. While these on-demand services confer myriad potential benefits, especially by providing increased mobility, there are also associated downsides. Giving access to cars to people who did not have previous access has induced greater demand for cars. With people electing to travel using these newly available services, and with more drivers entering the transportation workforce to take advantage of the flexibility and independence offered by various on-demand services, more cars are now on the road in many cities. These additional cars add more VMT, more traffic congestion, and more pollution to the road, exacerbating existing social and environmental problems related to cars.
A potential solution to these concerns would be the widespread adoption of pooled- or shared-ride services. This study involved an online survey conducted with residents in large metropolitan and small urban areas in Texas to learn more about their preferences for sharing rides while using on-demand transportation services. We took a deep dive into sharing a trip when using on-demand transportation services, use and user characteristics as well as perceived benefits and barriers to sharing trips on on-demand services. The results provided insights into various options for solutions to encourage more shared rides through operational improvements, government policies, and employer programs that could be implemented.
Finally, regardless of the nature of improvements, policies, or programs implemented, improved public awareness and education are imperative. Perceived availability of on-demand services could be an issue for policymakers aiming to encourage ridesharing. Only one-quarter of survey respondents indicated that demand-responsive and on-demand transit services were available in their area, despite the survey targeting zip codes where public microtransit services were currently in operation. While the service zones for these microtransit services may not have covered the household locations for all respondents, this finding does indicate that providers need to do a better job of increasing awareness of available service options in the communities in which they operate. The results also highlighted the importance of attitudes and perceived levels of service, which cannot be considered entirely independently. Understanding the interplay between attitudes and perceived service levels can help shape interventions and strategies to promote sustainable transportation options such as pooled rides.
Like any research, our study has its limitations, which open the door to various potential future research opportunities that can further advance the field. First, future research could incorporate data from large-scale surveys, such as the National Household Travel Survey (NHTS) of the United States, which are based on methods that may be more statistically rigorous (than the online survey employed in this study) and broader in scope than ours. Additional research aimed at replicating the study findings would also be valuable. In addition, this study briefly touched upon the effects of COVID-19 on shared-ride service; given the pandemic’s heightened focus on contagious diseases, individuals may have been more inclined to minimize contact with strangers. Future studies, conducted after COVID-19 is no longer a significant threat, may observe a reversal in this trend with the virus not being at the forefront of people’s minds. Conversely, the possibility of an opposite effect cannot be ruled out, suggesting a permanent and heightened sense of caution in general. Overall, further research would be needed for a detailed examination of future trends in behavior.
While our study may not be representative of the entire country, it provides valuable insights into the experiences and perceptions in the study region, particularly noteworthy due to the unique reliance on car-based modes of mobility in Texas cities. We recognize and appreciate the uniqueness of regions, individuals, cultures, and other contextual factors and the study findings provide valuable insights into transportation issues and barriers and inform the development of effective solutions toward sustainable mobility through shared-ride services. Our work addresses multiple dimensions of sustainability, which can be assessed through indicators that help evaluate the sustainability implications of encouraging shared rides: reduced congestion and emissions, optimized resource utilization, and improved mobility fostering social and economic benefits, among others.
Shared-ride services have the potential to transform the way people travel, but operational improvements and targeted policies are needed to ensure safe and comfortable experiences for all users as demonstrated in this study.
Acknowledgements
This work was supported by the National Institute for Congestion Reduction (NICR) and funded by the United States Department of Transportation’s Office of the Assistant Secretary for Research and Technology University Transportation Centers (UTC) Program under Grant No. 69A3551947136. The contents of this article reflect the views of the authors, who are responsible for the facts and the accuracy of the information presented herein. We thank three anonymous reviewers as well as the editor for their insightful feedback.
Disclosure statement
The authors report there are no competing interests to declare.
Additional information
Funding
References
- Bayne, A., A. Siegfried, L. Beck, and K. Freund. 2021. “Barriers and Facilitators of Older Adults’ Use of Ride Share Services.” Journal of Transport & Health 21:101055. doi:10.1016/j.jth.2021.101055.
- Boyer, C., D. Adams, and J. Lucero. 2010. “Rural Coverage Bias in Online Surveys? Evidence from Oklahoma Water Managers.” Journal of Extension 48 (3): 1–17.
- Brown, A. 2019. “Redefining Car Access: Ride-Hail Travel and Use in Los Angeles.” Journal of the American Planning Association 85 (2): 83–95. doi:10.1080/01944363.2019.1603761.
- Cai, H., X. Wang, P. Adriaens, and M. Xu. 2019. “Environmental Benefits of Taxi Ride Sharing in Beijing.” Energy 174: 503–508. doi:10.1016/j.energy.2019.02.166.
- Chen, X., H. Zheng, Z. Wang, and X. Chen. 2021. “Exploring Impacts of On-demand Ridesplitting on Mobility via Real-World Ridesourcing Data and Questionnaires.” Transportation 48 (4): 1541–1561. doi:10.1007/s11116-018-9916-1.
- Circella, G., F. Alemi, K. Tiederman, S. Handy, and P. Mokhtarian. 2018. The Adoption of Shared Mobility in California and Its Relationship with Other Components of Travel Behavior. Davis, CA: National Center for Sustainable Transportation, University of California-Davis.
- de Oliveira Neto, G., L. Pinto, M. Amorim, B. Giannetti, and C. de Almeida. 2018. “A Framework of Actions for Strong Sustainability.” Journal of Cleaner Production 196: 1629–1643. doi:10.1016/j.jclepro.2018.06.067.
- DeCamp, W., and M. Manierre. 2016. “Money Will Solve the Problem’: Testing the Effectiveness of Conditional Incentives for Online Surveys.” Survey Practice 9 (1): 1–9. doi:10.29115/SP-2016-0003.
- Erhardt, G., S. Roy, D. Cooper, B. Sana, M. Chen, and J. Castiglione. 2019. “Do Transportation Network Companies Decrease or Increase Congestion?” Science Advances 5 (5): eaau2670. doi:10.1126/sciadv.aau2670.
- Ge, Y., C. Knittel, D. MacKenzie, and S. Zoepf. 2016. “Racial and Gender Discrimination in Transportation Network Companies,” Working Paper 22776. Cambridge, MA: National Bureau of Economic Research.
- Gehrke, S., and T. Reardon. 2021. “Adoption of Pooled Ride-Hailing Services in the Greater Boston Region.” Poster Presentation at the 100th Annual Meeting of the Transportation Research Board, Washington, DC.
- Hansen, T., and I. N. Sener. 2022. “Strangers on This Road We Are On: A Literature Review of Pooling in On-demand Mobility Services.” Transportation Research Record 2677 (3): 1368–1381.
- Hawkins, A. 2018. “Uber Express Pool Offers the Cheapest Fares Yet in Exchange for a Little Walking.” The Verge, February 21. https://www.theverge.com/2018/2/21/17020484/uber-express-pool-launch-cities.
- Huet, E. 2015. “The Case for Carpooling: Inside Lyft and Uber’s Quest to Squeeze More People in the Backseat.” Forbes. August 18. https://www.forbes.com/sites/ellenhuet/2015/08/18/inside-lyfts-and-ubers-carpooling-quest-uberpool-lyft-line/?sh=5221b90b233f
- Jang, M., and A. Vorderstrasse. 2019. “Socioeconomic Status and Racial or Ethnic Differences in Participation: Web-Based Survey.” JMIR Research Protocols 8 (4): e11865. doi:10.2196/11865.
- Kadesh, E., and L. Elder. 1989. “Guaranteed Ride Home: An Insurance Program for HOV Users.” Transportation Research Record 1212: 72–75.
- Kang, S., A. Mondal, A. Bhat, and C. Bhat. 2021. “Pooled versus Private Ride-Hailing: A Joint Revealed and Stated Preference Analysis Recognizing Psycho-social Factors.” Transportation Research Part C: Emerging Technologies 124: 102906. doi:10.1016/j.trc.2020.102906.
- Lavieri, P., and C. Bhat. 2018. Modeling Individuals’ Willingness to Share Trips with Strangers in an Autonomous Vehicle Future. Austin, TX: Data-Supported Transportation Operations & Planning Center (D-STOP), University of Texas at Austin.
- Li, W., Z. Pu, Y. Li, and X. Ban. 2019. “Characterization of Ridesplitting Based on Observed Data: A Case Study of Chengdu, China.” Transportation Research Part C: Emerging Technologies 100: 330–353. doi:10.1016/j.trc.2019.01.030.
- Ma, Z., H. Koutsopoulos, and Y. Zheng. 2019. “Evaluation of On-demand Ride-Sharing Services.” Paper presentation at the 98th Annual Meeting of the Transportation Research Board, Washington, DC.
- Meshram, A., P. Choudhary, and N. Velaga. 2020. “Assessing and Modelling Perceived Safety and Comfort of Women during Ridesharing.” Transportation Research Procedia 48: 2852–2869. doi:10.1016/j.trpro.2020.08.233.
- Moody, J., and J. Zhao. 2020. “Adoption of Exclusive and Pooled TNC Services in Singapore and the U.S.” Journal of Transportation Engineering, Part A: Systems 146 (9): 04020102.
- Morris, E., A. Pratt, Y. Zhou, S. Khan, J. Derochers, A. Brown, and M. Chowdhury. 2019. Assessing the Experience of Providers and Users of Transportation Network Company Ridesharing Services.” Clemson, SC: Center for Connected Multimodal Mobility, Clemson University.
- Morris, E., Y. Zhou, A. Brown, S. Khan, J. Derochers, H. Campbell, A. Pratt, and M. Chowdhury. 2020. “Are Drivers Cool with Pool? Driver Attitudes towards the Shared TNC Services UberPool and Lyft Shared.” Transport Policy 94: 123–138. doi:10.1016/j.tranpol.2020.04.019.
- New York City Department of Transportation (NYC DOT). 2018. NYC Mobility Report. New York: NYC DOT. https://www.nyc.gov/html/dot/html/about/mobilityreport.shtml
- Panjwani, N. 2018. “Mainstreaming Gender in Karachi’s Public Transport Policy.” European Journal of Sustainable Development 7 (1): 355–364. doi:10.14207/ejsd.2018.v7n1p355.
- Pew Research Center. 2022. Internet/Broadband Fact Sheet. Washington, DC: Pew Research Center. https://www.pewresearch.org/internet/fact-sheet/internet-broadband
- Qualtrics. 2014. “Esomar 28: 28 Questions to Help Research Buyers of Online Samples.” https://success.qualtrics.com/rs/qualtrics/images/ESOMAR%2028%202014.pdf
- Sarriera, J., G. Alvarez, K. Blynn, A. Alesbury, T. Scully, and J. Zhao. 2017. “To Share or Not to Share: Investigating the Social Aspects of Dynamic Ridesharing.” Transportation Research Record 2605 (1): 109–117. doi:10.3141/2605-11.
- Schaller, B. 2018. “The New Automobility: Lyft, Uber, and the Future of American Cities." New York: Schaller Consulting.
- Schaller, B. 2021. “Can Sharing a Ride Make for Less Traffic? Evidence from Uber and Lyft and Implications for Cities.” Transport Policy 102: 1–10. doi:10.1016/j.tranpol.2020.12.015.
- Shaheen, S., and A. Cohen. 2018. “Shared Ride Services in North America: Definitions, Impacts, and the Future of Pooling.” Berkeley, CA: Transportation Sustainability Research Center, University of California, Berkeley.
- Shaheen, S., J. Lazarus, J. Ciacedo, and A. Bayen. 2021. “To Pool or Not to Pool?” In Understanding the Time and Price Tradeoffs of On-Demand Ride Users – Opportunities, Challenges, and Social Equity Considerations for Policies to Promote Shared-Ride Services, edited by S. Shaheen, J. Lazarus, J. Caicedo, and A. Bayen. Berkeley, CA: Institute of Transportation Studies, University of California, Berkeley.
- Silva, L., M. Andrade, and M. Maia. 2018. “How Does the Ride-Hailing System’s Demand Affect Individual Transport Regulation?” Research in Transportation Economics 69: 600–606.
- Smith, A. 2016. “Shared, Collaborative, and On-Demand: The New Digital Economy.” Washington, DC: Pew Research Center. https://www.pewresearch.org/internet/2016/05/19/the-new-digital-economy
- Tang, Y., P. Guo, C. Tang, and Y. Wang. 2021. “Gender-Related Operational Issues Arising from On-demand Ride-Hailing Platforms: Safety Concerns and System Configuration.” Production and Operations Management 30 (10): 3481–3496. doi:10.1111/poms.13444.
- United States Census Bureau (USCB). 2022. American Community Survey 2020. Washington, DC: USCB. https://www.census.gov/programs-surveys/acs
- United States Environmental Protection Agency (USEPA). 2022. Sustainability and the ROE Framework. Washington, DC: USEPA. https://www.epa.gov/report-environment/sustainability-and-roe#framework-sustainability. Accessed July 26, 2022.
- Vinayak, P., F. Dias, S. Astroza, C. Bhat, R. Pendyala, and V. Garikapati. 2018. “Accounting for Multi-Dimensional Dependencies among Decision-Makers within a Generalized Model Framework: An Application to Understanding Shared Mobility Service Usage Levels.” Transport Policy 72: 129–137. doi:10.1016/j.tranpol.2018.09.013.
- Wenzel, T., C. Rames, E. Kontou, and A. Henao. 2019. “Travel and Energy Implications of Ridesourcing Service in Austin, Texas.” Transportation Research Part D: Transport and Environment 70: 18–34. doi:10.1016/j.trd.2019.03.005.
- Young, M., S. Farber, and M. Palm. 2020. “The True Cost of Sharing: A Detour Penalty Analysis between UberPool and UberX Trips in Toronto.” Transportation Research Part D: Transport and Environment 87: 102540. doi:10.1016/j.trd.2020.102540.
- Zhu, J., N. Xie, Z. Cai, W. Tang, and X. Chen. 2022. “A Comprehensive Review of Shared Mobility for Sustainable Transportation Systems.” International Journal of Sustainable Transportation 17 (5): 527–551.