
ABSTRACT
Visual perception of many manufactured white objects is driven by the concentration of fluorescent whitening agents (FWAs) that they contain. FWAs serve to increase overall whiteness perception by enhancing luminance and providing a chromatic blue shift. White objects with FWAs have been engineered for many decades to interact with conventional illuminants such as daylight and incandescent light in order to provide desirable whiteness perception. Whiteness perception has not previously been investigated under light emitting diodes (LEDs). In this study, three psychophysical experiments—forced choice, selection, and sorting—were conducted to investigate the whiteness perception of a series of whiteness standards containing predetermined amounts of FWAs, illuminated by five sources: a typical blue-pumped LED (BLED), a filtered halogen lamp, and violet-pumped LEDs with three violet emission levels. Thirty-nine participants with normal color vision completed the experiments. Results from the sorting experiment can be explained by FWA excitation: the BLED induced no fluorescence and standards could not be ordered properly, whereas for other sources the perceived whiteness increased with the amount of FWAs. Results from the other two experiments can be explained by FWA excitation together with shifts in source chromaticity. Overall, all results are compatible with the known trend for blue shifts to induce whiteness perception. Adaptations of the CIE whiteness formula are also shown to agree well with the experimental results. The results indicate that engineering of an LED source’s spectrum is necessary for an accurate rendering of whiteness.
1. INTRODUCTION
White and near-white objects are prevalent in our environment; they include papers, fabrics, clothing, paints, furniture, and plastics. Unlike the well-studied ability of light sources to render colors, the rendering of whites has received less attention. This may be surprising when contrasted with the significant efforts made by the manufacturing industry to produce goods with ever whiter appearance.
1.1 White Objects
The pursuit of whiter whites has a long and ongoing history. Washing and sun drying to remove color from fabrics can be traced to 5000 B.C. Bleaching powder has been
in continuous use since it was invented by Tennant in 1799. Violet and blue dyes have been used to remove yellow tint and increase whiteness perception.
Significant progress in the rendering of white materials was achieved in 1929 with Krais’s discovery of fluorescent whitening agents (FWAs) [Ahmed and others Citation2006; Anliker Citation1975; Hunger Citation2003; Krais Citation1929]. FWAs absorb ultraviolet (UV) and violet optical radiation and re-emit blue light, thus inducing a blue tint and increasing lightness [Choudhury Citation2006; Katayama and Fairchild Citation2010]. The blue shift is perceived as enhanced whiteness, thus producing a “whiter-than-white” effect. This enables objects containing FWAs to stand out in their environment. Of course, this effect is not always maximized in white objects; rather, manufacturers modulate the presence and amount of FWAs to generate various white renderings. Interestingly, some natural materials contain fluorescing agents, including human teeth [Hall and others Citation1970; Hartles and Leaver Citation1953], which contribute to a familiar white rendering.
Manufacturers’ use of FWAs has prompted the need for a quantitative formula to characterize the corresponding chromaticity shift and correlate it to perceived whiteness. Various formulas have been proposed over the years, with the first developed in the 1930s [Judd Citation1935; MacAdam Citation1934] and later formulae by Ganz [Citation1979] and Griesser [Citation1994, Citation1996]. The Commission Internationale de l’Eclairage (CIE) established a subcommittee on whiteness in 1967 and recommended the CIE whiteness formula in 1986, which characterizes whiteness under CIE Illuminant D65. The general geometry is illustrated in [International Organization for Standardization [ISO] Citation2004]. Within its restrictions, the formula has a good correlation with the results of psychophysical experiments [Jordan and O’Neill Citation1991]. Whiteness formulas aim to characterize objects under a reference illuminant; they do not make predictions under other light sources [ISO Citation2004, Citation2010].
Fig. 1 CIE whiteness forumula illustrated in CIE 1964 10° chromaticity diagram [CIE Citation2004]. The black dot locates the chromaticity coordinates of the reference illuminant—CIE Illuminant D65. The main direction for CIE whiteness is along the dotted line connecting the chromaticity of the reference illuminant and the spectrum locus at a dominant wavelength at 470 nm. Shifts parallel to this direction with a small angle correspond to whiteness; shifts perpendicular to this direction correspond to tint [ISO Citation2004].
![Fig. 1 CIE whiteness forumula illustrated in CIE 1964 10° chromaticity diagram [CIE Citation2004]. The black dot locates the chromaticity coordinates of the reference illuminant—CIE Illuminant D65. The main direction for CIE whiteness is along the dotted line connecting the chromaticity of the reference illuminant and the spectrum locus at a dominant wavelength at 470 nm. Shifts parallel to this direction with a small angle correspond to whiteness; shifts perpendicular to this direction correspond to tint [ISO Citation2004].](/cms/asset/18b121a0-9f8e-4532-9a45-3a24c3488239/ulks_a_902750_f0001_b.gif)
1.2 Light Sources and Whiteness
Long disregarded, the ability of a light source to render whites has received recent focus—prompted in part by the spectral engineering capability of solid-state light sources. Two effects have been the subject of recent studies:
The impact of the source’s chromaticity: Rea and Freyssinier [Citation2013a, Citation2013b] asked participants to compare the white points of various sources above and below the blackbody locus. They found that some chromatic shifts are associated with lesser perceptions of tint. They hypothesized that people prefer white or minimally tinted sources of illumination.
The source’s ability to excite FWAs: For objects containing FWAs, whiteness enhancement can only be achieved if the light source emits a sufficient quantity of UV or violet radiation [Ayama and others Citation2003; Katayama and others Citation2002]. As discussed recently by Zwinkels and Noel [Citation2011] and David and his colleagues [2013], this is especially nontrivial for white light emitting diode (LED) sources, which typically emit no light below 430 nm [Wei and Houser Citation2012]. David and his colleagues [2013] proposed an adaptation of the CIE whiteness formula to describe FWA-induced whiteness under any source.
It should be realized that these two effects are distinct. Chromaticity shift is most easily perceived in comparative settings; that is, in a state of mixed adaptation where two sources are compared. It affects all white objects, regardless of the presence of FWAs. On the contrary, FWA fluorescence is perceived even under fully adapted conditions and is part of our everyday visual experience. It is a differential process: objects containing FWAs appear whiter than other white objects. To compare these two effects, consider daylight. The sun is arguably an ideal white source in terms of chromaticity (as implied by Rea and Freyssinier’s [Citation2013a] results at 5000 K). Yet, even in daylight, FWA fluorescence is valued and can induce a pronounced whiter-than-white perception.
In this study, three psychophysical experiments were conducted to compare the whiteness perception of whiteness standards containing different amounts of FWAs under illumination of five lamp types: a filtered halogen, a typical white LED with blue-pumped phosphor (BLED), and three violet-pumped white LEDs (VLED) with different violet emission levels.
2 METHODS
The experiments were approved by Penn State’s Institutional Review Board.
2.1 Apparatus
Two identical booths with nominal dimension of 53 cm (width) × 53 cm (depth) × 79 cm (height) were built adjacent to each other, as shown in . The interiors were painted with Munsell N8 spectrally neutral paint (RP IMAGING, Tucson, AZ, USA) with ρ ≈ 55%.
Fig. 2 (a) Photograph of the side-by-side viewing booths, also showing the chin and forehead rests; (b) examples of high dynamic range (HDR) images taken by fish-eye lens showing the simliarity of the luminance distribution of the two booths: (left) under illumination by a same lamp type; (right) under illumination by two different lamp types.
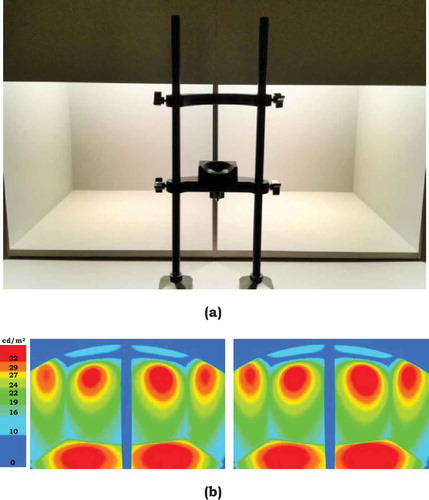
A circular arrangement of five identical wooden enclosures, each containing one of the five lamp types, was built on top of each booth. Each enclosure contained a mechanical iris for dimming so that all lamps could be operated at full output and spectral power distributions (SPDs) would not be affected by electrical dimming. A dado in each enclosure accepted a board, making it possible to block all light without turning off the lamps. The five enclosures formed a pentagon rotating around a central axis by means of a lazy Susan mechanism. A circular aperture was cut at the center of the ceiling panel of each booth, whose diameter was similar to that of the enclosures. A ball/spring stop was built on the top panel, so that by rotating the lazy Susan, one of the five enclosures could be stopped at a fixed position aligned with the aperture. The light projected downward through two layers of fused silica that had been ground on both sides with 40-μm lapping film, which diffused the light, yielding uniform illumination in the two booths with similar luminance distribution, as illustrated in .
A chin rest was mounted just outside of the booth(s). The participant looked downward and viewed the samples at angles of 30° to 45° from normal (the viewing angle varied across the three experiments).
The horizontal illuminance provided by each lamp was calibrated at 300 ± 5 lux, measured at the center of the floor in each booth using a T-10 illuminance meter (Konica Minolta Sensing Americas Inc., Ramsey, NJ, USA) (a National Institute of Standards and Technology traceable calibration certificate is on file). The calibration was verified just before the arrival of each participant and verified again after the completion of each participant.
2.2 Participants
Forty participants within the range of 19 to 25 years were recruited for the experiment. Most of them were university students but none of them were studying lighting. Thirty-nine participants (18 female, 21 male) with a mean age of 22.3 had normal color vision, as tested by the 24 Plate Ishihara Color Vision Test. Data from the participant with abnormal color vision were discarded. Of the 39 participants retained for analyses, 20 were Caucasian, 17 were Asian, and 2 were Hispanic.
TABLE 1 Summary of spectral data for the five lamp types. Chromaticity values are averages of 51 measurements taken during the course of the sessions. All measurements for the filtered halogen (left and right) can be contained in a 0.6-step MacAdam ellipse. The other ellipse sizes are 1.1 (BLED), 1.0 (2.5% VLED), 0.7 (5% VLED), and 0.6 (6.5% VLED). CRI is averaged across the left and right rooms
2.3 Experimental Design
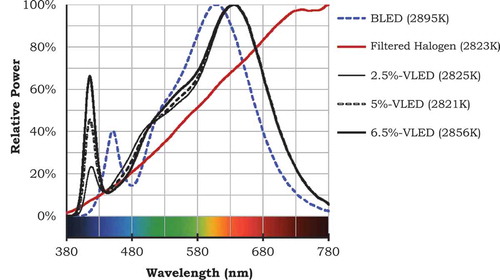
The independent variables were SPD of the light sources and CIE whiteness value (W) of the whiteness standards. Five SPDs were provided by five lamp types: filtered halogen, BLED, 2.5%-VLED, 5%-VLED, and 6.5%-VLED. The three VLEDs were designed to have 3%, 7%, and 11% violet emission levels, where violet emission is defined as the percentage of optical radiation below 430 nm to the optical radiation from 360 to 830 nm. Due to the absorption in the short-wavelength region by the lens covering the LED chips and the fused silica diffusers, the violet emissions measured at the floor of the booth were 2.5%, 5%, and 6.5%. The diffusers also significantly reduced the amount of UV radiation in the SPD of the halogen lamp; its ability to excite FWAs was reduced by a factor of about two to three times. Therefore, we refer to this lamp as “filtered halogen.” An unfiltered 3000 K halogen lamp will produce a higher whiteness level than the filtered halogen studied here. The SPDs of the illumination provided by these five lamp types are shown in . summarizes measurements of chromaticity, correlated color temperature (CCT), and the CIE general coloring index (CRI). Chromaticity was measured before the arrival and after the completion of each participant in each booth. Each set of measurements can be enclosed by a MacAdam Ellipse (a.k.a. standard deviations of color matching, SDCM) of 0.7 to 1.1 steps centered at the average of the measurements. Thus, all participants experienced comparable conditions, though small differences existed between the two booths.
Fig. 3 Relative SPDs of the five different lamp types included in the experiments, normalized to peak power. Measurements were taken from 380 to 780 nm in 4-nm increments with a PR-655 SpectraScan spectroradiomter (Photo Research Inc., Cary, NC, USA) aimed at a diffuse reflectance standard (SRT-MS-100, ρ = 99%) (Labsphere North America, North Sutton, NH, USA). The SPDs are averages of measurements taken in both booths.
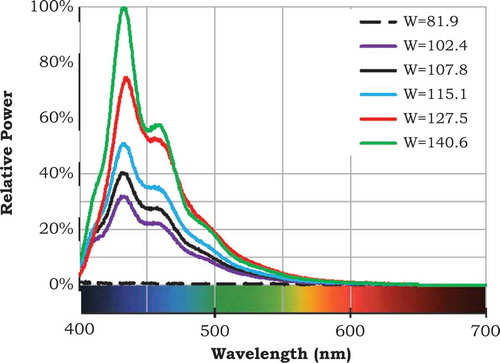
Nine calibrated whiteness standards, with six nominal CIE whiteness values, purchased from Avian Technologies (Sunapee, NH, USA), were used in the experiments. The CIE whiteness value of these standards, measured by the manufacturer, varies between 81.9 and 140.6. We label these samples as W×× where the subscript represents the CIE whiteness value. In the forced-choice and selection tasks (described in 2.3.2 and 2.3.3), we employed pairs of nominally identical standards. However, the paired samples were not identical to each other because of limitations in the standards themselves. At a CIE whiteness value of about 82, the samples have actual CIE whiteness values of 81.9 and 83.3. Similarly, at a CIE whiteness value of about 140, the samples have actual CIE whiteness values of 140.1 and 140.6. W81.9 and W83.3 do not contain FWAs, whereas the others contain greater amounts of FWAs with increasing whiteness values. These standards are representative of manufactured materials with varying whiteness levels—for example, the standards with the most FWAs are similar to whitened commercial papers and fabrics. illustrates the spectral reflectance distribution of the series under a monochromatic illumination of 390 nm.
Fig. 4 Spectral emission of six whiteness standards containing different amounts of FWAs under a monochromatic illumination of 390 nm. The curves are scaled to the highest emission intensity among the six curves. The standards with greater amount of FWAs have higher values of whiteness, W. The whiteness standard labeled as W = 81.9, which exhibits almost no emission, does not contain FWAs.
A streamlined summary of the designs for the three experiments follows. Care was taken at every step to ensure data credibility—including counterbalancing, randomization, null condition trials, and analysis of apparent bias. Refer to Appendix A for details about these aspects of the experiments.
2.3.1 Sorting
For the sorting task, six standards—W81.9, W102.4, W107.8, W115.1, W127.5, W140.6—were placed in random order in one booth. Each participant was asked to arrange them based on their whiteness. The task was repeated five times in a randomized order, once under each lamp type. For each lamp type, the participant was required to look at the standards for 30 s to ensure that he or she was chromatically adapted to the illumination. The dependent variable was the rank of each standard arranged by the participant.
2.3.2 Forced Choice
Each participant completed two forced-choice sessions, in which a pair of whiteness standards with the same nominal FWA content was evaluated under illumination from all possible pairs of the five lamp types. One session employed standards W81.9 and W83.3. The other session employed W140.1 and W140.6. The lower whiteness pair does not contain FWAs; the higher whiteness pair does. The pairs were presented in side-by-side booths. In addition to the 20 pairs of all lamp types, participants evaluated the five null conditions. Session order and the left/right position of the standards were counterbalanced across participants. The same process was followed for the low- and high-whiteness pairs.
The participant was asked to select which one of the two standards appeared whiter, the one in either the left or the right booth, which was a forced choice. If the participant declared that they were the same, then the experimenter instructed him or her that some pairs might be difficult but that a selection was required for each pair.
As will be described further in the discussion, the lower whiteness pair revealed differences in whiteness perception resulting from differences in CCT and chromaticity of the sources, and the higher whiteness pair revealed differences in whiteness perception resulting from FWA fluorescence.
2.3.3 Selection
In the selection session, W115.5 was the reference standard and six whiteness standards—W81.9, W102.4, W107.8, W115.1, W127.5, W140.6—were test standards. The reference standard was placed in one booth and the six test standards were placed in the other booth, arranged in random order. Counterbalancing was employed—20 participants saw the reference standard placed in the left booth and the test standards in the right booth; the other 20 saw the reverse. The participants were asked to compare each of the six test standards to the reference based on whiteness appearance and to select those that were perceived to have the same or higher whiteness than the reference. All possible pairs of the five light settings were evaluated, including null conditions, for a total of 25 pairs of light settings. The dependent variable was the selection of the standards made by each participant.
2.3.4 Procedure
Upon arrival, the participants read a brief description of the experiment, signed an informed consent form, and completed a general information survey. The 24 Plate Ishihara Color Vision Test was then administered.
The participant was then escorted into the experiment room and seated in front of the side-by-side booths for the forced-choice sessions. He or she was instructed to adjust the height of the seat and to comfortably place his or her head in the chin rest. The chin rest was fixed on the table to align the participant’s sagittal plane with the panel dividing the two booths. The observer was positioned just outside the booths but still far enough outside that he or she could see both booths with both eyes. The observer was free to rotate his or her head when making comparisons between booths. The first pair of whiteness standards was placed in the two booths, with one in each booth. Next, the experimenter read the instructions and answered questions raised by the participant. After three practice trials, which were identical for all participants, the recorded trials began. The experimenter adjusted the light settings by rotating the lazy Susan according to a prewritten script with a random order. The participant was instructed to lower an eye mask when the light settings were changed to the next pair so that he or she would not compare the new pair to what was previously seen. After several seconds, the participant was instructed to remove the eye mask and then simply to look at the two standards in the booths while holding judgment for at least 30 s (to allow for adaptation to the new settings). The experimenter prompted the participant after 30 s, but he or she was allowed to take as much time as needed to judge which standard appeared whiter. The experimenter recorded his or her response and then moved to the next pair. After finishing all 25 pairs, the participant was instructed to step out of the room to complete a 3-min washout period. During that time the experimenter changed the whiteness standards to the other pair. After the washout period, the participant returned into the room to finish the other 25 forced choices. Half of the participants evaluated the low-whiteness pair first and high-whiteness pair second; the other half performed the evaluations in reverse. See Appendix A.2 for details about null condition trials and countering positional bias.
The participant was then escorted out of the room for another 3-min washout period. The experimenter set up the selection task by placing the six test standards in one booth and the one reference standard in the other booth; the location and arrangement of the standards were included in a prewritten script with a random order. The position of the reference standard and the six test standards was counterbalanced between participants (see Appendix A.3 for details). After 3 min, the participant returned to the room. The experimenter read the instructions for the selection session and answered questions raised by the participant. The procedure for the 25 pairs of light settings for the selection task was similar to that for the forced choice. After holding judgment for 30 s, the participant was required to point out each of the test standards that were perceived to have same or higher whiteness than the reference standard.
The participant was then escorted out of the room for another 3-min washout period. The experimenter then set up the sorting task by placing the six standards in one of the two booths according to a prewritten script and moving the chin rest to the front of that booth. A board was inserted into a dado of the enclosure in the other booth so that no light appeared in the other booth during the sorting session. After 3 min, the participant returned to the room and placed his or her chin on the rest. The experimenter read the instructions and answered any questions. The participant was required to look at the standards under the light setting for 30 s and then arrange them based on whiteness. After completing the task under the first light setting, he or she was instructed to step out of the room for a washout period. The experimenter recorded the order of the standards arranged by the participant, rearranged the standards in random order, and switched the light setting to the next one. The same procedure was repeated for the five light settings.
The instructions for the three tasks were always read from scripts to minimize variation between participants. The entire procedure took between 70 and 90 min for each participant.
3 RESULTS
3.1 Sorting
The order of the six standards arranged by each participant under the illumination of each lamp type was recorded from 1 to 6, with 6 as the whitest. The average ranks of the standards were consistent with the CIE whiteness values under illumination from the filtered halogen, 5%-VLED, and 6.5%-VLED, as shown in , , and . The order of W127.5 and W115.1 was flipped under 2.5%-VLED. CIE whiteness values had no predictive power under the illumination of BLED. The difference of the rank between each pair of standards was tested by the variance stable rank sums (VSRS) method, an adaptation of two-way analysis of variance by ranks [Dunn-Rankin and others Citation2004]. It tests all pairs together and accounts for the effect of each participant because the selections made by each participant were not independent. This method was used in previous lighting studies that employed forced choice for an all possible pairs design [Fotios and Cheal Citation2007; Houser and others Citation2009; Quellman and Boyce Citation2002; Royer and Houser Citation2012]. Only two pairs of standards under the illumination of BLED were not significantly different; these pairs are shown with identical hachure lines in .
Fig. 5 Results of the average rank of each whiteness standard under each illumination with standard deviation bars. The ranks of each whiteness standard were signficantly different from each other under the filtered halogen, 2.5%-, 5%-, and 6.5%-VLEDs. Two pairs of standards under BLED were not significantly different; these pairs are shown with identical hachure lines in (a).
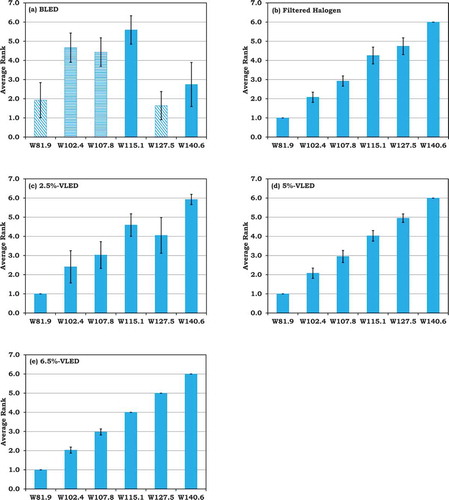
The BLED was not able to excite FWAs contained in the standards. Participants ranked the standards under the BLED based on small differences in reflectance and tint but not based upon the whiteness change caused by FWAs. In contrast, illumination from the filtered halogen, 2.5-VLED, 5%-VLED, and 6.5%-VLED allowed participants to discriminate whiteness standards with different amounts of FWAs, and the amount of FWAs corresponded with perceived whiteness under these four sources.
3.2 Forced Choice
The effect of SPD on whiteness perception was examined by evaluating the selection of each lamp pair. Data were recorded as left or right as selected by each participant and converted to binary digits for analyses using the VSRS method. Inverse combinations (for example, BLED in the left versus filtered halogen in the right and BLED in the right versus filtered halogen in the left) were averaged as a single combination for each participant. and 2b show the results of VSRS analysis for the pair of W81.9 versus W83.3 and the pair of W140.1 versus W140.6. A larger difference in Ri between two lamp types indicates a greater perceptual difference. With five stimuli and 39 participants, a difference larger than 31.10 or 37.11 indicates a statistical difference at the α = 0.05 or 0.01, respectively [Dunn-Rankin and others Citation2004].
TABLE 2 Summary of the VSRS tests for the forced-choice sessions. Values in the matrix are the difference of Ri between lamp types. Shaded values represent comparisons that are significantly different at the α = 0.05 level (with a value larger than 31.10), all of which are also significantly different at the α = 0.01 level (with a value larger than 37.11). (a) Comparisons of whiteness standards without FWAs (W81.9 and W83.3) and (b) comparisons of whiteness standards with FWAs (W140.1 and W140.6)
The standards without FWAs (W81.9 versus W83.3) had similar whiteness perception under the illumination of filtered halogen and 2.5%-VLED, both of which provided the lowest whiteness among the five lamps. The whiteness of the standards under BLED and 5%-VLED were similar, which were higher than those under filtered halogen or 2.5%-VLED. The standards were ranked to have highest whiteness under the illumination of 6.5%-VLED.
For the standards with FWAs (W140.1 versus W140.6), the ranks under the illumination of BLED, filtered halogen, and 2.5%-VLED were approximately equal. The 5%-VLED was ranked to provide higher whiteness and 6.5%-VLED was the highest. To summarize, the whiteness perception for these two pairs of whiteness standards under the illumination of VLEDs increased with increased violet emission. The 2.5%-VLED and filtered halogen tended to provide similar whiteness perceptions.
3.3 Selection
– summarize the results of the selection session, with one figure for each lamp type as the reference. The data points illustrate the percentage of participants who selected each standard under the illumination of each lamp type as having equal or higher whiteness than the reference standard (W115.5) under the reference lamp. Percentages greater than 67% are significantly higher than 50%, as tested by the chi-square goodness-of-fit test at the α = 0.05 level, indicating that those standards and illumination conditions were perceived to have equal or higher whiteness than the reference standard (W115.5) under the reference illumination.
Fig. 6 Results of the selection experiment, summarizing the percentage of the selection (vertical axis) for each whiteness standard (horizontal axis) under each of the test SPDs (different lines) that were perceived to have equal or higher whiteness than W115.5 under each of the reference SPDs (shown as the inset title of each figure). Percentages greater than 67% are significantly higher than 50%, indicating that those whiteness standard and illumination conditions were perceived to have equal or higher whiteness than the reference standard (W115.5) under the reference SPD. The error bars show the difference between counterbalanced conditions (that is, variation from when the reference standard was placed in the left or right booth).
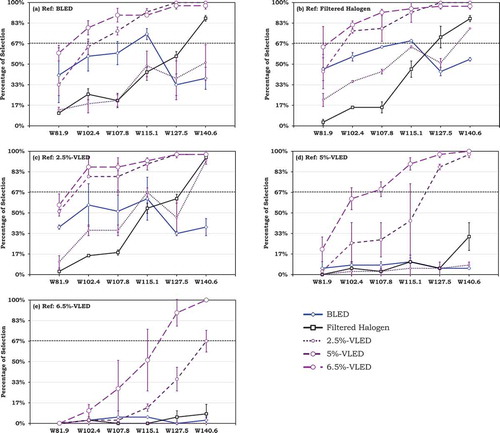
The 5%-VLED and 6.5%-VLED conditions were found to have the highest performance for whiteness perception among the five lamps studied. Under illumination from these two lamp types, a whiteness standard could have a lower CIE whiteness values but still be perceived to be equally white or whiter than those having higher CIE whiteness values but illuminated with BLED, filtered halogen, and 2.5%-VLED. As shown in , four standards under 5%-VLED and five standards under 6.5%-VLED were perceived to have equal or higher whiteness than whiteness standard W115.1, which was the standard that appeared whitest under BLED.
The results of the selection experiment corroborated those of the sorting experiment. The standards with higher rank in the sorting session under each SPD () were selected more frequently in the selection session (). The forced-choice, selection, and sorting sessions were highly consistent, which gives us confidence in the validity and reliability of the results.
4 DISCUSSION
4.1 Whiteness Formula
A formula to characterize whiteness for illuminants from 2800 to 7000 K was proposed by David and his colleagues [2013] in the format
where:
W = measure of whiteness;
Y = luminance factor of the sample (a perfect reflector without FWAs has Y = 100. Y can be greater than 100 for materials with FWAs);
= chromaticity coordinates of the sample under consideration when illuminated by the source under consideration;
a, b = coefficients that are based on sensitivity of whiteness to saturation and tint preferences.
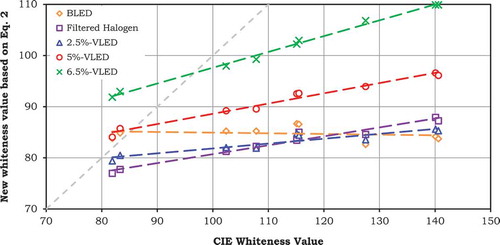
We adopted their formulation and computed five whiteness formulas, one for each lamp type, using the 10° color matching functions (CMFs) that have been tentatively recommended by CIE TC 1-36 [CIE Citation2013]. For brevity, in this article they are referred to as the TC 1-36 10° CMFs. Appendix B provides background for the selection of this set of CMFs. The whiteness values of each standard under each lamp are shown in . Among the four LED lamps, the whiteness standards under 5%-VLED have most similar whiteness values to those under the filtered halogen lamp.
Fig. 7 New whiteness value of the standards under the illumination of the five lamps by adopting the whiteness formula proposed by David and his colleagues [2013] and employing the TC 1-36 10° CMFs. The dashed line shows the diagonal x = y. The standards under the filtered halogen and the three VLEDs show increased new whiteness values with CIE whiteness values; all of the standards have simliar whiteness values under BLED. The standards under 5%-VLED and filtered halogen have similar new whiteness values.
![Fig. 7 New whiteness value of the standards under the illumination of the five lamps by adopting the whiteness formula proposed by David and his colleagues [2013] and employing the TC 1-36 10° CMFs. The dashed line shows the diagonal x = y. The standards under the filtered halogen and the three VLEDs show increased new whiteness values with CIE whiteness values; all of the standards have simliar whiteness values under BLED. The standards under 5%-VLED and filtered halogen have similar new whiteness values.](/cms/asset/0252d050-5bc7-440a-aa4e-9991a533bee3/ulks_a_902750_f0007_oc.jpg)
The whiteness values shown in are consistent with the results of the sorting experiment. The results of the forced-choice and selection sessions, however, do not perfectly corroborate the whiteness values shown in . For example, W81.9 and W83.3 do not contain FWAs and they have similar whiteness values under all five lamps. Yet, the participants perceived these standards differently under different lamps. One plausible explanation is that the side-by-side method with mixed adaptation employed in the forced-choice and selection sessions allowed participants to be sensitive to the effect of the lamp’s chromaticity. Appendix D provides an alternative method to compute whiteness values, which may be more appropriate for conditions of mixed adaptation and which support the results of the forced-choice and selection sessions.
4.2 Chromaticity of the Whiteness Standards
The chromaticity coordinates of a white object illuminated by a light source drive whiteness perception. The main direction for increased whiteness follows the line connecting the chromaticity of the reference illuminant and the spectrum locus at a dominant wavelength λd = 470 nm. Small shifts parallel to this line correspond to whiteness; shifts perpendicular to this line correspond to tint [David and others Citation2013]. The directions for whiteness and tint perceptions are from the CIE whiteness formula and are expected to be CCT independent [Ayama and others Citation2003; David and others Citation2013; Jordan and O’Neill Citation1991; Katayama and Fairchild Citation2010; Katayama and others Citation2002].
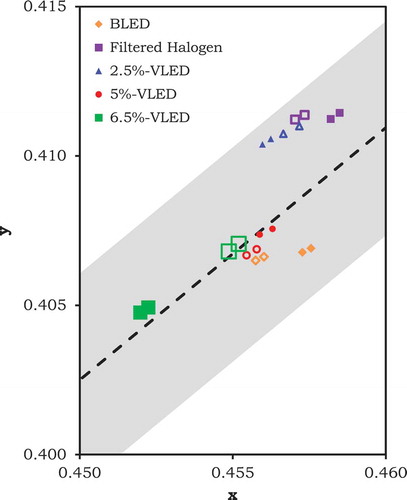
In our experiments where a participant made a selection between two standards (that is, the forced-choice and selection sessions), the booths were always viewed side by side with mixed adaptation. Observers were not completely adapted to either of the two illuminations because the visual system cannot simultaneously adapt to two white points. Under these conditions, the visual system will likely be adapted to a white point mid-way between the two stimuli [Fotios Citation2006]. Because not all of the lamps had the same chromaticity or CCT, color differences between standards under two illuminations are expected to be maximal when viewed side by side [Harper Citation1974]. Thus, when comparing lamps with different CCTs or chromaticity coordinates, a lamp may make objects appear whiter simply because its chromaticity coordinates are shifted toward the direction of increased whiteness. The chromaticity coordinates of all of the standards under five lamps, as shown in , corroborate the results of the forced-choice and selection sessions. When considering these conditions, the standards under 2.5%-VLED are closest to those under the filtered halogen.
Fig. 8 Chromaticity coordinates of all nine standards used in this study in the left booth using the TC 1-36 10° CMFs. The results are similar for the right booth (not shown). The dashed line corresponds to the BB-470-nm line. The solid trendlines show the shift of chromaticity of the whiteness standards under the filtered halogen and 2.5%-, 5%-, and 6.5%-VLEDs, which are consistent with the results of sorting experiment. The shaded grey region indicates tint values of ±3.
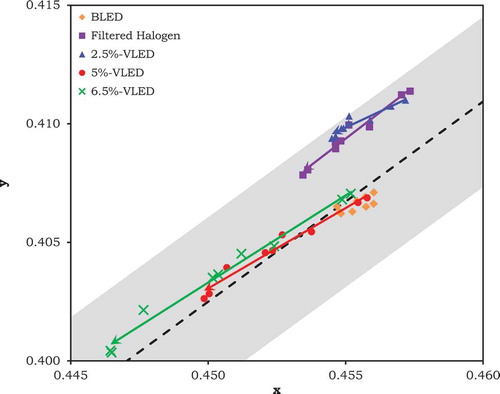
When exposed to illumination provided by one lamp type, chromatic adaptation may cause an observer to perceive the color of the illumination as white or colorless [Kuriki and Uchikawa Citation1996]. Thus, for whiteness perception under a given illumination, the absolute chromaticity of the source may be less important than the shift in chromaticity that is induced by the source. For the two standards that do not contain FWAs, the directions and magnitudes of the chromaticity shifts between the sources and standards are similar for all five lamps. These similar chromaticity shifts can be observed from the points in the yellow circle in . For the standards that contain FWAs, the magnitudes of the chromaticity shifts from the standards without FWAs to the standards with FWAs () and increase with the increasing amount of FWAs under the illumination of the filtered halogen, 2.5%-VLED, 5%-VLED, and 6.5%-VLED, which contributes to the higher whiteness values shown in .
Fig. 9 Chromaticity shift of the whiteness standards in the CIE u′v′ diagram, employing the TC 1-36 10° CMFs. Points aligned on the same vertical are for standards with the same CIE whiteness values. The points in the dashed yellow oval illustrate the magnitude and range of the chromaticity shift from the source to the standards without FWAs (W81.9 and W83.3) under each illumination; the shifts are similar under all five lamps. The other points represent the magnitude of the chromaticity shift from the standards without FWAs to the standards with different amounts of FWAs when illuminated by each lamp type.
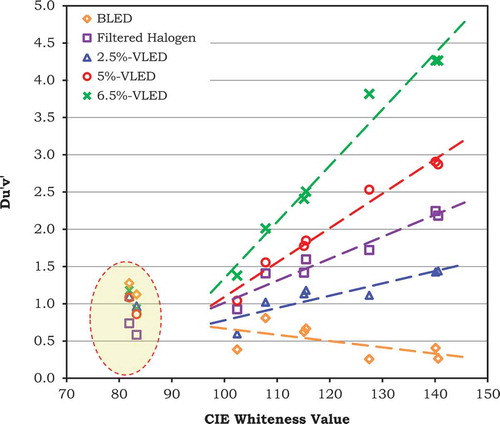
and illustrate that the FWA-induced chromatic shift for the filtered halogen lamp is between that of the 2.5% and 5% VLEDs. As previously mentioned, however, the filtered halogen only has a fraction of the natural UV content of a blackbody radiator (due to the absorption in the booths’ fused silica diffusers). As shown by David and his colleagues [2013], a 3000 K blackbody radiator is expected to induce a chromatic shift similar to a 6%–8% VLED.
To summarize, when an observer evaluates lamps with different chromaticity coordinates in a state of mixed adaptation, small differences will be especially apparent. Lamps with chromaticity shifted toward the 470-nm chromaticity point on the spectrum locus could provide greater perceptions of whiteness for some white objects, especially if they contain no FWAs. For objects containing FWAs, the amount of ultraviolet and violet radiation in the illumination is at least as important as the chromaticity coordinates of the illumination for rendering whiteness. When an observer is fully chromatically adapted (that is, under illumination by a single light source), the amount of ultraviolet and violet radiation in the illumination is the mechanism that drives whiteness perception for objects containing FWAs.
4.3 Whiteness Perception under Blue-Pumped LEDs
shows that all lamps except the BLED yielded higher whiteness values as the amount of FWAs increased. The lack of ultraviolet and violet radiation of the BLED made it fail to excite FWAs and to differentiate whiteness standards that contained different amounts of FWAs.
As shown in , the BLED in this experiment happened to have a slightly blue-shifted chromaticity in comparison to the other four sources examined. This yielded higher whiteness perception for samples with no or low FWA content, when compared to filtered halogen and 2.5%-VLED in direct side-by-side comparisons. We expect that this effect would disappear when an observer chromatically adapted to the illumination or if the sources being compared in a side-by-side evaluation were to have exactly the same chromaticity coordinates.
The 5%-VLED and 6.5%-VLED were both more similar in chromaticity to the BLED and they emitted more violet radiation. Thus, the 5%-VLED and 6.5%-VLED universally yielded greater whiteness perception than the BLED.
Our results can be explained by taking into account two effects: fluorescence of FWAs and shift of source chromaticity. The former effect is proportional to FWA content and enables an accurate white rendering of the samples. The latter effect, on the other hand, applies indiscriminately to all samples. Thus, the BLED exhibited serious problems in accurately rendering the calibrated whiteness standards. We would expect similar problems to occur with the many manmade objects that contain FWAs.
It should be noted that the BLED included in this study had a respectable CRI of 85. CRI is not designed to characterize the rendition of whites. The failure of the blue-pumped LED to accurately render whiteness is especially concerning because this is the dominant method for producing white light in solid-state lighting [Wei and Houser Citation2012]. When the FWAs contained in objects cannot be excited, as is the case with blue-pumped LEDS, observers will be unable to differentiate white objects. This has implications for the illumination of white textiles, plastics, makeup, paints, and papers.
5. CONCLUSIONS
Whiteness perception of a series of whiteness standards containing various amount of FWAs was studied under the illumination of five different lamps—a filtered halogen, a typical blue-pumped LED, and violet-pumped LEDs with three violet emission levels. Our experimental results can be understood in light of two effects: FWA fluorescence, which produces a whiter-than-white effect in FWA-containing objects, and chromaticity shift, which displaces the chromaticity of the light source and all the objects it illuminates.
In an adapted situation, the relevant effect is FWA fluorescence. As confirmed by our sorting experiment, sufficient UV or violet radiation is necessary to induce whiteness enhancement. The whiteness formula proposed in David and his colleagues [2013], adapted to the TC 1-36 10° CMFs, properly quantifies this effect. Blue-pumped LEDs do not induce FWA fluorescence, whereas violet-pumped LEDs with a carefully chosen violet emission can emulate the behavior of a halogen lamp.
The other two experiments, forced choice and selection, were side-by-side comparisons of light sources. They are therefore more complex to interpret because they occur under mixed adaptation and combine both effects. However, when the chromaticity of objects is considered, the results are consistent with expectations. Overall, a blue shift is associated with higher whiteness perception.
Our results are relevant for the visual rendering of white objects. It is sometimes believed that a chromaticity shift can be used in lieu of FWA enhancement in order to enhance whiteness. Yet, our results illustrate that the two effects are not equivalent. Chromaticity shift can indeed increase whiteness in mixed adaptation conditions, but this occurs across the board for all objects, regardless of the presence of FWAs—and therefore regardless of the intended whiteness of a manufactured object. FWA excitation, on the other hand, produces the differential chromatic shift intended in the design of white objects.
We conclude that desirable rendering of white objects is only enabled by appropriate engineering of the source’s spectrum. With the widespread use of FWAs, and the fact that blue-pumped phosphor is now the most common method for creating white light with LEDs, this problem is especially significant. We believe that whiteness rendering should be considered alongside color rendition when evaluating a source’s overall color quality. The results of the psychophysical experiments could be explained by the formulas employed herein and support the general method proposed by David and his colleagues [2013].
Cartoon Abstract
Download JPEG Image (759.3 KB)
FUNDING
This study was supported by Soraa, Inc., through a sponsored research agreement with The Pennsylvania State University.
Notes
Color versions of one or more of the figures in this article can be found online at www.tandfonline.com/ulks.
The action editor for this manuscript was Associate Editor Jennifer Veitch.
Related Research Data
REFERENCES
- Ahmed MA, Aleem A, Siddiqui MQ, Mughal J. 2006. Synthesis and study of some amino derivatives of triazinyl stibene series as fluorescent whitening agents. Jour Chem Soc Pak. 28(2):183‐186.
- Anliker R. 1975. History of whitening. Environ Qual Saf Suppl. 4:12‐18.
- Ayama M, Akatsu T, Toriumi E, Mukai K, Kanaya S. 2003. Whiteness perception under different types of fluorescent lamps. Color Res Appl. 28(2):96‐102.
- Choudhury AKR. 2006. Textile preparation and dyeing. Enfield (NH): Science Publishers. 834 p.
- [CIE] Commission International de l’Éclairage. 2004. Colorimetry. 3rd ed. Vienna (Austria): CIE. Publication No. 15:2004. 72 p.
- [CIE] Commission International de l’Éclairage. 2013. TC 1-36: fundamental chromaticity diagram with physiologically significant axes. 2013 Jan report (personal communication).
- Color and Vision Research Laboratory. New CIE XYZ functions from the CIE (2006) LMS functions. 2013. <http://www.cvrl.org/>Accessed 2013 Jun 14.
- Csuti P, Schanda J, Harbers G, Petluri R. 2011. Getting color right: improved visual matching with LED light sources. PLDC 3rd Global Lighting Design Convention; 2011 Oct 19-22; Madrid, Spain.
- Csuti P, Schanda J, Petluri R, McGroddy K, Harbers G. 2011. Improved color matching functions for better visual matching of LED sources. Proceedings of the 27th session of the CIE; 2011 Jul 10-15; Sun City, South Africa. CIE 197:2011.
- David A, Krames MR, Houser KW. 2013. Whiteness metric for light sources of arbitrary color temperatures: proposal and application to light-emitting-diodes. Opt Express 21(14):16702‐16715.
- Dunn-Rankin P, Knezek GA, Wallace S, Zhang S. 2004. Scaling methods. 2nd ed. Mahwah (NJ): Lawrence Erlbaum Associates. 254 p.
- Fotios SA. 2006. Chromatic adaptation and the relationship between lamp spectrum and brightness. Lighting Res Technol. 38(1):3‐17.
- Fotios SA, Cheal C. 2007. Lighting for subsidiary streets: investigation of lamps of differnet SPD. Part 2—Brightness. Lighting Res Technol. 39(3):233‐252.
- Fotios SA, Houser KW. 2013. Using forced choice discrimnation to measure the perceptural response to light of different characteristics. Leukos. 9(4):245‐259.
- Ganz E. 1979. Whiteness formulas—a selection. Appl Optics. 18(7):1073‐1078.
- Griesser R. 1994. Assessment of whiteness and tint of fluorescent substrates with good interinstrument correlation. Color Res Appl. 19(6):446‐460.
- Griesser R. 1996. CIE whiteness and tint: possible improvements. APPITA J. 49(2):105‐112.
- Hall JB, Hefferren JJ, Olsen NH. 1970. Study of fluorescent characterstics of extracted human teeth by use of a clinical fluorometer. J Dent Res. 49(6):1431‐1436.
- Harper WJ. 1974. On the interpretation of preference experiments in illumination. J Illum Eng Soc. 3(2):157‐159.
- Hartles RL, Leaver AG. 1953. The fluorescence of teeth under ultraviolet irradiation. Biochem J. 52(2):632‐638.
- Houser KW, Fotios SA, Royer MP. 2009. A test of the S/P ratio as a correlate for brightness perception using rapid-sequential and side-by-side experimental protocols. Leukos. 6(2):119‐138.
- Hunger K, editor. 2003. Industrial dyes: chemistry, properties, applications. Kelkheim (Germany): Wiley-VCH. 648 p.
- [ISO] International Organization for Standardization. 2004. Paper and board—determination of CIE whiteness, D65/10° (outdoor daylight). Jersey City (NJ): ISO. 11475:2004. 12 p.
- [ISO] International Organization for Stadardization. 2010. Paper and board—determination of CIE whiteness, C/2° (indoor illumination conditions). Jersey City (NJ): ISO. 11476:2010. 13 p.
- Jordan BD, O’Neill MA. 1991. The whiteness of paper—colorimetry and visual ranking. Tappi J. 74(5):93‐101.
- Judd DB. 1935. A method for determining whiteness of paper. Paper Trade Journal. 100(21):40‐42.
- Katayama I, Fairchild MD. 2010. Quantitative evaluation of perceived whiteness based on a color vision model. Color Res Appl. 35(6):410‐418.
- Katayama I, Iiyama M, Masumi K. 2002. Effect of spectral distribution of an illuminant on perceived whiteness. J Light Vis Environ. 25(2):41‐50.
- Krais P. 1929. On a new black and a new white. Melliand Textil Int. 10:468-469.
- Kuriki I, Uchikawa K. 1996. Limitations of surface-color and apparent-color constancy. J Opt Soc Am. 13(8):1622‐1636.
- MacAdam DL. 1934. Specification of whiteness. J Opt Soc Am. 24:188‐191.
- Quellman EM, Boyce PR. 2002. The light source color preferences of people of different skin tones. J Illum Eng Soc. 31(1):109‐116.
- Rea MS, Freyssinier JP. 2013a. White lighting. Color Res Appl. 38(2):82‐92.
- Rea MS, Freyssinier JP. 2013b. White lighting for residential applications. Lighting Res Technol. 45(3):331‐344.
- Royer MP, Houser KW. 2012. Spatial brightness perception of trichromatic stimuli. Leukos. 9(2):89‐108.
- Wei M, Houser KW. 2012. Status of solid-state lighting based on entries to the 2010 US DOE Next Generation Luminaire competition. Leukos. 8(4):237‐259.
- Zwinkels JC, Noel M. 2011. CIE whiteness assessment of papers: impact of LED illumination. Proceedings of the 27th session of the CIE; 2011 Jul 10-15; Sun City, South Africa. CIE 197:2011.
APPENDIX A: COUNTERBALANCING IN THE EXPERIMENTS, ANALYSIS OF APPARENT BIAS, AND DATA CREDIBILITY
A.1. Sorting
Twenty participants completed the sessions in the left booth and 20 completed the session in the right booth. No significant difference was observed between the two booths, as tested by Wilcoxon signed rank test at the α = 0.05 level. The ranks were pooled and analyzed together, as summarized in –.
A.2. Forced Choice
In order to counter a possible positional bias associated with the side-by-side method [Fotios and Houser Citation2013], all possible pairs of the five lamp types were presented to each participant in left–right and right–left scenarios—for example, BLED in the left booth versus filtered halogen in the right and BLED in the right booth versus filtered halogen in the left. Thus, each participant viewed a pair of whiteness standards under 20 pairs of dissimilar light settings. Another five pairs of null condition trials (that is, same lamp type in both booths) were presented, one for each lamp type. In total, each participant evaluated 25 comparisons for W81.9 versus W83.3 and another 25 comparisons for W140.1 versus W140.6. The order of comparisons was randomized [Fotios and Houser Citation2013].
Due to the small difference in W between the two standards in each pair, the position of the two standards was counterbalanced between participants—20 participants experienced the lower W in the left booth and 20 experienced the lower W in the right. The order of the two pairs of standards was also counterbalanced between participants.
The selection of W81.9 versus W83.3 or W140.1 versus W140.6 under the illumination of each lamp type was not significantly different from 50% versus 50% (50/50), as tested by the chi-square goodness-of-fit test at the α = 0.05 level. The participants did not observe differences between the two standards in each pair even though their CIE whiteness values were slightly different. The position of the two standards within each pair was counterbalanced, so that the selection of left versus right was expected to be 50/50. Eight of the 10 pairs, labeled with asterisks in Fig. A1, had significant difference between the selection of left versus right, as tested by the chi-square goodness-of-fit test at the α = 0.05 level. However, such a bias was not consistent for the five lamp types—for example, the right booth was always selected under the illumination of 6.5%-VLED, but the left booth was selected under illumination from BLED. The likely cause of this apparent positional bias is differences between lamps in the two booths, which is further addressed below. The independence between position and whiteness standard was not rejected for each of the 10 pairs, as tested by the chi-square test of independence at the α = 0.05 level.
Fig. A1 Results of trials of null conditions included in the forced-choice task: (a) W81.9 versus W83.3 and (b) W140.1 versus W140.6. The trials having significant difference between left and right are labeled with an asterisk (*) at the horizontal axis. Though these were expected to be null-condition trials, participants were able to discern differences due to differences in the whiteness standards and lamps of the same type, both of which were intended to be the same but were not.
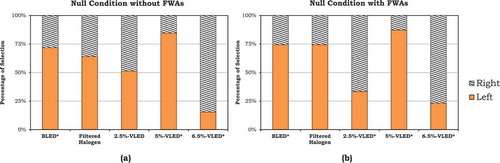
Fig. C1 Illustration of differences between booths during null-condition trials. The chromaticity coordinates of the one pair of whiteness standards used in forced choice (W81.9 versus W83.3) under the illumination of five lamps in the two booths. The solid points were measured in the right booth and the hollow points were measured in the left booth. The dashed line corresponds to the BB-470-nm line; the grey region represents tint values of ±3.
When disregarding the null condition trials, the left room was selected 51.4% of the time for the standards without FWAs and 53.3% for those with FWAs, both of which were not statistically different from 50% (with P values of 0.431 and 0.063, respectively, as tested by the chi-square goodness-of-fit test). Only one of the 20 pairs of illumination had a significant difference between the selection of the left booth and right booth. No difference was observed between the selection of W81.9 versus W83.3 or W140.1 versus W140.6 under the illumination of each lamp pair. Thus, no significant bias existed between the comparisons of lamp pairs. Lamp type, position, and whiteness standards were independent of each other for each of the 20 pairs of the lamp types by testing marginal independence. Thus, selections made by participants were due to their perceptions of the whiteness standards under the light settings.
A.3. Selection
The position of the reference standard and the six test standards was counterbalanced between participants. Twenty participants saw the reference standard placed in the left booth and the test standards in the right booth; the other 20 saw the reverse. The error bars in show the difference between the conditions when reference standard was placed in the left and right booths. Only 9 of the 150 pairs had a bias between left and right, as tested by the chi-square test of independence at the α = 0.05 level. The possible reason for these biases is the difference between the booths, as addressed in Appendix C.
APPENDIX B: SELECTION OF CMFS
Five sets of CMFs were considered in the analyses: CIE 1931 2°, CIE 1964 10°, TC 1-36 2°, TC 1-36 10°, and the University of Pannonia 2° CMFs. The 1931 and 1964 CMFs were considered because they are the default standards in the current CIE system of colorimetry. The TC 1-36 2° and 10° CMFs were tentatively proposed by TC 1-36 in January 2013 [CIE Citation2013; Color and Vision Research Laboratory 2013]. We evaluated them here because they may eventually supplement or replace the 1931 and 1964 CMFs. Others have proposed use of the University of Pannonia CMFs for 2° fields [Csuti, Schanda, Harbers, and Petluri Citation2011; Csuti, Schanda, Petluri and others Citation2011], and we evaluated them in our work in an effort to be thorough.
The chromaticity coordinates of all standards under illumination from the five lamp types in both booths were computed using these five sets of CMFs. The five sets of plots of chromaticity were compared to the results of the three experimental sessions. All of the plots are available upon request. Both the CIE 1964 10° and the TC 1-36 10° CMFs yielded comparable results and both successfully explained the results of our psychophysical experiments. The other three sets were unsuccessful at quantifying the psychophysical results. In consideration of the above we employed the TC 1-36 10° CMFs in this article.
APPENDIX C: DIFFERENCES BETWEEN THE BOOTHS
The plot of the chromaticity of the standards under different illumination reveals small difference between the two booths, which was likely the reason for the small biases found in the forced-choice and selection sessions.
In the forced choice session, a position bias was found in the null condition trials, as shown in Fig. A1. The standards under BLED or 5%-VLED in the left booth and under 6.5% in the right booth were always selected. Figure C1 shows the difference of the standards between the two booths. It can be observed that both W81.9 and W83.3 are whiter in the left booth under 5%-VLED, BLED, and filtered halogen; they are whiter in the right booth under 2.5%- and 6.5%-VLED.
In the selection session, the differences in chromaticity of the whiteness standards between the booths is consistent with the position biases that were found for the nine of the pairs noted above; detailed figures are available upon request.
Chromaticity plots based on the TC 1-36 10° CMFs were able to explain most of the biases found in the experiment. Some small errors still exist, which are believed to be caused by random error and measurement noise, and which do not compromise the strong overall trends.
APPENDIX D: ALTERNATIVE METHOD TO COMPUTE WHITENESS VALUES WITH MIXED ADAPTATION
The range of CCT for the five lamps in our experiments was 2821–2895 K. When evaluating lamps side by side with mixed adaptation, we can reasonably assume that participants were adapted to illumination of about 2850 K, which is the mean CCT of all five sources. We propose a possible alternative method to compute whiteness values with mixed adaptation. When a blackbody radiator at 2850 K is employed as a fixed reference for all five lamps and the TC 1-36 10° CMFs are employed, (D1) becomes
Figure D1 illustrates the whiteness values of each standard under each lamp type computed with (D1).
Fig. D1 New whiteness value of the standards under the illumination of the five lamps by using (D1), a whiteness formula with an adaptation to a 2850 K illuminant on blackbody locus. The dashed line shows the diagonal x = y. The standards under the filtered halogen and the three VLEDs show increased whiteness with CIE whiteness values. All of the standards have simliar whiteness under BLED. The trends corraborate the results from the forced-choice and selection experiments, when the observers were looking at the standards with mixed chromatic adaptation. The standards under 2.5%-VLED have similar whiteness values compared to those under the filtered halogen.
By using this formula, the relationship of the whiteness value for the pairs of W81.9 versus W83.3 and W140.1 versus W140.6 corroborate the results of the forced-choice experiment. Figure D1 also provides quantitative support for the results of the selection sessions. In short, the results from forced-choice and selection sessions with mixed adaptation can be explained by (D1), with the results as plotted in Fig. D1. As can also be observed in Fig. D1, 2.5%-VLED and filtered halogen yield similar whiteness values as computed by (D1) under this condition of simultaneous side-by-side viewing with mixed adaptation.
It is instructive to compare the effects of chromaticity shift and FWA excitation in Fig. D1: as can be seen for the BLED, a blue shift of the source’s chromaticity raises the whiteness value across the board (in mixed adaptation settings) but does not differentiate objects with and without FWAs, leading to an inaccurate rendering of whiteness.
APPENDIX E: ENGINEER THE LIGHT SOURCE OR THE MATERIAL?
One might consider two fundamentally different approaches to whiteness rendering: (1) engineer the SPD of a lamp so that it appropriately excites FWAs; (2) purify materials such that less FWAs are needed to achieve a desired degree of whiteness. Both are theoretically plausible engineering strategies, approached from different sides of the problem. As expanded upon below, however, it is not trivial to purify white materials, and those materials that are purified (for example, barium sulfate, polytetrafluoroethylene) are not viable for mass-market goods.
As a way of comparison, consider the experience of color. Colored dyes are employed to create colored materials, and measures of color rendition are employed to characterize the ability of a light source to render color in objects. Light source SPD and the spectral reflectance distribution of objects are both important to achieve desired color. In a comparable manner, both a light source’s SPD and an object’s material properties are important for the rendition of achromatic color (for example, lightness, blackness, whiteness).
Imagine a retail environment that contains an array of white objects with different amounts of FWAs. If we consider this to be a fully adapted situation under a single light source type, then materials that have different amounts of FWAs will have different degrees of whiteness—but only if the light source illuminating them contains violet or UV radiation. Thus, the material and the source are both necessary considerations; one cannot reliably replace the other.
One may in principal consider replacing the FWAs by nonfluorescent whites of higher purity. Realistically, however, there is a limit to how much purification can be achieved in a material for commercial goods. The current state of the art is already the result of a significant industrial effort spanning many decades. FWAs have been introduced specifically to address this limitation. It follows that we do not foresee a future where there is less reliance on FWAs. If a company is interested in marketing and differentiating a product with its white appearance, then there will be reason to employ FWAs. We anticipate that practical considerations will continue to drive the use of FWAs. In this sense, suggesting that manufacturers stop using FWAs would be akin to requesting that they cease to use certain dyes because they are poorly rendered by a specific lighting technology; this is probably not a reasonable expectation. Thus, the complementary side—that is, the intrinsic potential of a light source to excite FWAs—will continue to be important.
In summary, though the object and source sides of whiteness rendition are distinct, they are also mutually dependent. Materials and light sources must both be engineered for the rendition of white.