
ABSTRACT
The impression of a space depends highly on the illumination in the space, which usually is a combination of electric light and daylight. In the present study, we compared three methodologies to study the influence of electric light and daylight on the perception of the light and the perception of the atmosphere of the space. In two experiments, rating scales were used (with a blocked and a random design, respectively) and in a third experiment the paired-comparison method was used to evaluate the light and the atmosphere of the space. In all experiments, visualizations were used to create differently illuminated spaces. All methodologies showed similar effects of daylight and electric light, which attests to the convergent validity of the research methods. However, the methodologies revealed different effect sizes, rendering the paired-comparison design most sensitive to detect the smallest differences. The results also allowed us to explore the contribution of electric light and daylight in creating an atmosphere. The use of visualizations enabled us to control the luminance of daylight and to disentangle the effects of daylight entering a window from the view from a window. The outcomes show that daylight plays a smaller role than electric light on the perception of light and atmosphere in a space when the luminance of daylight is controlled and there is no view outside.
1. Introduction
Atmospheric elements influence the perception and impression of a space; in particular, lighting may have a major impact [Countryman and Jang Citation2006; Naqshbandi and Munir Citation2011]. A space can, for instance, be perceived as larger, more beautiful, or more pleasant by adjusting its lighting [Durak and others Citation2007; Flynn and others Citation1973]. A more beautiful impression may be very relevant for a high-end hotel to attract customers [Naqshbandi and Munir Citation2011], whereas a more pleasant impression may be used in a hospital to make people feel more comfortable [Arneill and Devlin Citation2002]. Research in the retail domain has shown that lighting can also alter the perceived image of a store; it can make a store be perceived as more modern or more high-class [Schielke Citation2015a]. Hence, the lighting design can be of great value to create a dedicated impression for a given context.
The emergence of light emitting diodes (LEDs) has introduced many new possibilities to vary the light in a space. Most LED-based light systems can easily change the intensity and chromaticity of the light and, by means of special optics, the size and shape of the light beam. In combination with the LED’s small form factor, it is possible to create almost any desired lighting design. However, these endless possibilities require a solid understanding of the effect of light on the impression of a space in order to create pleasant and application-tailored lighting. Additionally, there is the important contribution of daylight to the electric light in many spaces. Because daylight affects the physical intensity, spatial distribution, and color of the light in a space and is highly fluctuating, it may affect the desired impression.
In order to study effects of electric light and daylight on the impression of a space in a scientific study, methodological choices have to be made. Good research practice asks for fully randomized designs, while controlling as many confounding factors as possible. However, this is not always practically feasible. In addition, although a rating scale methodology is often used in this domain, a forced-choice methodology may offer advantages but also has certain drawbacks. Therefore, the aim of the current article is to compare different methodologies investigating the effects of light on a space’s impression. To this end, this study tests three methodologies; that is, two rating-scale designs and a paired-comparison design. In order to motivate this study, a literature review is provided describing current knowledge on the effects of electric light and daylight on affective appraisal. In addition, the advantages and drawbacks of rating-scale designs versus paired-comparison designs, including their potential impact on the outcomes, are reviewed.
2. Literature
2.1. Measuring environmental assessments and atmosphere
Several researchers have measured the subjective impression of an illuminated room. In the well-known study of Flynn and others [Citation1973], three main factors were used to differentiate the impression of illuminated spaces: perceptual clarity, spaciousness, and pleasantness. Others have used adapted and extended versions of the factors used in the study of Flynn and others [Citation1973] and also found significant relationships between various light configurations and a space’s impression [Durak and others Citation2007; Houser and others Citation2002]. Russell and Pratt [Citation1980] took a slightly different approach and developed a questionnaire to measure the affective quality attributed to an environment.
Related to the latter approach, Vogels [Citation2008] developed a Dutch questionnaire to assess a space in terms of its atmosphere, which is a measure of the affective appraisal of a space. In later studies, this questionnaire was used in the English language, too. A factor analysis revealed that atmosphere can be described by four dimensions, namely, coziness, liveliness, tenseness, and detachment. Notice that the concept of atmosphere describes a person’s appraisal of the space in terms of its expected affective effect yet yields no value judgment. Hence, one atmosphere is not inherently better than another. A preferred atmosphere may depend on, among others, age [Kuijsters and others Citation2012] and culture [Liu and others Citation2014]. Subsequent research with the atmosphere questionnaire revealed relationships between the perceived light in a space and its atmosphere. Vogels and others [Citation2008] found, among others, that increasing the luminaires’ intensity in a room resulted in a significant decrease in coziness and tenseness and a significant increase in liveliness and detachment in that room. A recent study of Stokkermans and others [Citation2017] extended this line of work and revealed clear relationships between the light’s brightness and perceived uniformity on the four atmosphere dimensions. Others have used the questionnaire to investigate effects of dynamic light [Wang and others Citation2014] or to address the impact of light in retail environments in a field study [Custers and others Citation2010].
2.2. Daylight and affective appraisal
Most studies that measure the effect of light on the impression of a space through the use of a lab environment usually only include electric light, because that can be easily controlled. Field studies often have to deal with a combination of daylight and electric light. Literature has shown that daylight in office environments improves users’ satisfaction with the lighting and the space [Veitch and others Citation2005]. It is also known that people prefer a space lit by daylight over electric light [Heerwagen and Heerwagen Citation1986] and that daylight may result in more positive evaluations on, among others, aesthetics [Haans Citation2014; Moscoso and Matusiak Citation2015]. Effects of daylight may be caused by different aspects; for example, daylight increases the light intensity, it provides dynamics, it has a particular (varying) correlated color temperature (CCT), and it is often accompanied by a view outside. However, how daylight per se exactly affects our environmental appraisal is not known, because it is difficult to disentangle this from those other aspects [Beute and De Kort Citation2013]. Because daylight alters the spatial distribution, the intensity, and the color of the light in a space, we hypothesize that the presence of daylight may also affect the atmosphere of a space.
A recent study investigated the effect of adding diffuse daylight to various electric light conditions on the perception of light and atmosphere [Stokkermans and others Citation2015]. In this study, only the influence of the daylight itself was investigated, meaning that participants only saw the daylight that entered the window of a space, without having a view out of the window. However, daylight hardly had any effect on the subjective judgments of brightness, uniformity, color, and atmosphere. This result was surprising in view of the well-documented effects of changes in electric light on atmosphere perception as well as the often reported appreciation of daylight. As argued in the paper of Stokkermans and others [Citation2015], the effects of daylight on light and atmosphere perception may have been small because diffuse daylight without a direct sunlight component was studied and hence effects on luminance and contrast were relatively small.
2.3. Methodological considerations
The results found in the experiment of Stokkermans and others [Citation2015] may also have been affected by the specific methodology used [CIE Citation2014]. The experiment used a rating-scale method in combination with a blocked design, where the conditions with daylight and without daylight were presented in separate sessions. The choice for the blocked design had a practical reason: to avoid frequent opening and closing of the window blinds. However, this may also have resulted in smaller differences on the rating scales, compared to a fully randomized design. Research has shown that the response on a rating scale for one particular stimulus is influenced by the range of the other stimuli presented in the same session [Fotios and Cheal Citation2010a; Ridder Citation2001]. Thus, in a blocked design, the reference for rating the light conditions with and without daylight was different, which may have led to smaller differences on the rating scales than when the same reference would have been used [Fotios and Atli Citation2012; Fotios and Houser Citation2009; Poulton Citation1977; Tiller and Rea Citation1992].
An alternative strategy to avoid response bias on rating scales is to use a paired-comparison paradigm. In such an experiment, two stimuli are presented as a pair, and they have to be compared mutually on a particular criterion. After comparing all possible pairs of stimuli, all stimuli can be ordered on an interval scale. As such, a paired-comparison experiment does not require a reference and it usually detects smaller differences between the stimuli, because participants are forced to choose between two stimuli that might get equal scores on a rating scale. Additionally, a direct comparison makes differences between the stimuli very apparent, which makes a paired-comparison paradigm more likely to reveal potential effects of daylight, if present. However, the method also has its disadvantages, because successively presenting the stimuli requires participants to memorize one stimulus in order to compare it to the other stimulus, and when the light conditions are presented simultaneously the participants need to make eye movements and, hence, will not fully adapt to the stimulus [Braun and others Citation1996; Fairchild and Reniff Citation1995]. Despite these different advantages and disadvantages, Fotios and Cheal [Citation2010b] demonstrated that brightness assessments did not differ using successive or simultaneous paired-comparison modes. To increase the robustness of conclusions, it is argued that because different experimental designs have different weaknesses and strengths, they should be, whenever possible, used complementary to each other [CIE Citation2014; Houser and Tiller Citation2003].
2.4. Visualizations
The use of computer-generated visualizations allows us to study multiple methodologies. They make it more convenient to fully randomize conditions with and without daylight, and they better suit the paired-comparison paradigm, because they allow switching between light conditions with and without daylight without any temporal delay or even presenting them simultaneously. In addition to these advantages, the effect of daylight can be studied under better experimental control, because the introduced daylight is not influenced by fluctuations in weather circumstances or time of day. Moreover, visualizations enable disentangling some of the aspects that daylight entails, facilitating a deeper understanding of how daylight may affect the impression of an environment. In addition, various types of daylight (that is, diffuse daylight and daylight with a direct sunlight component) can be created in any space.
Several studies have investigated the use of visualizations in research as an alternative to using real environments. Murdoch and others [Citation2015] and Schielke [Citation2015a] demonstrated that assessments of electric light from visualizations corresponded to a high degree with assessments in a real space. Attributes that were less well conveyed were color temperature (warm–cool) and chromaticity (colored–colorless) [Schielke Citation2015b]. The authors attributed this to the lack of color calibration for the projector and monitor. The largest differences found by Murdoch and others [Citation2015] were for brightness, which proved to be especially difficult to be conveyed for dimmed light conditions. Others have studied the use of images and visualizations to assess effects of daylight. Moscoso and others [Citation2015] demonstrated that stereoscopic images may be used as an alternative for a real environment to evaluate the impact of daylight on aesthetics. Stokkermans and others [Citation2015] compared the effect of adding diffuse daylight to electric light in a real space and in computer-generated visualizations. Except for perceived color, no significant difference was found for the light and atmosphere attributes. The scenes with daylight were perceived as cooler in the visualizations than in the real space. A reason for this could be that the daylight in the 3D virtual model was created by a blue-sky dome around the space, whereas the color of the daylight entering the real space changed due to reflections with other buildings, trees, and other environmental elements.
2.5. Objectives of the current study
The present study aimed to investigate the impact of research methodology on effects of light conditions on the perception of light and atmosphere of a space. We included spaces with electric light that was combined with or without diffuse or direct daylight. To this end, a rating-scale methodology in which all conditions were presented randomly was compared to a paired-comparison methodology, both employing computer-generated visualizations. Within a particular methodology it is not always practically feasible to fully randomize all conditions. It is important to better understand the consequences of such choices in the experimental design. The outcomes were therefore also compared to outcomes of a previously reported experiment [Stokkermans and others Citation2015] in which the conditions with daylight and without daylight were presented in separate sessions—that is, in a “blocked” order—and rating scales were used to evaluate the conditions. The latter experiment has already been described in Stokkermans and others [Citation2015], but in order to provide a thorough comparison, we include a description of its methodology here as well. We expected a paired-comparison paradigm to reveal larger effects than any of the rating-scale designs. We also expected that a rating-scale methodology with a completely randomized presentation would yield (relatively) larger effects of daylight than one with a blocked presentation with separate sessions for daylight and no daylight conditions, because in the first methodology participants would use the same reference for all spaces, whereas they may use different ones in the second one.
The light conditions were used as a way to study the impact of the methodology. However, they also allowed us to compare the effects of electric light and daylight. Therefore, the second aim of the study was to compare the contribution of different types of daylight (direct and diffuse) and electric light on the perception of the light and atmosphere in a space. The use of visualizations allowed us to control the luminance of daylight and to disentangle the effects of daylight entering a window from those of the view from a window. Because we were mainly interested in effects of light, participants were not able to look at or out of the window.
3. Methods
3.1. Experimental design
The original, blocked design experiment, reported in Stokkermans and others [Citation2015], used a five (electric light condition) by two (daylight) full-factorial within-subjects design. The independent variable electric light condition consisted of five levels, which were assessed in a random order. The light in the five electric light conditions was varied in intensity, CCT, color, and spatial distribution. The independent variable daylight consisted of two levels, namely, “no daylight” and “diffuse daylight,” assessed in two separate blocks. Several rating scales were used to assess all 10 light conditions.
In the current experiment, a five (electric light condition) by four (daylight) by two (methodology) fractional-factorial within-subjects design was used. The independent variable electric light condition consisted of five levels, equal to those of the original experiment. The variable daylight consisted of four levels: “no daylight,” “diffuse daylight,” “direct daylight 1,” and “direct daylight 2.” No daylight and diffuse daylight were assessed for all five electric light conditions. Additionally, the two direct daylight conditions were assessed for only one particular electric light condition. This resulted in 12 light conditions. Two methodologies were assessed; the first made use of rating scales and the second used the paired-comparison method. For the rating-scale methodology, the 12 light conditions were assessed on all dependent measures in a random order. For the paired-comparison methodology, all 12 light conditions were compared to each other, leading to 66 comparisons per dependent measure. All comparisons were presented in a random order per dependent measure. The dependent measures were assessed in a counterbalanced order.
3.2. Participants
Twenty-eight (13 female and 15 male) participants had joined the original, blocked design experiment. Their average age was 25.0 years with a standard deviation of 2.7 years. Twenty-six (9 female and 17 male) persons with an average age of 28.1 years and a standard deviation of 7.7 years participated in the current experiment. The sample size for the current experiment was calculated with a power analysis using G*Power software (Faul and others [Citation2007]). The effect size of the effect of daylight used in this analysis was based on that found in the original experiment (the study of Stokkermans and others [Citation2015]). None of the participants showed color vision deficiencies on the Ishihara color test. Participants reported to have normal or corrected-to-normal vision. Both experiments were approved by the review board of Eindhoven University of Technology, adhering to the Code of Ethics of the Dutch Institute for Psychologists, and by the ethical committee of Philips Research, adhering to the declaration of Helsinki.
3.3. Experimental setup
Both the present and the original experiments made use of computer visualizations of a space in which various light conditions were created. All visualizations were presented on a calibrated 46-inch NEC P462 Full-HD display (NEC Display Solutions, Itasca, IL, USA; minimum luminance was 0.1 cd/m2 and maximum luminance was 277 cd/m2), which was placed on a table 1 m from the observer. For the rating-scale methodology, all visualizations were presented full-screen (1920 × 1080 pixels). For the paired comparisons, two visualizations were presented side by side. The images were scaled to 900 × 506 pixels and surrounded by a grey background with a luminance of 36 cd/m2. There was no ambient light present in the room where the experiment took place.
3.4. Virtual space
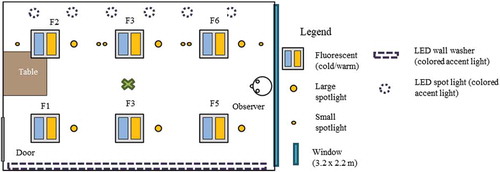
To create the visualizations, we used a rendering pipeline that was previously assessed as most perceptually accurate compared to a real space by Murdoch and others [Citation2015]. First, a 3D virtual model of the space was created using 3DSmax (Autodesk, Mill Valley, CA, USA). The virtual space was a replication of a real space with a size of 6.3 (length) × 3.8 (width) × 3.0 (height) m. The space had white walls and a grey carpet and was furnished with a table. A schematic floor plan of the space is shown in . The participants’ view of the virtual space was equal to that of an observer situated in the space as indicated in . This view of the 3D model was rendered using Indigo Renderer and tone mapped with Reinhard ’02 TMO (Reinhard and others [Citation2002]). A full description of this imaging pipeline and justifications for the choices made for every step in this pipeline can be found in Murdoch and others [Citation2015].
Fig. 1 Schematic floor plan of virtual 3D space.
3.4.1. Electric light
The space could be illuminated by various types of luminaires. The ceiling contained six fluorescent light fixtures providing white diffuse light, six halogen spots providing white directional light on the wall (hereafter referred to as small spotlights), and six halogen spots providing white directional light on the floor (hereafter referred to as large spotlights). In addition, colored directional light could be provided on the right wall by six LED spots mounted on the ceiling, and colored diffuse light could be provided on the left wall by six wall washers located on the ground. The color and direction of the electric light in the virtual space were based on measurements of the light in the physical space. The CCT and color of the light were measured in the real space with a PhotoResearch SpectraDuo PR 680 camera (Syracuse, NY, USA) and could be reproduced in 3DSmax and in the Indigo Renderer software. The direction of the light was created by the virtual 3D model of the luminaires and based on measured goniometry in the real space. The absolute light intensity of the light in the virtual space was limited by the dynamic range of the display and could not match the light intensity in the physical space. Therefore, the intensity of the light in the virtual space was based on the brightness in the real space. This was based on guidelines provided by Reinhard and others [Citation2002] and insights of Murdoch and others [Citation2015]. Eventual fine-tuning was done by means of a small pilot study in which observers had to tune the light intensity settings in the virtual space, such that the brightness of the virtual space matched the brightness of the real space. Two factors could be varied: (1) the ratio of the intensity of the various luminaires and (2) the key value of the Reinhard ’02 TMO, which is a factor controlling the average luminance of the whole visualization [Reinhard and others Citation2002].
Five electric light conditions were created, varying in spatial distribution, intensity, CCT, and colored accent light. An overview including more details of these light conditions is presented in , and each condition is depicted in the first column of . The light conditions were not created to systematically study variations in electric light parameters but were designed to represent a large variation of electric lighting designs:
The first electric light condition was fully uniform, created with six fluorescent luminaires with a high CCT and a low intensity.
The second electric light condition was also created with six fluorescent luminaires with a low intensity but a low CCT.
The third electric light condition was created with the large and small halogen spotlights set at a low intensity with a low CCT, resulting in a nonuniform distribution of the light. The large spotlights were directed at the floor, whereas the small spotlights were directed at the right wall, as seen from the position of the observer.
The fourth electric light condition was similar to electric light condition 3 with the addition of colored accent light created by means of the LED spots and LED wall washer. The LED spots, directed at the right wall, were colored orange, and the light from the wall washer on the left wall was colored blue.
The fifth electric light condition was created with the fluorescent luminaires at a high intensity and high CCT, as well as with the LED spots and LED wall washer. The LED spots were colored blue, and the light from the wall washer was colored cyan.
Table 1. Overview of light characteristics and luminance calculations of the light conditions. Michelson contrast was calculated by (Lmax − Lmin)/(Lmax + Lmin).
Fig. 2 Visualizations of the light conditions used in the experiments. The first column depicts all light conditions without daylight. The second column depicts the same light conditions in the presence of diffuse daylight. The third and fourth columns depict light condition 4 in the presence of two types of direct daylight.
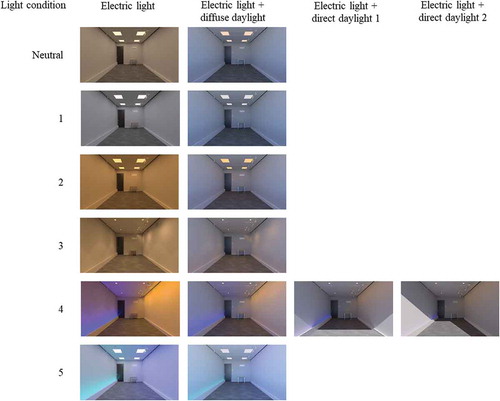
Additionally, a neutral electric light condition was created, which was, in the experiments, shown in between the other conditions, to avoid a direct comparison to the previous condition. It was fully uniform with a medium CCT and a low intensity, such that adaptation effects with the previous and subsequent light conditions were minimal.
3.4.2. Daylight
The virtual space contained a window, similar to the real space. The window was situated behind the observer, as indicated in . Hence, the observer could see the daylight that entered the space but he or she could not look out of the window. The size of the window was 3.2 × 2.2 m and the bottom of the window was located at 0.8 m from the floor. The window was directed to the north–northwest in Eindhoven, The Netherlands. Daylight in the virtual space was created with Indigo Renderer’s skylight setting, which allows one to specify the absence or presence of a direct sunlight component, and for this component the azimuth of the sun (that is, the angle of the sun to the window, where 0° means that the sunlight is perpendicular to the window) and the elevation of the sun (that is, the angle between the horizon and the center of the sun, where 0° means that the sun is at the horizon). Similar to the electric light conditions, the brightness of the daylight could be varied by the renderer’s ratio of daylight compared to electric light, and by adjusting the Reinhard TMO’s key value.
Several daylight conditions were created:
First, diffuse daylight was added to each of the five electric light conditions and the neutral light condition (that is, light condition 1d1 to 5d1, and Neutrald1 as described in and pictured in column 2 of ).
Second, direct daylight entering the space perpendicular to the window was added to light condition 4 (that is, light condition 4d2 in and in column 3 of ). This particular condition was chosen because we visually assessed the effect of direct daylight to be largest for condition 4.
Third, direct daylight entering the space at an angle was also added to light condition 4 (that is, light condition 4d3 in and in column 4 of ).
The amount of diffuse daylight was based on the ratio of the illuminance of daylight and electric light in the real space. The average illuminance of the daylight, measured on the floor in the center of the space, was 1000 lux for a typical cloudy or slightly overcast day in April. In addition the illuminance of the five electric light conditions was measured at the same location. The renderer’s ratio of daylight versus electric light (in a 200 × 200 pixel area on the center of the floor) was kept equal to the measured illuminance ratios in the real space. The key values of the daylight conditions were kept equal to those of the no-daylight conditions. Hence, the average luminance of the entire visualization was equal for the no-daylight and daylight conditions.
3.4.3. Luminance calculations of final visualizations
The mean luminances and luminance contrasts of the visualizations presented on the 46-inch NEC display are presented in . The values were calculated by converting the red–green–blue (RGB) values of the images to the CIE 1931 xyY color space, using the measured gamma and chromaticity coordinates of the primaries and white point of the display. In this color space, the Y represents the luminance of the display. Luminance values in a 40° horizontal band of the image were used to determine the mean and contrast [Loe and others Citation1994]. This horizontal band approximated the height of the front wall and extended to the left wall and right wall. The mean luminance varied between 41.6 cd/m2 and 58.2 cd/m2, with the exception of condition 5 with and without daylight, which, with 108.0 and 102.5 cd/m2 respectively, had relatively high luminances. On the other hand, the values of the conditions with direct daylight, particularly for 4d2, were relatively low. The luminance contrast was calculated as the Michelson contrast with the minimum and maximum luminance taken along the horizontal dimension of the image after averaging the luminance across the vertical dimension. The contrast for most conditions with diffuse daylight was slightly lower than for the corresponding conditions without daylight, whereas the direct daylight conditions had a higher contrast than the diffuse daylight conditions. To place these values in perspective, depicts luminance measurements of light condition 2, with and without diffuse daylight, in the 40° horizontal band in the real space on which the light effect of the visualization was based, as published before in Stokkermans and others [Citation2015].
Fig. 3 This graph depicts luminance measurements of light condition 2 taken in the 40° high band in the real space on which the light effect in the visualization was based. Luminance measurements with and without diffuse daylight are depicted, where the y-axis presents the luminance (in cd/m2) and the x-axis presents the horizontal dimension of the 40° high band in the space. This figure has been published before in Stokkermans and others [Citation2015].
![Fig. 3 This graph depicts luminance measurements of light condition 2 taken in the 40° high band in the real space on which the light effect in the visualization was based. Luminance measurements with and without diffuse daylight are depicted, where the y-axis presents the luminance (in cd/m2) and the x-axis presents the horizontal dimension of the 40° high band in the space. This figure has been published before in Stokkermans and others [Citation2015].](/cms/asset/bed9e0ee-a6dc-403d-b9a9-c51f5cfe91f6/ulks_a_1385399_f0003_b.gif)
3.5. Dependent measures
The dependent measures were three perceptual attributes describing the subjective impression of the light and four perceptual attributes describing the atmosphere of the space. The attributes to measure the atmosphere were based on the research of Vogels [Citation2008]: coziness, liveliness, tenseness, and detachment. For each dimension, two or three items were selected from the original atmosphere questionnaire that had the highest loading on the corresponding dimension, as shown in . For the rating-scale methodology, these 11 items were assessed individually and afterwards aggregated into the four atmosphere attributes. The participant indicated for every presented space how applicable each item was on a seven-point Likert scale ranging from not applicable at all to very applicable. For the paired-comparison methodology, all items belonging to one dimension were presented together, and the participant indicated for which of the two spaces the combination of items was more applicable. Hence, the participant was asked, for instance, “For which space are the terms cozy, intimate, and pleasant more applicable?”.
Table 2. Overview of atmosphere dimensions and their items.
The three light perception attributes were brightness, perceived color, and perceived uniformity. In both methodologies, all three attributes were assessed individually. For the rating-scale methodology, participants were asked to assess the light in the space on seven-point semantic differential scales, ranging from dim to bright, warm to cool, and non-uniform to uniform. For the paired-comparison methodology, participants were asked to indicate in which of the two spaces the light was perceived as brighter, cooler, and more uniform, respectively.
3.6. Procedure
In both the original and the current experiments, participants were welcomed in the experimental room, were given instructions on the procedure of the experiment, and then signed the informed consent form. Once the experiment started, all ambient light in the room was turned off.
In the original experiment, 10 visualizations were assessed—five without daylight (for electric light conditions 1 to 5) and five with diffuse daylight (for the same electric light conditions). The daylight and no-daylight conditions were presented in two separate blocks in a counterbalanced order. In each block, all visualizations were presented consecutively, in a random order, on the display. Participants were asked to look at each visualization for a minimum of 20 s to experience the space and to then assess the 11 atmosphere items and the three light attributes by entering their response in a Graphical User Interface created with Matlab, presented on a laptop (MathWorks, Natick, MA, USA). The visualization was presented as long as the participants were filling in the questionnaire, and they could take any time to answer the questions. In between these visualizations of 20 s or longer, a visualization with a neutral light condition was shown for 10 s. In the block with only daylight conditions, the neutral light condition also contained daylight, whereas the neutral light condition without daylight was used in the other block.
In the current experiment, 12 visualizations were assessed. Five without daylight (for electric light conditions 1 to 5), the five with diffuse daylight (for the same electric light conditions), and electric light condition 4 with two types of direct daylight. All visualizations were evaluated using the rating-scale methodology and the paired-comparison methodology. The order in which the methodologies were used to assess the visualizations was counterbalanced over participants. For the rating-scale methodology, all 12 visualizations were assessed in a fully random order and with a procedure equal to that of the original experiment, with the exception that the neutral light condition without daylight was used during the entire experiment. For the paired-comparison methodology, we presented the two visualizations simultaneously, side by side, on the display. The participants’ task in the actual experiment was to indicate which visualization was most applicable to the question, using the left and right arrow keys of the keyboard. In total seven questions, presented on a separate paper, were asked in successive rounds in a counterbalanced order, each round consisting of 66 comparisons. In between the comparisons, a grey field (36 cd/m2) with a duration of 1 s was shown. The order of the comparisons and the location (left versus right) of the visualizations were presented randomly.
4. Analyses
4.1. Effect of methodology
Two series of analyses were used to test whether different methodologies yielded different results on the dependent variables for light perception (brightness, perceived color, and perceived uniformity) and atmosphere perception (coziness, liveliness, tenseness and detachment). First, the results of a blocked daylight presentation, as reported in Stokkermans and others [Citation2015], were compared to those of a random daylight presentation in the current experiment. Analyses of variance (ANOVAs) were used to test for differences between these groups of rating scale data. An ANOVA is a statistical hypothesis testing tool comparing the means of different groups, using least square fitting. An ANOVA produces a P-value, which gives the probability of concluding that the null hypothesis is true (that is, that there is no difference between two or more groups). For all ANOVA analyses, results with a P-value smaller than 0.05 were considered statistically significant; that is, small enough to confidently reject the null hypothesis. Second, the difference between the rating scales and paired comparisons in the present experiment was analyzed. For comparisons using data collected employing the paired-comparison methodology, an ANOVA cannot be used. Therefore, we analyzed correlations and effect sizes to draw conclusions on the degree of similarity between data collected with rating scales and paired comparisons.
Before running statistical analyses, various factors were checked. First, outliers were identified and analyses were conducted to test whether including or excluding outliers influenced the outcomes. Second, assumptions necessary for conducting an ANOVA were checked. These included (1) normality, verified by skewness and kurtosis values, and (2) homogeneity of variance, verified by the variance ratio test for between-subjects variables and the Mauchly’s sphericity test for within-subjects variables. Last, Cronbach’s alpha values were calculated to verify the internal consistency of the various items belonging to each atmosphere attribute [Field Citation2009].
4.1.1. Blocked versus random presentation
To evaluate the difference between blocked versus random presentation, a mixed between- and within-subjects full-factorial ANOVA with three factors was conducted. These factors were electric light condition, daylight, and rating-scale methodology. The factors daylight and electric light condition were both assessed within subjects and had two and five levels, respectively. For daylight, these levels were “no daylight” and “diffuse daylight,” and for electric light condition the five electric light conditions as specified in were used. The factor rating-scale methodology was assessed between subjects. It consisted of two levels, namely, “blocked” and “random.” Because running multiple comparisons, each at a confidence level of 0.05, increases the chance that we falsely conclude that there is a difference in one of the comparisons, a Bonferroni correction was applied. Additionally, full-factorial repeated-measures ANOVAs for the random and blocked designs were conducted separately to determine the effect sizes (ηg2) of the light manipulations. The factors daylight and electric light condition were included in both analyses, using the same levels as for the mixed ANOVA. Guidelines are provided by Cohen [Citation1988], where an ηg2 of 0.01 is considered a small effect, 0.06 is considered a medium effect, and 0.14 is considered a large effect [Lakens Citation2013].
4.1.2. Rating scale versus paired comparison
To compare the rating scales versus the paired comparisons, we used correlation analyses and a particular kind of effect size measure. First, the results of the paired comparisons were analyzed with a generalized linear model using the GLM package in R, specifying a binominal distribution with a Probit link function (The R Foundation, Vienna, Austria). This model is used to convert the binary responses for all comparisons of all participants (for example, indicating whether light condition 1 is perceived as brighter than light condition 2 or vice versa) into a z-score for each light condition and attribute [Rajae-Joordens and Engel Citation2005; Thurstone Citation1927]. Additionally, the GLM model provides standard errors and P-values for all 66 light condition comparisons, indicating whether the differences between the light conditions is statistically significant.
We calculated the Pearson correlation between the rating scales and paired comparisons per dependent measure by taking the mean score for each of the 12 light conditions for the rating-scale methodology and the z-scores of the 12 light conditions for the paired-comparison methodology. Cohen [Citation1988] described that a Pearson correlation coefficient between 0.1 and 0.3 is considered small, a coefficient between 0.3 and 0.5 is considered medium, and a coefficient larger than 0.5 is considered large.
Additionally, we used the following method to compare the magnitude of effects found for the paired comparisons with those found for the rating scales for each dependent measure. For the paired comparisons, the differences in z-scores for each of the 66 comparisons were divided by the standard errors of those particular comparisons. For the rating scales, a similar approach was taken. First, the mean rating score of every light condition was subtracted from the mean rating score of all other light conditions. Hence, this resulted in 66 differences in mean rating score, comparing all conditions to one another. In addition, the sums of squares of the standard errors were calculated for all 66 comparisons. The effect size was then calculated per comparison by dividing the corresponding difference in mean score by the corresponding sum of squares of the standard error. To express the effect size difference between the paired comparisons and rating scales in one number for each of the 66 comparisons, we divided the effect sizes of the paired comparisons by the effect sizes of the rating scales for each comparison, basically providing an effect size ratio. A ratio larger than one means that larger effects were found with the paired-comparison methodology than with the rating-scale methodology.
4.2. Effect of light
4.2.1. Effects of daylight and electric light
The effects of daylight and electric light on atmosphere were analyzed using the rating-scale data of the present experiment. Again, ANOVAs were used to test for differences between these groups of rating scale data, after assumptions were checked. Two repeated-measures ANOVAs were conducted, using IBM SPSS Statistics 23 (Chicago, IL, USA). The first ANOVA contained two factors, namely, daylight, consisting of the levels no daylight and diffuse daylight, and electric light condition, consisting of five levels. The second ANOVA consisted of the factor daylight, based on four levels: no daylight, diffuse daylight, direct daylight 1, and direct daylight 2, and thus only used the data of electric light condition 4. In both analyses, Bonferroni corrections were applied to adjust for multiple comparisons. The dependent measures were brightness, perceived color, perceived uniformity, coziness, liveliness, tenseness, and detachment.
4.2.2. Mediation analyses
To increase our insight beyond knowing whether an effect is present (as an ANOVA shows) to also understanding how electric light and daylight affect the atmosphere attributes, mediation and moderation analyses were performed. A mediation analysis tests whether a third variable (the mediator) helps to explain this direct effect. It thus tests a causal chain where the independent variable is hypothesized to affect the mediators and these consequently affect the dependent variable. In our study, we hypothesized that the three perceptual light attributes, brightness, perceived color, and perceived uniformity, would act as mediators. Moderation analyses were run to test whether the relation between the independent variable and the mediator and the relation between the mediator and the dependent variable changed in presence of a moderator. The moderator tested in our analyses was diffuse daylight.
We performed mediation and moderation analyses with the Process macro in IBM SPSS Statistics 23 [Hayes Citation2013]. For these analyses, it was not possible to analyze all five electric light conditions and all daylight conditions at once. Therefore, we conducted 10 analyses per atmosphere dimension, each comparing two electric light conditions. To account for the 10 analyses, a Bonferroni correction was applied, such that a P-value smaller than 0.005 was considered significant. For all analyses, the condition no daylight/diffuse daylight was included as moderator. It was not possible to analyze the effect of direct daylight due to the fractional factorial design.
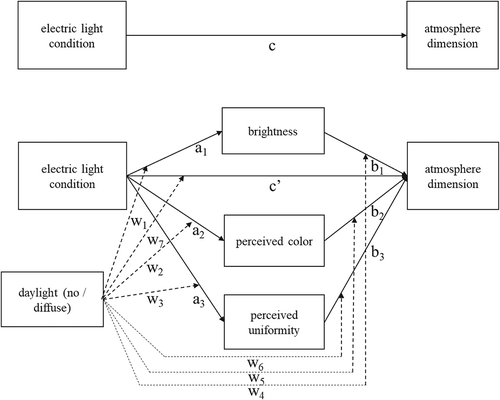
First, the total effect model, excluding mediators and moderators in the relation between electric light condition and the atmosphere attributes (as indicated by the c-path in ), was analyzed. This relation should be significant in order to proceed analyzing mediation and moderation effects. The regression coefficient and R2 of the effect of electric light condition on atmosphere were analyzed separately per attribute. Next, the effect of electric light condition on each of the four atmosphere attributes, moderated by daylight (no daylight versus diffuse) and with brightness, perceived color, and perceived uniformity as mediators, was analyzed using model 59 of the Process macro. This analysis provided regression coefficients of the a-, b-, c′-, and w-paths (also shown in ), as well as R2 values. For all analyses, the mediators (that is, brightness, perceived color, and perceived uniformity) were mean centered. In order to conclude that mediation exists, the regression coefficient of the c′-path should be lower than that of the c′-path (because the a- and b-paths explain a part of the effect). Additionally, the R2 value is expected to be higher for the model that includes mediators and moderators than for the total effect model.
Fig. 4 Schematic representation of the total effect model (shown at the top of the figure) and the mediation/moderation model (shown at the bottom of the figure). The total effect and mediation effects are indicated by solid lines and moderation effects with dashed lines.
5. Results
Outliers were identified by checking whether z-values were larger than +3 or smaller than −3 [Osborne and Overbay Citation2004]. This was done separately for the data of each experiment, condition (10 conditions for the previous experiment; Stokkermans and others [Citation2015]; 12 for the present experiment) and attribute. This resulted in six outlying data points for the original experiment and eight for the present one. Because including or excluding these data points did not affect our overall conclusions, we chose not to remove these outliers from further analyses.
The distributions of responses to the rating scales over all participants were analyzed by calculating skewness and kurtosis values per experiment and attribute. All skewness values were within the rule of thumb boundaries of −2 and 2, and all kurtosis values were smaller than 3 [Westfall and others Citation2013]. Therefore, the distribution of all attributes could be assumed sufficiently normal.
Further, internal consistency between the different items of the four atmosphere attributes was checked for both experiments by analyzing Cronbach’s alpha values (shown in ). In all cases, a Cronbach’s alpha larger than or close to 0.80 was found, indicating good internal consistency between the items.
Table 3. Cronbach’s alpha values for the four atmosphere attributes measured in experiments 1 and 2.
5.1. Effect of Methodology
5.1.1. Blocked versus random daylight presentation
shows the effect of daylight, averaged over all five electric light conditions, for presenting the daylight conditions blocked or randomly per perceptual attribute. First, it shows that almost all ratings in the random presentation mode were assessed as slightly higher than in the blocked presentation mode, potentially due to the slightly different sample of participants. Note that only daylight was presented in blocks or random, whereas the electric light conditions were presented randomly in both presentation modes. It is thus more interesting to study the change in the assessment of the attributes when adding daylight in both presentations. For the attributes perceived color and detachment, the effect of daylight seems slightly larger when presenting the daylight stimuli randomly instead of blocked. For the other attributes, the effect of daylight is very small, irrespective of whether the daylight stimuli were presented randomly or blocked.
Fig. 5 Graph per measured attribute depicting the results of a random versus blocked presentation of the daylight conditions. Each data point represents the mean over all five electric light conditions with the error bar representing the 95% confidence interval.
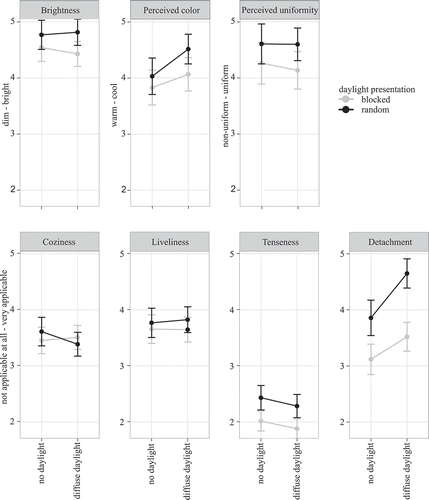
The effect of rating-scale presentation mode (blocked vs random) on light and atmosphere perception was tested with a mixed ANOVA. First, the assumption of homogeneity of variance was checked by calculating the ratio between the variance of the blocked and the variance of the random design [Field Citation2009]. The variance ratios were 1.01, 1.19, 1.15, 1.05, 1.02, 1.31, and 1.11 for brightness, perceived color, perceived uniformity, coziness, liveliness, tenseness, and detachment, respectively. These ratios are well within the boundary of approximately 2.0, as defined by Hartley’s Fmax, which indicates that the variances for both ways of presenting the daylight stimuli were equal and that the assumption of homogeneity of variance was met.
We then evaluated whether presenting daylight in a blocked or a random order affected the effect of daylight on light and atmosphere perception. As explained, we were only interested in the effect of presentation mode on the effect of daylight because this was the only factor that was presented separately per block in the original experiment. We therefore only tested the interaction between presentation mode and daylight. Results showed that this interaction was significant for the attribute detachment, F (1, 5) = 4.4, P = 0.039, ηg2 = 0.006, but not for any of the other attributes. For perceived color we did find a significant three-way interaction between presentation mode, daylight and electric light condition, F (4, 14) = 3.9, P = 0.004, ηg2 = 0.02, which indicated that the interaction between daylight and presentation mode was not the same for all electric light conditions.
Two repeated-measures ANOVAs were performed to test the effect of adding daylight to the electric light conditions for random and blocked daylight presentations, respectively. The resulting P-values and effect sizes are summarized in . They show a significant effect of daylight for perceived color and detachment irrespective of how the daylight stimuli were presented. For both attributes, however, the effect size was larger when presenting the daylight stimuli randomly (considered as a medium effect) instead of blocked (considered as a small effect). For the other attributes, adding daylight had no significant effect, regardless of the presentation mode.
Table 4. P-value and effect size (ηg2) per attribute for presenting the daylight conditions randomly versus blocked.
5.1.2. Rating-scale versus paired-comparison methodology
gives a graph for each attribute, depicting the z-scores deduced from the paired comparisons and the means of the rating scores for all 12 light conditions. Note that these outcomes cannot be directly compared; only the direction and trend can be analyzed. Error bars are not displayed, because the paired comparisons analysis only results in a standard error for each comparison. Visual inspection of the graphs suggests that all assessments are very similar between both methodologies.
Fig. 6 Effect of paired-comparison versus rating-scale methodology. Each graph (per attribute) presents the mean score of the rating-scale methodology and the z-score of the paired-comparison methodology for all light conditions.
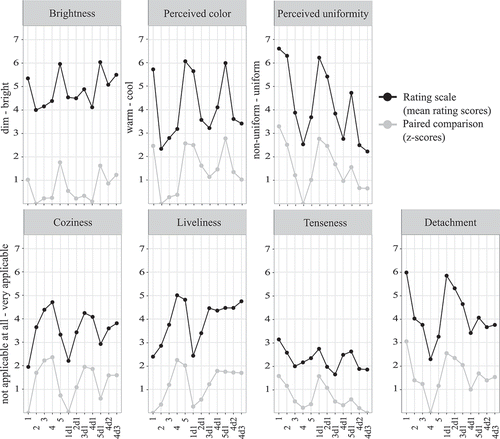
shows the Pearson correlation coefficient between the z-scores for each of the 12 light conditions resulting from the paired-comparison methodology and the mean scores for each light condition resulting from the rating-scale methodology for each perceptual attribute. For the majority of the attributes, the correlation coefficient is very high and significant, indicating a strong relationship between the paired-comparison and the rating-scale methodologies. For the attribute tenseness, the relationship is slightly weaker but still significant and strong [Cohen Citation1988]. Further, shows the median effect size ratio for each attribute, calculated as the median of the ratios between the effect size of the paired-comparison results and that of the rating-scale results. All effect size ratios are larger than 1, indicating that the paired-comparison methodology revealed larger effects of daylight and electric light condition. The effect size ratio of the effect of daylight averaged over all attributes (2.1) is approximately equal to that of the effect of electric light condition (2.2). Hence, the paired-comparison methodology overall yielded larger effects than the rating-scale methodology both for electric light condition and for daylight.
Table 5. Pearson correlation coefficient per attribute between the z-score per light condition resulting from the paired-comparison methodology and the mean score of each light condition resulting from the rating-scale methodology. Additionally, the median effect size ratio, or the effect size of the paired-comparison results divided by the effect size of the rating-scale results, is given for all attributes.
5.1.3. Effect of light conditions
graphically depicts the effects of electric light condition and daylight on all light and atmosphere attributes, using the rating-scale data with a random presentation of the daylight conditions. These data were analyzed with two repeated-measures ANOVAs: one for the effect of diffuse daylight on all electric light conditions, and one for the effect of direct and diffuse daylight on electric light condition 4. First, the assumption of sphericity was tested in order to check whether the variance across the various conditions was equal. For those attributes for which this assumption was not met, the Huyn-Feldt correction was applied to the df value [Field Citation2009]. This correction, however, did not affect the P-value such that it changed from not significant to significant or vice versa. reports when the Huyn-Feldt correction was applied and also lists all main effects of daylight, electric light condition, and their interactions.
Table 6. Overview of the outcomes of the repeated-measures ANOVAs for the main and interaction effects of daylight and electric light condition.
Fig. 7 Effect of daylight on the light and atmosphere attributes for all light conditions. Error bars represent the 95% confidence interval. Asterisks indicate the daylight conditions that differ significantly (P < 0.05) from the no-daylight condition for that particular light condition and attribute.
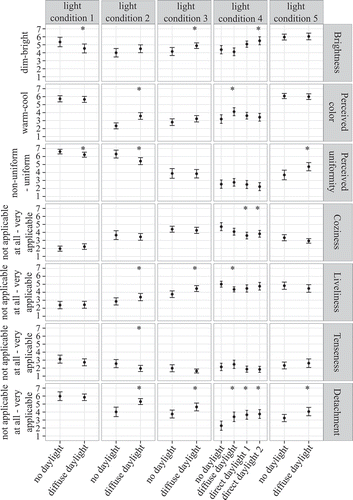
The first analysis, addressing the effect of diffuse daylight, revealed a significant main effect of daylight for the attributes perceived color and detachment. A significant main effect of electric light condition was found for all attributes. In addition, the interaction between daylight and electric light condition was significant for all attributes, except for coziness, though even for coziness the interaction effect was close to significant. Pairwise comparison analyses were performed to test which electric light conditions were significantly affected by daylight; they are indicated with an asterisk in . Electric light condition 1 was perceived as less bright in the presence of diffuse daylight, whereas electric light condition 3 was perceived as brighter. Further, electric light conditions 2 and 4 were perceived as cooler in the presence of diffuse daylight. The perceived uniformity decreased for electric light conditions 1 and 2 in the presence of diffuse daylight, whereas the reverse effect was found for electric light condition 5. Electric light conditions 2 and 3 were perceived as livelier when daylight was added to the space, whereas electric light condition 4 was perceived as less lively. For tenseness, only electric light condition 2 was perceived as less tense when daylight was added. Last, all electric light conditions, except electric light condition 1, were found to be more detached when diffuse daylight was present. Although several significant main and interaction effects of diffuse daylight were found, the effect sizes were typically considered (very) small to medium. As is clear from , the significant main effects of electric light condition typically had a much larger effect size than those found for daylight.
The second analysis, focusing on the effect of diffuse and direct daylight for electric light condition 4, revealed a significant effect of daylight for all attributes except perceived uniformity. Pairwise comparison analyses were performed to test which conditions with daylight were significantly different from the condition without daylight, as indicated by the asterisks. Both direct daylight conditions were perceived as less cozy and more detached compared to the condition without daylight. In addition, direct daylight condition 2 was perceived as brighter compared to the condition without daylight.
5.1.4. Mediation analyses
First, the total effects (c-paths as depicted in ) of electric light condition on the dependent measures (that is, coziness, liveliness, tenseness, and detachment) were modeled. The related regression coefficients are given in , and a schematic representation is shown in . For all atmosphere attributes combined, 26 out of 40 electric light condition comparisons resulted in a significant effect. This means that mediation and moderation effects can be further analyzed. In the total effect model, the R2 values averaged over all electric light condition comparisons were 0.22 for coziness, 0.24 for liveliness, 0.06 for tenseness, and 0.17 for detachment.
Table 7. Results of the mediation analyses for the total effect of the independent measure electric light condition on the dependent measures coziness (C), liveliness (L), tenseness (T), and detachment (D). Regression coefficients are given for all combinations of electric light condition. An asterisk indicates a significant effect.
Fig. 8 Schematic representation of the results of the total effect analyses (top) and mediation/moderation analyses (bottom). An arrow is drawn if for one of the electric light condition comparisons a significant effect was found. The type of arrow (as indicated in the legend) indicates the number of significant effects that were found, where darker and thicker arrows represent a higher number of significant effects.
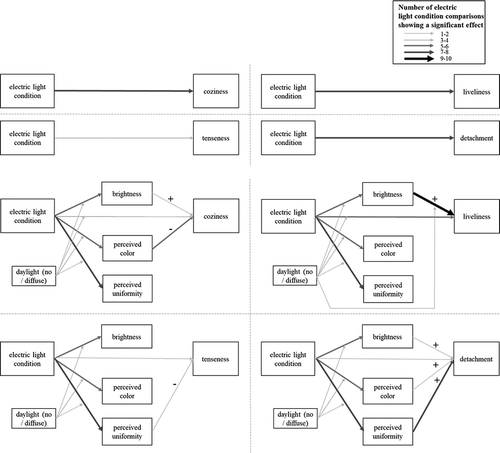
Next, the impact of mediators along three paths (as also depicted in ) was analyzed: (1) the a-paths show the effect of electric light condition on the mediators (that is, brightness, perceived color, and perceived uniformity), (2) the b-paths show the influence of the mediators on the dependent measures (that is, coziness, liveliness, tenseness, and detachment), and (3) the c′-paths describe the effect of electric light condition on the dependent measures (that is, coziness, liveliness, tenseness, and detachment). For all paths, the potential moderating effect of daylight was analyzed, represented by a w-path. The regression coefficients of the a-, b-, and c′-paths and the impact of daylight on them (w-path) are presented in –, respectively. A schematic representation of the results is also added to .
Table 8. Overview of the a-path effects of the mediation and moderation analyses: influence of the independent measure electric light condition with and without the impact of the moderator daylight on the mediators (that is, brightness (B), perceived color (Pc), and perceived uniformity (Pu)). Regression coefficients are given for all combinations of the electric light conditions (that is, 1 versus 2, et cetera). An asterisk indicates a significant effect.
Table 9. Overview of the b-path effects of the mediation and moderation analyses: influence of the mediators (that is, brightness (B), perceived color (Pc), and perceived uniformity (Pu)) with and without the impact of the moderator daylight on the dependent measures coziness, liveliness, tenseness, and detachment. Regression coefficients are given for all combinations of the electric light conditions (that is, 1 versus 2, et cetera). An asterisk indicates a significant effect.
Table 10. Overview of the c′-path effects of the mediation and moderation analyses: influence of independent measure electric light condition with and without the impact of the moderator daylight on the dependent measures coziness (C), liveliness (L), tenseness (T), and detachment (D). Regression coefficients are given for all combinations of electric light condition (that is, 1 versus 2, et cetera). An asterisk indicates a significant effect.
A large number of electric light condition comparisons showed a significant effect of electric light condition on brightness, perceived color, and perceived uniformity (a1,2,3). However, only for very few relations was a significant moderating effect of daylight on these relations found (w1,2,3). Hence, this means that the presence of diffuse daylight did not substantially influence the brightness, perceived color, and perceived uniformity of the light in the space.
The results of the mediators on the atmosphere dimensions (b1,2,3) showed that brighter light was perceived as either cozier or more detached for some of the light condition comparisons but as livelier for most light condition comparisons. Light that was perceived as cooler was perceived as less cozy for most comparisons and more detached for at least one comparison. More uniformly perceived light was perceived as less tense and more detached for some light condition comparisons. For only one of the electric light condition comparisons, a significantly moderating effect of daylight on the b-path was found—that is, for the relation between brightness and liveliness—where the presence of daylight made the light less bright and its atmosphere less lively.
Lastly, for 11 out of the 40 electric light condition comparisons, a significant direct effect (c′-path) of electric light condition on the atmosphere attributes was found. For two of these comparisons a significantly moderating effect of daylight was found; that is, one for the relation between electric light condition and coziness and one for the relation between electric light condition and liveliness.
The mediation/moderation model (including all a-, b-, w-, and c'-paths) resulted in an R2 value of on average 0.32 for coziness, liveliness, and detachment and 0.11 for tenseness. These increased R2 values combined with the lower number of significant direct regression coefficients compared to those of the total effect model show that a model including mediators and moderators explains more variance than a model in which only the effect of electric light on the atmosphere attributes is considered. Still, the relatively low R2 values imply that other mediators should be included in the model to explain more variance.
6. Discussion
This study investigated the effect of the methodology to study effects of lighting design on the perception of light and atmosphere. It evaluated three methodologies: (1) a rating scale with blocked presentation of daylight conditions, (2) a rating scale with random presentation of daylight conditions, and (3) a paired-comparison methodology.
6.1. A Comparison of methodologies
First, we expected to find larger effects of daylight for the rating-scale methodology with a random instead of a blocked presentation of the daylight conditions, because for the blocked presentation mode participants could have used a different internal response scale for all conditions. Statistical analyses showed a significant interaction effect between presentation mode and daylight for detachment. In addition, for the attributes perceived color and detachment, a larger effect size was found when the daylight conditions were presented randomly. Both effects did already show significant effects in the original blocked design but, as expected, we found larger effects for the random presentation mode compared to the blocked presentation mode. No additional effects of diffuse daylight were found on any of the other attributes, in the original or the present rating scale methodologies. Second, we expected to find larger effects of daylight with the paired-comparison methodology compared to the rating-scale methodology with a random presentation of daylight conditions. Indeed, the effect sizes of daylight and electric light were, on average, larger for the paired-comparison methodology than for the rating-scale methodology, but the outcomes of both methodologies correlated highly.
6.2. Perceptions of light and perceptions of atmosphere
Because the rating scale and paired comparison methodologies resulted only in small deviations for the effect of daylight for some attributes and we did not detect substantial differences that would vastly affect our conclusions, we further explored the effects of electric light and daylight on the light and atmosphere attributes with only one of the data sets. We selected the data from rating-scale methodology with a random presentation of the daylight conditions, because the results of rating scales are more easily interpretable than the results of paired comparisons. Mediation analyses showed that the three light perception attributes mediated the relationship between electric light and atmosphere. The mediation effect of the attributes was not significant for all electric light conditions comparisons, but the direction of the effect was always the same. Results showed that an increase in brightness could make the space more cozy, lively, or detached. Further, when the color of the light was perceived as cooler, the space could be perceived as less cozy or more detached. Last, a higher perceived uniformity of the light in the space could make the space less tense or more detached. Most of these relationships are in line with the findings of Vogels and others [Citation2008]. However, they reported several additional and a few reversed relationships that we did not find in the present study. These differences may result from the fact that Vogels and others [Citation2008] measured the relation between physical light characteristics (that is, the intensity, color temperature, and spatial distribution of the light in the space) and atmosphere directly, whereas the electric light conditions in the present study varied on several aspects at the same time and, hence, statistics were needed to unravel the relationships between light and atmosphere perception. The effects of brightness and perceived uniformity are also to a large extent in line with those reported in a recent study of Stokkermans and others [Citation2017]. In this particular study, the authors described second-order polynomial relations between the four atmosphere dimensions and these light perception attributes, whose directions to a large extent agree with the results of the present study. Differences with this study may originate from the different light conditions that were studied and different techniques that were used to analyze the data.
We should note that we found relatively low R2 values (that is, ranging from 0.11 to 0.32) in our study, indicating that additional mediators may be required to fully explain the effect of light on atmosphere. We hypothesize that these additional mediators may be related to the spatial distribution of the light in the space. One can think of light attributes related to the distribution of the luminaires in the space, the (direction of the) emitted light in the space, and the distribution of the color of the light in the space.
6.3. Contributions of daylight in atmosphere
As described in the Introduction, the literature showed various effects of daylight on a space’s impression and appraisal. We hypothesized that as daylight affects the physical light characteristics in the space, it may also affect the perceived atmosphere. The current study particularly focused on the effects of the light of daylight (without the view) while controlling the absolute overall luminance and excluding the contribution of a view to the outside. Results showed that significant effects of daylight occurred for a limited amount of light conditions. For most of the electric light condition pairs, the moderating effect of daylight was not significant, and the repeated-measures ANOVAs showed an effect size of daylight much smaller than that of the electric light condition; that is, manipulations of the electric light. The largest effect of diffuse daylight was found on perceived color and detachment, where the addition of daylight made the perceived light in the space slightly cooler and the space more detached. Adding direct daylight made the light brighter and the space less cozy and more detached. The latter two findings may at first sight seem counterintuitive but make sense because direct daylight reduces the visibility of the orange and blue accent light in the particular scene used, which was evaluated as very cozy and not so detached.
The mediation analyses showed that light in a space affected the atmosphere for a large part via the light perception attributes brightness, perceived color, and perceived uniformity. Therefore, in order to understand the effects of daylight on atmosphere, we should focus on the relationship between daylight and light perception. Brightness depends, among others, on the adaptation state of the visual system. Therefore, the change in brightness due to the daylight may be smaller than what could be expected from the objective, absolute increase in physical luminance. The brightness of the visualizations used in our experiment was based on the brightness in a real space, although in the visualizations the physical luminance averaged across the image was the same for all daylight conditions and no-daylight conditions. Therefore, effects of adaptation have indirectly been integrated into the visualizations. For one of the direct daylight conditions, a significant increase in brightness was found. It is possible that the distinct difference in light and dark in the space, caused by a sharp edge created by the direct sunlight component, may have affected the adaptation state. Currently, it is not fully known how the visual system exactly adapts to a nonuniform light distribution [Stokkermans and Heynderickx Citation2014; Stokkermans and others Citation2016]. In addition, brightness of a space depends on the spatial distribution of the light in that space. For instance, Tiller and Veitch [Citation1995] found that light with a nonuniform distribution was perceived as brighter than light with a uniform distribution. The conditions with daylight had a very similar luminance contrast compared to the conditions without daylight, which may also explain why brightness was not affected heavily by the addition of daylight. The small decrease in luminance contrast by adding diffuse daylight also hardly affected the perceived uniformity of the light in the space. It resulted in a more uniform perception of the light in the space for only one electric light condition, whereas for the other four electric light conditions there was either no effect or a reversed effect on perceived uniformity. Even adding direct daylight hardly influenced the perceived uniformity, whereas measurements in the 40° band showed that the luminance contrast for the direct daylight conditions slightly increased compared to the diffuse daylight condition. Again, we should acknowledge that the current study, through the specific visualizations employed, excluded any effects of a view at or out from a window. These elements will almost certainly also explain part of real daylight’s impact on preference for and atmosphere in certain spaces.
6.4. The use of visualizations
The present study made use of visualizations to assess the perception of light and atmosphere of a space. Several studies have shown promising results for the use of visualizations as a research tool to study a space’s impression but also suggested room for improvement in the perceptual accuracy of some attributes. Stokkermans and others [Citation2015] compared the effect of daylight in a virtual space with that in a real space and found that in the presence of daylight, the color of the light was perceived as warmer in the real space, whereas it was perceived as cooler in the visualizations. The present study also showed that daylight in the visualizations made the light cooler, which is not surprising because the same visualizations were used. Thus, the perception of the light in a virtual space does not always correspond to that in a real space. In our case, this may be attributed to the fact that the spectrum of the daylight entering the real space was influenced by reflections from buildings or trees in front of the window.
The use of visualizations did enable us to disentangle the light effects of daylight from the view that typically comes along with it. Moreover, the physical absolute luminance was held constant over the light conditions, hence also controlling for fluctuations of daylight. Our results suggest that without these important aspects of daylight, daylight plays a smaller role than electric light in atmosphere perception. Future studies should ascertain which aspect (or combination of aspects) is most important for the effects shown by the literature. Using visualizations, future studies may, in a similarly controlled manner, investigate the impact of those aspects of daylight. In addition, this study investigated effect of lights in an almost empty space, to avoid distractions due to the interior of the space. More research is required to understand how daylight and electric light affect atmosphere in a furnished space in a dedicated context.
7. Conclusion
This study investigated the effect of three different methodologies to study the effect of electric light and daylight on the perception of the light and atmosphere of a space. The methodologies employed were rating scales with a blocked and a random presentation of the daylight conditions and a paired-comparison methodology. Our results showed variations in effect size between the three types of methodologies, in line with our expectations. However, for the present study, the choice of one methodology over another did not lead to vastly different conclusions. Therefore, should one be interested to learn about the general direction of effects of certain design parameters, both rating scales and paired comparisons may be applied. In performing such studies, complete randomization should, whenever possible, be favored over blocked schemes. For most purposes, the rating-scale methodology may be preferred because it is more convenient. However, for studies investigating effects with small effect sizes, the paired-comparison methodology is advisable. Optimally, if time and effort allow, employing multiple methodologies would be best research practice; then the error originating from a particular methodological choice is known and the study’s outcomes can be viewed in that perspective.
The experiment also enabled us to explore the relative impact of electric light and daylight. This study demonstrated that increasing the light’s brightness may increase coziness, liveliness, and detachment; cooler light may decrease coziness and increase detachment; and more uniform light may decrease tenseness and increase detachment. The use of visualizations made it possible to distill the effect of the light per se from other aspects of daylight such as the overall luminance, dynamic fluctuations in light, and a view outside. Under these circumstances, the impact of daylight was smaller than the effect of electric light, irrespective of whether diffuse or direct daylight was added. This thus suggests that the view or the light intensity of daylight may be important aspects shaping a space’s impression, which are interesting topics to investigate in future research.
Acknowledgments
The authors thank Yuexu Chen for her contribution in designing and running part of the experiments and Dragan Sekulovski and Antal Haans for their help with the data analyses. This research was performed within the framework of the strategic joint research program on Intelligent Lighting between TU/e and Koninklijke Philips N.V.
Disclosure statement
No potential conflict of interest was reported by the authors.
Funding
This project was supported by Philips Lighting Research.
Additional information
Funding
References
- Arneill AB, Devlin AS. 2002. Perceived quality of care: the influence of the waiting room environment. J Environ Psychol. 22:345–360. doi:10.1006/jevp.2002.0274.
- Beute F, De Kort YAW. 2013. Salutogenic effects of the environment: review of health protective effects of nature and daylight. Appl Psychol-Hlth We. 6:67–95. doi:10.1111/aphw.12019.
- Braun KM, Fairchild MD, Alessi PJ. 1996. Viewing techniques for cross-media image comparisons. Color Res Appl. 21:6–17.
- [CIE] Commission International de l’Éclairage. 2014. Guidance towards best practice in psychophysical procedures used when measuring relative spatial brightness. Vienna (Austria): Commission International de l’Éclairage. CIE Report 212:2014. 65 p.
- Cohen J. 1988. Statistical power analysis for the behavioral sciences. Hillsdale (NY): Lawrence Erlbaum Associates.
- Countryman CC, Jang S. 2006. The effects of atmospheric elements on customer impression: the case of hotel lobbies. Int J Contemp Hosp M. 18:534–545. doi:10.1108/09596110610702968.
- Custers PJM, De Kort YAW, Ijsselsteijn WA, De Kruiff ME. 2010. Lighting in retail environments: atmosphere perception in the real world. Lighting Res Technol. 42:331–343. doi:10.1177/1477153510377836.
- Durak A, Camgöz ON, Yener C, Güvenç D, Gürçınar Y. 2007. Impact of lighting arrangements and illuminances on different impressions of a room. Build Environ. 42:3476–3482. doi:10.1016/j.buildenv.2006.10.048.
- Fairchild MD, Reniff L. 1995. Time course of chromatic adaptation for color-appearance judgements. J Opt Soc Am A. 12:824–833. doi:10.1364/JOSAA.12.000824.
- Faul F, Erdfelder, E, Lang, A-G, Buchner, A. 2007. G*Power 3: A flexible statistical power analysis program for the social, behavioral, and biomedical sciences. Behav Res Methods. 39:175-191.
- Field A. 2009. Discovering statistics using SPSS. 2nd ed. London (UK): SAGE Publications.
- Flynn JE, Spencer TJ, Martyniuk O, Hendrick O. 1973. Interim study of procedures for investigating the effect of light on impressions and behavior. J Illum Eng Soc. 3:87–94. doi:10.1080/00994480.1973.10732231.
- Fotios S, Atli D. 2012. Comparing judgments of visual clarity and spatial brightness through an analysis of studies using the category rating procedure. J Illum Eng Soc. 4:261–281.
- Fotios S, Cheal C. 2010a. Stimulus range bias explains the outcome of preferred-illuminance adjustments. Lighting Res Technol. 42:433–447. doi:10.1177/1477153509356018.
- Fotios SA, Cheal C. 2010b. A comparison of simultaneous and sequential brightness judgements. Lighting Res Technol. 42:183–197. doi:10.1177/1477153509355506.
- Fotios SA, Houser KW. 2009. Research methods to avoid bias in categorical ratings of brightness. LEUKOS. 5:167–181.
- Haans A. 2014. The natural preference in people’s appraisal of light. J Environ Psychol. 39:51–61. doi:10.1016/j.jenvp.2014.04.001.
- Hayes AF. 2013. Introduction to mediation, moderation, and conditional process analysis: a regression-based approach. New York (NY): Guilford Press. 507 p.
- Heerwagen JH, Heerwagen DR. 1986. Lighting & psychological comfort. Light Design Appl. 6:47–51.
- Houser KW, Tiller DK. 2003. Measuring the subjective response to interior lighting : paired comparisons and semantic differential scaling. Lighting Res Technol. 35:7–9. doi:10.1191/1365782803li073oa.
- Houser KW, Tiller DK, Bernecker CA, Mistrick RG. 2002. The subjective response to linear fluorescent direct/indirect lighting systems. Lighting Res Technol. 34:243–264. doi:10.1191/1365782802li039oa.
- Kuijsters A, Redi J, De Ruyter B, Seuntiëns PJH, Heynderickx IEJ. 2012. Effects of ageing on atmosphere perception. Proceedings of Experincing Light 2012 International Conference on the Effects of Light on Wellbeing, Eindhoven, 12-13 November 2012..
- Lakens D. 2013. Calculating and reporting effect sizes to facilitate cumulative science: a practical primer for t-tests and ANOVAs. Front Psychol. 4:1–12. doi:10.3389/fpsyg.2013.00863.
- Liu X, Luo M, Li H. 2014. A study of atmosphere perceptions in a living room. Lighting Res Technol. 47(5):581–594. doi:10.1177/1477153514528934.
- Loe L, Mansfield KP, Rowlands E. 1994. Appearance of lit environment and its relevance in lighting design: experimental study. Lighting Res Technol. 26:119–133. doi:10.1177/096032719402600301.
- Moscoso C, Matusiak B. 2015. From windows to daylighting systems: how daylight affects the aesthetic perception of architecture. Proceedings of the 28th CIE Session; 2015, 28 June – 4 July 2015, Manchester (UK).
- Moscoso C, Matusiak B, Svensson UP, Orleanski K. 2015. Analysis of stereoscopic images as a new method for daylighting studies. ACM T Appl Percept. 11(4):1-21.
- Murdoch MJ, Stokkermans MGM, Lambooij M. 2015. Towards perceptual accuracy in 3D visualizations of illuminated indoor environments. J Solid State Lighting. 2:1-12. doi:10.1186/s40539-015-0029-6.
- Naqshbandi MM, Munir RS. 2011. Atmospheric elements and personality: impact on hotel lobby impressions. World Applied Sciences Journal. 15:785–792.
- Osborne JW, Overbay A. 2004. The power of outliers (and why researchers should always check for them). Practical Assessment, Research, and Evaluation. 9(6):1–12.
- Poulton EC. 1977. Quantitative subjective assessments are almost always biased, sometimes completely misleading. Brit J Psychol. 68:409–425. doi:10.1111/j.2044-8295.1977.tb01607.x.
- Rajae-Joordens R, Engel J. 2005. Paired comparisons in visual perception studies using small sample sizes. Displays. 26:1–7. doi:10.1016/j.displa.2004.09.003.
- Reinhard E, Stark M, Shirley P, Ferwerda J. 2002. Photographic tone reproduction for digital images. ACM T Graphic. 21:267–276. doi:10.1145/566654.566575.
- Ridder HD. 2001. Cognitive issues in image quality measurement. J Electron Imaging. 10:47–55. doi:10.1117/1.1335529.
- Russell JA, Pratt G. 1980. A description of the affective quality attributed to environments. J Pers Soc Psychol. 38:311–322. doi:10.1037/0022-3514.38.2.311.
- Schielke T. 2015a. Influence of lighting design on marketing communication. LEUKOS. 11(3):109–124. doi:10.1080/15502724.2015.1020949.
- Schielke T. 2015b. Validity of simulations for lighting and brand image evaluation. Lighting Res Technol. 48(4):1–18.
- Stokkermans MGM, Chen Y, Murdoch MJ, Vogels IMLC, Heynderickx IEJ. 2015. Effect of daylight on atmosphere perception: comparison of a real space and visualizations. Proceedings Volume 9394, Human Vision and Electronic Imaging XX, SPIE/IS&T Electronic Imaging, 8–12 February 2015, San Francisco (CA).
- Stokkermans MGM, Heynderickx IEJ. 2014. Temporal dark adaptation to spatially complex backgrounds: effect of an additional light source. J Opt Soc Am. 31:1485–1494. doi:10.1364/JOSAA.31.001485.
- Stokkermans MGM, Vogels IMLC, De Kort YAW, Heynderickx IEJ. 2017. Relation between the perceived atmosphere of a lit environment and perceptual attributes of light. Lighting Res Technol. doi:10.1177/1477153517722384.
- Stokkermans MGM, Vogels IMLC, Heynderickx IEJ. 2016. The effect of spatial luminance distribution on dark adaptation. J Vision. 16:1–15. doi:10.1167/16.8.11.
- Thurstone L. 1927. A law of comparative judgment. Psychol Rev. 34:273–386. doi:10.1037/h0070288.
- Tiller DK, Rea MS. 1992. Semantic differential scaling: prospects in lighting research. Lighting Res Technol. 24(1):43–51.
- Tiller DK, Veitch JA. 1995. Perceived room brightness: pilot study on the effect of luminance distribution. Lighting Res Technol. 27:93–101. doi:10.1177/14771535950270020401.
- Veitch JA, Geerts J, Charles KE, Newsham GR, Marguardt CJG. 2005. Satisfaction with lighting in open-plan offices: COPE field findings. Proceedings of Lux Europa 19-21 September 2005, Berlin, p. 414–417.
- Vogels IMLC. 2008. Atmosphere metrics: a tool to quantify perceived atmosphere. The international symposium Creating an Atmosphere, 10-12 September 2008, Grenoble, France.
- Vogels IMLC, De Vries M, Erp Van TAM. 2008. Effect of coloured light on atmosphere perception. Stockholm (Sweden): International Colour Association. p. 1– 6.
- Wang H, Luo MR, Liu P, Yang Y, Zheng Z, Liu X. 2014. A study of atmosphere perception of dynamic coloured light. Lighting Res Technol. 46:661–675. doi:10.1177/1477153513506591.
- Westfall P, Kevin S, Henning S. 2013. Understanding advanced statistical methods. Boca Raton (FL): CRC Press. 569 p.