?Mathematical formulae have been encoded as MathML and are displayed in this HTML version using MathJax in order to improve their display. Uncheck the box to turn MathJax off. This feature requires Javascript. Click on a formula to zoom.
ABSTRACT
This article presents a novel experimental method that uses a virtual reality (VR) headset, aiming to provide an alternative environment for the conduction of subjective assessments of daylit spaces. This method can overcome the difficulty of controlling the variation of luminous conditions, one of the main challenges in experimental studies using daylight, and its novelty lies in the implementation of physically based renderings into an immersive virtual environment. The present work investigates the adequacy of the proposed method to evaluate five aspects of subjective perception of daylit spaces: the perceived pleasantness, interest, excitement, complexity, and satisfaction with the amount of view in the space. To this end, experiments with 29 participants were conducted to compare users’ perceptions of a real daylit environment and its equivalent representation in VR and test the effect of the display method on the participants’ perceptual evaluations, reported physical symptoms, and perceived presence in the virtual space. The results indicate a high level of perceptual accuracy, showing no significant differences between the real and virtual environments on the studied evaluations. In addition, there was a high level of perceived presence in the virtual environment and no significant effects on the participants’ physical symptoms after the use of the VR headset. Following these findings, the presented experimental method in VR seems very promising for use as a surrogate to real environments in investigating the aforementioned five dimensions of perception in daylit spaces.
1. Introduction
Daylight has an undeniable value in various aspects of architectural design, ranging from energy efficiency and user comfort to the perception of architectural space. Various studies have addressed the importance of perceptual qualities of daylight, such as the variation and composition of light for our experience of space (Parpairi et al. Citation2002; Rockcastle et al. Citation2016; Rockcastle and Andersen Citation2014), while emphasizing the need for a human-centric approach focusing on the occupant’s point of view (Amundadottir et al. Citation2017). Although daylighting research has produced established metrics regarding human comfort and the energy performance of daylight, we are left with an inadequate understanding of the effect of luminous conditions on the user perception and experience.
A significant barrier in the acceleration of knowledge in this field is the difficulty in controlling the variation of luminous conditions in experimental studies. Although daylight is identified as one of the driving factors in architectural design (Holl et al. Citation2011; Zumthor Citation2006), there are currently no methods that allow us to visualize and evaluate the dynamics and complexity of daylight in space, truly reproducing a user’s experience, except when this space is finished and built. However, using real environments to investigate human perception is complex in parameters and resources, and daylighting research faces the particular problem of conditions that change over time, such as weather and sky (Bülow-Hübe Citation1995; Newsham et al. Citation2010).
As a result, there has been a growing trend toward the use of virtual representations in research. Various studies have suggested that both photographs (Cauwerts Citation2013; Hendrick et al. Citation1977; Newsham et al. Citation2010) and renderings (Cauwerts Citation2013; Mahdavi and Eissa Citation2002; Newsham et al. Citation2005) are a promising medium for investigating subjective impressions of space and light. Current rendering simulation tools can produce physically based renderings, which provide accurate photometric data and allow the relation between these photometric measurements and subjective assessments, a necessary process to uncover the existence of links between stimulus and response.
The challenge lies, of course, in obtaining research findings that are valid, reproducible, and generalizable from virtual to real environments. A key factor in this is the creation of virtual environments that are perceptually realistic and provide an experience that is “indistinguishable from normal reality” (Loomis et al. Citation1999, p. 557). The user interaction and immersion have been identified as crucial parameters in creating virtual environments that can adequately substitute the human experience in the real space (Bishop and Rohrmann Citation2003; Cauwerts Citation2013; De Kort et al. Citation2003; Newsham et al. Citation2010). Although there are a few studies investigating the experience of a rendered immersive and interactive virtual environment (Franz et al. Citation2005; Heydarian, Carneiro, et al. Citation2015), none compare the evaluations of the virtual space with those of a corresponding real space, rendering the applicability of the experimental procedure and results questionable.
This article introduces an experimental method using a novel projection technology, a virtual reality (VR) headset, for conducting experiments investigating the perceptual effects of daylight. The proposed method produces an immersive virtual environment from physically based renderings, combining a wide field of view, interactive viewing mode, and stereoscopy for the main view direction. These advantages are specifically relevant for the identification of robustness and consistency in experimental results, because the mobility offered by VR Headsets allows the reproducibility and seamless conduction of experiments with identical stimuli. This technology has the potential to overcome important barriers in conducting experiments in real environments by allowing the control of luminous conditions and rapid alternation of visual stimuli, while offering a high degree of immersion, a factor that has been identified as crucial in reproducing the experience of a real space.
2. State of the art
In this section, we review relevant issues for the identification of a perceptually accurate immersive virtual environment, including the perceived presence in the virtual scene and the physical discomfort from the use of the virtual reality device.
2.1. Factors impacting the perceptual accuracy of virtual environments
Although simulated two-dimensional virtual scenes have been repeatedly identified as an adequate medium for investigating subjective impressions of space and light (Cauwerts Citation2013; Mahdavi and Eissa Citation2002; Newsham et al. Citation2005), the immersion of the user in the virtual environment has been a recurring subject in various studies comparing virtual and real environments. This attribute regards not only the field of view provided by the device, an important factor when comparing real and virtual environments (Newsham et al. Citation2010), but also the user interaction with the presented scene. It is suggested that such an interaction would greatly improve the realism and thus the potential for user experience studies (Bishop and Rohrmann Citation2003; De Kort et al. Citation2003). Studies investigating the influence of different components in the visualization workflow, such as display type, field of view, and user interaction, have identified an interactive panoramic view mode as the most perceptually accurate (Cauwerts Citation2013; Murdoch et al. Citation2015), highlighting the importance of immersion and interactivity in the virtual scene.
Stereoscopy is another issue commonly raised when discussing the perceptual accuracy of virtual environments. Although binocular disparity in stereoscopic projections is primarily recognized due to its contribution in providing depth information (Loomis et al. Citation1996), recent studies have highlighted its importance for multiple evaluation concepts in addition to depth perception (Lambooij et al. Citation2011). In the subject of subjective evaluations of daylit scenes, though stereoscopic projections have been found to be an adequate representation method of real environments (Charton Citation2002; Moscoso, Matusiak, Svensson, and Orleanski Citation2015), studies that compare the subjective assessment of scenes in monoscopic (2D) and stereoscopic (3D) projections suggest that there is little difference in how they are perceived. Although the 3D projection was deemed as more realistic than the equivalent 2D projection (Cauwerts and Bodart Citation2011), stereoscopy did not have a significant effect when directly comparing the subjective evaluations of appraisal, emotion, and perceived presence in the two projection modes (Baños et al. Citation2008; Cauwerts and Bodart Citation2011).
To the authors’ knowledge, no previous testing has been conducted on the use of a VR headset regarding the perceptual effects of daylight. A recent study using this headset for the investigation of task performance in office environments (reading speed, comprehension, object identification) and comparing the performance indicators to benchmarks measured in a similar physical environment concluded that there were no significant differences in performance between the virtual and real space (Heydarian, Pantazis, et al. Citation2015). A VR headset is used in studies investigating the effects of daylight composition on the subjective perception of the virtual space, showing that the technology allows the differentiation between daylight pattern distributions (Chamilothori et al. Citation2016; Rockcastle et al. Citation2017). Another relevant study allows the users of a VR headset to adjust the blinds and artificial light in a virtual office space, aiming to investigate the participant’s lighting preferences for office-related tasks (Heydarian, Pantazis, et al. Citation2015). The participants were invited to adjust the light condition in the room to their preference and their preferred settings were later compared with light maps that represented the chosen lighting setup of the user. Although this study is an important step in exploring the potential of immersive virtual environments, it presents two significant limitations: the rendering of the virtual space was not physically based and the researchers had no control over the specific properties of the virtual space projection. The final projected scenes were rendered through a game engine with a photo-realistic real-time renderer. As a result, there is no indication of the actual light measurement values of the scenes that the participants were shown and acted upon. The participants’ preferences and behaviors in the virtual environment were identified in light maps produced separately with physically based calculations, corresponding to high dynamic range values of real-world luminous conditions and not to those of the scene that was projected with the limited luminance range of the headset.
2.2. Perceived presence in the virtual space
Along with the simulation accuracy of the virtual scene, the subject of presence is an emergent factor in creating a virtual environment that can adequately replicate our experience of a real space (De Kort et al. Citation2003; Diemer et al. Citation2015). “Presence” is defined as the sense of “being there” in the virtual environment (Slater and Wilbur Citation1997). Schubert et al. (Citation2001) identified three dimensions of self-reported presence through factor analysis: spatial presence, involvement, and realness. These factors correspond to the user’s sense of being in the virtual space, his or her lack of awareness of the real world, and the perceived realism of the virtual scene in comparison with the real environment.
The subject of adverse physiological reactions has been identified as a possible factor of the perceived presence in virtual environments (Lessiter et al. Citation2001; Schubert et al. Citation2001). A study by van der Spek and Houtkamp (Citation2008), inducing simulator sickness in a static virtual environment, found that the evaluation of the environmental dimensions of arousal and pleasantness was affected by the participants’ physical discomfort. This finding is particularly relevant for the use of virtual reality as an empirical research tool, emphasizing the need for a multicriteria analysis for the adequacy of virtual reality as a substitute for real environments.
2.3. Problem statement
In the pursuit of creating simulated environments that can be used as a substitute for real ones in empirical research, studies have highlighted several factors of importance. When investigating the effects of lighting on perceptual impressions, such as the perceived pleasantness or interest of an evaluated scene, the virtual environment needs to correspond to accurate photometric data. In addition, the user’s interactivity and immersion in the simulated space have been identified as essential in adequately reproducing the human experience in the real space. Although considerable research has been devoted to comparing and validating methods that aim to couple these features, existing methods are lacking in the depth of user immersion within the virtual environment.
This article introduces a novel method for the creation of fully immersive scenes from photometrically accurate renderings, aiming to encourage the use of VR technologies in lighting research as an empirical tool. Following the approach of Bishop and Rohrmann (Citation2003), who urged researchers to conduct validity assessments when introducing a new medium of simulation or projection, we present the results of an experimental study investigating the adequacy of the proposed method in three different dimensions: the perceptual accuracy of the method, the physiological effects of using the device, and the reported presence of the subjects in the virtual environment. To this end, we will investigate the difference between subjective evaluations in a real daylit environment and in its virtual representation, compare the reported physical symptoms of the participants before and after the use of the VR headset, and assess the participants’ perceived presence in the virtual scene through verbal questionnaires.
3. Method
The method followed in this study consists of three main steps: the selection of visual stimuli in the real and virtual environments, the experimental design, and the approach regarding the statistical analysis of the experimental results, as illustrated in .
Fig. 1. Illustration of the methodological approach used in the study.
We will present the method in five subsections, corresponding to the software and equipment used (subsection 3.1), the workflow regarding the experimental stimuli in the real (subsection 3.2) and virtual (subsection 3.3) environments, the experimental design (subsection 3.4), and lastly the methodology behind the statistical analysis of the results (subsection 3.5).
3.1. Equipment
The VR headset used in this study is the Oculus Rift Development Kit 2 (DK2) (Oculus VR, Irvine, CA, USA), which uses a 1920 × 1080 pixel low persistence organic light emitting diode display with a refresh rate up to 75 Hz, resulting in a resolution of 960 × 1080 pixels per eye. The display offers a 100° horizontal and 110° vertical field of view. Although the maximum luminance of the display is up to 300 cd/m2, in this experiment the maximum luminance measured on the display was 80 cd/m2 and 40 cd/m2 on the lens due to software limitations. In the development and execution of this study, the software used was Oculus Runtime 0.7.0.0, in combination with Unity Game Engine 4.9.6 and the corresponding Unity Package OculusUtilities (from https://unity3d.com/ and https://www.oculus.com/)respectively.
3.2. Visual stimuli: Real environment
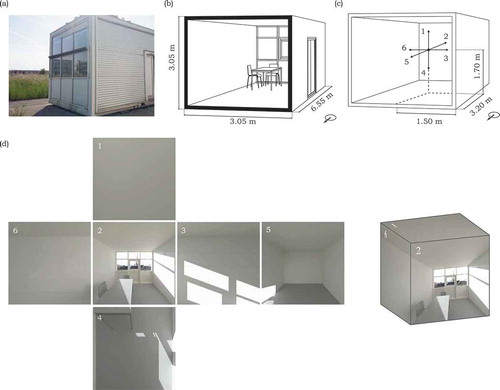
In order to test the perceptual accuracy of the proposed method, the authors aimed to compare the subjective evaluations of a real space and its representation in virtual reality. Aiming to keep in line with the characteristics of experimental spaces in relevant studies, the criteria that were established for the selection of the test room were a small to medium size (Moscoso, Matusiak, Svensson, and Orleanski Citation2015), implied office use (Heydarian, Pantazis, et al. Citation2015; Murdoch et al. Citation2015), and daylight access from the south façade to allow for experimental conditions with direct sunlight. The DEMONA (Module de demonstration en éclairage naturel) daylighting test module on the Ecole Polytechnique Fédérale de Lausanne (EPFL) campus, shown in , was selected because it fulfilled these criteria and was accessible by the participants (LESO-PB, Lausanne, Switzerland). The test room resembled an office with a desk and two chairs, basically achromatic surfaces—gray carpet and white walls and ceiling—and windows on the north and south façades. The north façade was covered, allowing daylight to enter only from the south ().
Fig. 2. (a) Photograph of the test room, (b) illustration of the interior in the 3D model, (c) placement of the viewpoint and six view directions, and (d) example of resulting renderings of the 360° virtual space divided in six sections of 90° vertical and 90° horizontal fields of view.
3.3. Visual stimuli: Virtual environment
3.3.1. Generation of physically-based renderings
Using an existing 3D model, developed by Thanachaeronkit and Scartezzini (Citation2010) as a starting point, the test room was modeled in Rhinoceros (https://www.rhino3d.com/) and then exported through the DIVA-for-Rhino toolbar (http://diva4rhino.com/) to Radiance (http://www.radiance-online.org/), an extensively validated physically based lighting simulation tool (Ward Larson Citation1994). The scene preparation and simulation protocol followed well-established workflows for producing highly accurate visualizations with Radiance, specifying the material properties from spectrophotometer measurements (Larson and Shakespeare Citation1998); generating sky descriptions based on radiation measures with gendaylit (Cauwerts Citation2013; Larson and Shakespeare Citation1998), described in Appendix A.1; and using highly accurate rendering parameters (Reinhart Citation2005), shown in . The color and specularity of the surfaces and furniture in the experimental room were measured with a Konica Minolta CM-600d Spectrophotometer and translated to Radiance material properties, shown in (Konika Minolta, Tokyo, Japan). A series of perspective view high dynamic range (HDR) renderings were generated using rpict in Radiance, the viewpoint shown in , dividing the 360° field of view into six sections with 90° horizontal and vertical fields of view.
Table 1. Radiance rpict parameters for the perspective view renderings (−vtv)a
Table 2. Radiance material properties for the main surfaces
By keeping the viewpoint fixed and varying the view direction, the produced set of renderings forms an expanded cube, illustrated in . The exposure of the HDR renderings was adjusted intuitively to match the appearance of the real space by using pfilt to apply a uniform exposure multiplier. The images were then converted to low dynamic range BMP files using ra_bmp with a gamma correction factor of 2.2 and ensuring the application of identical settings for all six view directions.
To create the perception of depth with two-dimensional images, we can generate a stereoscopic scene by projecting a different picture to each eye (, right) simultaneously. If the viewpoints of these images have a disparity in the horizontal axis in a measure equal to the interpupillary distance (d) of the subject’s eyes (, left), the resulting image is perceived as three-dimensional.
Fig. 3. (Left) Principle of stereopsis used for the main view direction in the virtual reality headset and (right) an example of projected stereoscopic image.
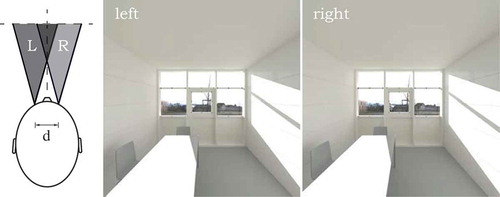
Following this principle, the simulation procedure described above was repeated for two viewpoints in the digital model with a horizontal distance of 65 mm between them, suggested as the average interpupillary distance in the Oculus documentation (Oculus VR Citation2015). Because participants in the experiment would mostly be looking in front of them, shown as view direction 2 in , the selected viewpoints correspond to the eyes of a participant looking in this view direction. Although the stereoscopic effect is correct for the view directions of front and back, it is not the case for the other view directions, where the two viewpoints will not correspond to the eyes of a subject turning his or her head in the virtual space. This was a result of software limitations at the time of the study, although future work in Radiance aims to implement omnidirectional stereoscopic projection types (McNeil Citation2016). When experiencing the virtual scene, the discrepancy was imperceptible because the nonstereoscopic view directions did not contain objects, leading to a minimal effect on the user’s perception of depth.
In consideration of how prevalent an order bias is in relevant studies, where the subjects are first exposed to the real environment and these conditions are used to generate the virtual environment (Cauwerts and Bodart Citation2011; Murdoch et al. Citation2015), we decided to compromise virtual scene accuracy in favor of eliminating this bias and create the simulated scenes before the experiment. The experiment took place in November during the course of 8 days, which were represented with a selection of virtual scenes corresponding to different times of day, sky type, and view out. Due to time constraints, variations in the scene were realized for one date only in November, although minor changes in sun angle were perceived in this period.
Aiming to address the daylight variation, seven scenes were rendered for clear sky type corresponding to every hour from 9:30 am to 3:30 pm, shown in , and two scenes for overcast sky type, using 12:30 pm as the time of day, shown in . The two scenes of overcast sky differed only in their view out of the window, through the mapping of two different panoramas on the Radiance sky to account for the prevalent views in overcast conditions during the weeks before the experiment.
Fig. 4. Front view direction for the right eye used in each of the nine scenes. The scenes from (a) to (g) were rendered in hourly time steps from 09:30 am to 3:30 pm for clear sky type, and scenes (h) and (i) were rendered for 12:30 pm and overcast sky type using two different panoramas mapped on the Radiance sky.
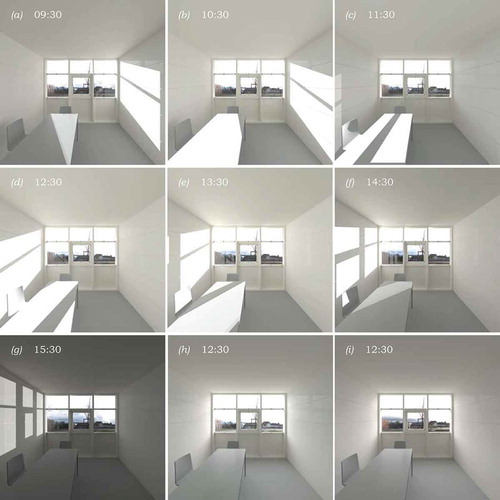
For each scene, we rendered two sets of six images: each image corresponded to a perspective view of 90° horizontal and 90° vertical fields of view from the same viewpoint, shown in , and each set of images corresponded to the viewpoint of one eye of a person looking toward the main frontal view direction of the scene, as shown in .
3.3.2. Generation of 360° immersive scenes
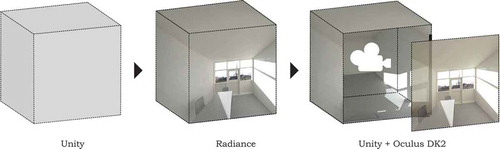
The renderings developed with Radiance were then imported in the game engine Unity. Drawing from the field of game design where a textured cubemap has been widely used to produce an immersive environment mapping (Greene Citation1986), we re-created this projection type in Unity. In a cubemap, or cube projection, the environment is projected onto a cube as seen from a particular viewpoint (illustrated in ). A significant advantage of this projection mapping, as noted by Greene (Citation1986), is that it can be produced with any rendering program that can generate perspective view visualizations. illustrates the process of creating a cubemap projection in Unity, applying the renderings from Radiance to the corresponding faces of a cube as textures (Appendix A.2). Two cubes were created to simulate the principle of stereoscopy, each using as textures the renderings generated from the viewpoint of the equivalent eye, visible only to the corresponding half of the screen of the VR headset.
Fig. 5. Illustration of workflow for the generation of immersive 360° scenes.
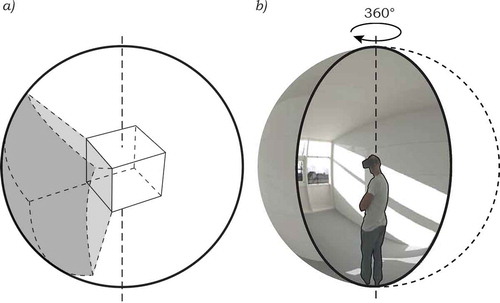
A virtual camera was placed in the center of each cube (, right) using the OVRCameraRig script in Unity, which allowed the control of the camera through the head-tracking feature of the Oculus Rift headset. By placing the camera in the middle of this textured cube, the user’s viewpoint corresponds to the one used to generate each set of renderings. Through this process, we can produce scenes for Oculus Rift where the user is able to look around and explore the space from a selected viewpoint. The scene is perceived as fully immersive and three-dimensional, as illustrated in .
Fig. 6. (a) Diagram of the word-to-cubemap projection for one cube face and (b) illustration of the freedom of movement in the projected virtual reality scene.
3.4. Experimental design
In this study, we chose a within-subjects design where subjects were shown both the real and virtual environments, counterbalancing the stimuli presentation order. The use of repeated measures has the advantage of eliminating the effect of variance between individual participants, because each subject acts as his or her own control. By randomizing the presentation order of the two environments within participants, the first environment they are exposed to functions as their individual reference. The experimental data were collected through questionnaire items, shown in , and grouped in three sections relating to the investigation of the perceptual accuracy of the method (Perceptual Impressions), the effect of using the VR headset on the user’s physiological reactions (Physical Symptoms), and the user’s perceived presence in the virtual space (Reported Presence).
Table 3. Overview: Variables and questionnaire items.
The studied perceptual impressions relate to the component of emotional response rather than the light appearance in the perception of the luminous conditions (Van Erp Citation2008), placing the focus of the study in investigating further than the evident features of the luminous environment and exploring the impact of lighting condition on high order perceptions, such as complexity and interest (Boyce Citation2003). Drawing from the pioneering work of Flynn et al. (1973), Vogels (Citation2008) identified two factors that can represent the atmosphere of a space, which is suggested as a more objective variable to measure the perception of luminous conditions: cosiness and liveliness, which correspond to the dimensions of pleasantness (affect) and interest (arousal) (Russell Citation1980) found in emotion theory (Vogels Citation2008). The questionnaire items for perceptual impressions were based on the work of Vogels (Citation2008) and Rockcastle et al. (Citation2016), adapted to unipolar scales and focusing on the dimensions of pleasantness, visual interest, and complexity, with the addition of a question regarding the amount of view in the space, which has been shown to affect the perceived pleasantness of the space (Moscoso, Matusiak, and Svensson Citation2015).
The questions for physical symptoms were based on a study investigating visual comfort with stereoscopic displays (Shibata et al. Citation2011). Lastly, the three items for reported presence correspond to the dimensions of presence as identified by Schubert et al. (Citation2001): realness, spatial presence, and involvement (, RP.1, RP.2, and RP.3).
A 5-point scale with verbal anchors at the end points (1 corresponding to not at all and 5 corresponding to very much) was used for all questions except for PS.5, “Do you have any other symptoms?” which had an open response. Both the order of the questions within each section and the polarity of the scale for each question were randomized. The 5-point range of the scale was selected as one of the most highly rated in terms of its ease of use and reliability (Preston and Colman Citation2000) and was chosen over the most commonly used 7-point range after a pilot study from the authors that showed that participants had difficulty answering a verbal questionnaire with 7-point scales because they had no visual reference of the scale range in virtual reality. The responses on the 5-point scale were assigned as ordinal in MATLAB (Mathworks, Inc., Natick, MA, USA) and were translated to interval—the corresponding numbers from 1 to 5—for the statistical analysis.
Because the experimental data would be ordinal with paired responses, we chose the Wilcoxon signed rank matched pairs test (Siegel Citation1956) to perform the power analysis for our study. With a final sample size of 29 subjects (28 for some attributes due to a technical problem), we conducted an a priori power analysis with the software G*Power (Faul et al. Citation2007) to estimate the power and effect size that can be obtained with this number of observations. Aiming for the conventional threshold of a statistical power equal to 0.80, our sample size was sufficient to detect medium to large effects as defined by the thresholds set by Cohen (Citation1988), with an effect size dz of 0.57 and 0.56 for 28 and 29 observations, respectively.
The counterbalancing of conditions between participants and the conducted power analysis ensure an adequate experimental design and population size for the purpose of this study. Our main focus in this study is the effect of the environment: whether there is a difference in the responses between the real and virtual spaces and whether there is a difference in the reported physical symptoms after the use of the VR headset. However, we will also test the effect of the presentation order of the environment to investigate potential bias in the experimental results.
3.5. Statistical analysis
Most studies using ordinal subjective assessments to investigate the agreement between a real environment and its virtual representation use tests of analysis of variance (Bishop and Rohrmann Citation2003; Mahdavi and Eissa Citation2002; Newsham et al. Citation2010). Such tests provide evidence of whether the null hypothesis of no difference between groups can be rejected (Siegel Citation1956) but cannot prove that the null hypothesis is true, a problem that has been highlighted in the literature (Murdoch et al. Citation2015; Salters et al. Citation2012).
A one-sample Kolmogorov-Smirnov test revealed the nonnormality of our data for all of the studied variables, leading us to apply nonparametric statistical tests. Knowing the above-mentioned limitations of hypothesis testing and following the approach suggested by Murdoch et al. (Citation2015), we employed two indicators for the analysis of the data with paired responses: the result of a Wilcoxon matched pairs signed ranks test at the significance level α of 0.05 and Cohen’s d effect size. In order to establish a threshold for an accepted mean difference between the evaluations of the two environments, we are using Cohen’s d to assess the relative magnitude of the observed differences. For two paired samples and
, Cohen’s effect size dz is based on their paired differences,
and is calculated by dividing the mean difference of two conditions by the standard deviation of the distribution of the differences, as shown in (1):
An absolute d of 0.2 has been suggested by Cohen (Citation1992) as a small effect size. Using this cutoff point, which is commonly found in the literature, we can establish a threshold of maximum accepted absolute effect size |dmax| equal to 0.2, corresponding to a small effect size. Although Cohen’s threshold has been criticized as too low, and thus too generous as a contrast measure (Ferguson Citation2009; Lipsey and Hurley Citation2009), for our purpose the lowest threshold is the most conservative. We can thus define the combination of a Wilcoxon matched pairs signed ranks result of no statistical difference at a significance level α of 0.05 and a |dz| effect size equal or lower than 0.2 as a result of accepted similarity between the paired responses for an attribute.
4. Experimental protocol
The experimental study was conducted with 29 participants, 13 women and 16 men. Because one participant did not respond to all of the questions due to a technical problem, the sample size is reported separately for each studied attribute in the following sections. Of the 29 participants, three were aged between 21 and 25 years old, 15 were aged between 26 and 30, 10 were aged between 31 and 35, and two were aged over 35 years old. The duration of the experiment was 30 min per participant, conducted in scheduled appointments from 9:00 am to 3:30 pm. At the start of each session, subjects were asked to read a document containing information about the experiment and sign a form of consent in order to proceed. After this step, they were asked to respond to a series of demographic questions concerning their age, gender, and vision correction, followed by questions in random order regarding their physical symptoms before the experimental session (, Physical Symptoms).
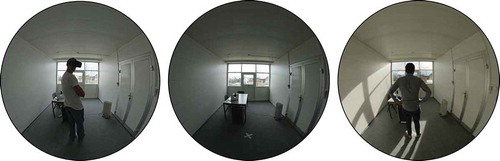
The participants were randomly assigned to evaluate the real or the virtual space first, counterbalancing the order of stimuli between subjects. In the second case, they entered the room with their eyes closed, ensuring that they saw only the virtual environment first. In both cases, the participants were guided to stand on a mark in the center of the room (, middle) and were told that they could explore the space by rotating on this spot. After having explored the environment, they were asked a series of questions in randomized order regarding their perception (, Perceptual Impressions).
Fig. 7. Photographs showing subjects exploring the (left) virtual and (right) real spaces and the (middle) experimental space with the mark for the participant’s position, corresponding to the viewpoint in the virtual space.
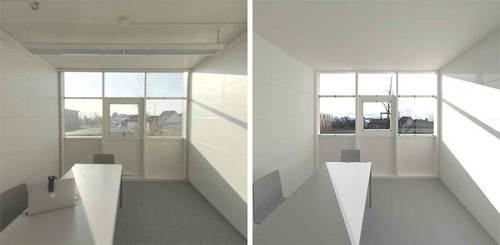
This procedure was repeated for the evaluation of both environments, the latter after confirming with the participants that the headset was adjusted correctly. After the subjects had experienced both environments and responded to the equivalent questions, they were asked to remove the headset (if applicable) and respond to a questionnaire regarding their perceived presence (, Reported Presence). Lastly, they were asked once again to evaluate their physical symptoms with the same questionnaire that was used in the beginning of the experiment. In each session, an HDR photograph of the real space that was evaluated for the particular session was captured with a camera placed at the back of the room (, middle). The scene shown in virtual reality in each experimental session was selected from the prerendered scenes based on its similarity with the daylight conditions in the real space. An example of the two environments is given in .
Fig. 8. Photograph of the (left) real space taken from the participant’s viewpoint and the (right) corresponding virtual environment.
5. Results
The results of the experimental study are presented in four sections, introducing the perceptual accuracy of the VR method (subsection 5.1), the effect of using the VR headset on the users’ physical symptoms (subsection 5.2), the perceived presence of subjects in the virtual space (subsection 5.3) and the effect of the presentation order of the environment on subjective evaluations (subsection 5.4).
5.1. Perceptual accuracy
For each of the studied attributes in perception, each participant evaluated the space shown in both the real and virtual environments. We can thus evaluate the perceptual accuracy of the VR method by calculating the difference between this pair of responses for each participant; a difference of zero would mean that the paired evaluations are identical.
shows the frequency distribution of the absolute differences between the paired responses in the two environments within our sample size. The pairs with a difference of zero were equal to 50% or more of our sample for all questionnaire items, except for perceived excitement, and at least 82% of the responses for all questions had an absolute difference lower or equal to one between the pairs of evaluations in the real and virtual environment. These measures are particularly relevant for this study, because an absolute difference of one is the smallest possible non-zero difference when comparing responses in our verbal scale.
Table 4. Frequency distribution of absolute differences between the subjective evaluations in the real and virtual environmentsa
To better illustrate the agreement between responses, shows a series of scatter plots with the paired responses of the participants in the real (x axis) and virtual (y axis) environments. In this graph, one can observe not only the agreement between the responses of the same participant—those that are closer to the diagonal line—but also the agreement of responses between participants in the different experimental conditions. Responses to questions of a more subjective nature (pleasant, interesting, and exciting) have a higher variation both within and between subjects.
Fig. 9. Distribution of individual responses in the real (x axis) and virtual (y axis) environments for each of the studied attributes from each participant. The size and label of the circles correspond to the percentage of paired responses with identical values for the two evaluations, rounded to the nearest integer. The dashed and dotted diagonal lines mark the paired responses with a difference of zero and ±1 between them, respectively.
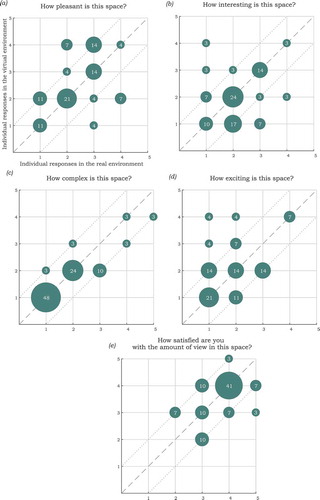
In contrast, the responses regarding the complexity and satisfaction with the amount of view show high agreement both between the responses in the real and virtual spaces and also between participants, with a clustering of responses in the negative and positive ranges, respectively. These observations show that a difference in the visual conditions—either between the two environments in one session or between the experimental sessions—produced a stronger variation in impressions of pleasantness and visual interest.
The statistical analysis of the responses with the Wilcoxon matched pairs signed rank test at a significance level α of 0.05, shown in , indicates no significant differences between the responses in the real and virtual environments for any of the studied variables. As discussed in section 3.5, this test only uses the paired responses with a non-zero difference between them, marked as Ndiff in , from a sample pool of N responses per question. This emphasizes the agreement between the responses in the two environments, because the result of nonstatistically significant differences was observed in a sample much smaller than the original one; the remaining sample of paired responses showed no difference between the evaluations in the two environments.
Table 5. Results of the Wilcoxon signed ranks matched pairs test for the effect of environment
Although our data are ordinal, we accept the treatment of differences between the responses in the two presentation modes as interval. The inherent limitations of ordinal scales, such as the uncertainty of equidistance between the scale items due to subjectivity, are not present when considering the differences in the matched pairs where the participants act as controls for their own responses. Assuming that each participant uses the same subjective distance in his or her evaluation of presentation modes, we can use the mean difference of the responses to gain insight into the similarity between the perception of virtual and real-world stimuli. Following the approach described in section 3.5, we use two indexes to assess the perceptual accuracy of the studied method: the result of the Wilcoxon signed ranks matched pairs test at a significance level α of 0.05 and Cohen’s |dz| effect size. Because there were no observed statistically significant differences for any of the studied attributes, a result of accepted perceptual accuracy corresponds to a |dz| effect size equal to or lower than our set threshold of 0.2, equivalent to a small effect size, and is symbolized with ✓ in .
Table 6. Overview of studied attributes and their perceptual accuracy based on the indexes of the Wilcoxon signed ranks matched pairs test and effect size dza
From , we can see that three out of five attributes match our conditions for accepted perceptual accuracy. The attributes of perceived complexity and excitement fail to reach the threshold of a |dz| < 0.20 by a very small difference and can be considered marginally acceptable. We also briefly report the effect size Hedge’s g, which is suggested as an unbiased form of Cohen’s d and more suitable for small samples (Hedges and Olkin Citation1985). The adjusted Hedge’s g effect size is below the threshold of 0.20 for all of the studied attributes, with the exception of perceived excitement. This difference with the results of using dz is to be expected, because Hedge’s g aims to correct for Cohen’s d overestimation in small samples: for our analysis where an effect size below 0.2 is deemed acceptable, Cohen’s d is a more conservative measure.
In order to provide standardized measures for comparison with the literature, contains both the mean difference and the mean absolute difference
between the responses in the real and virtual environments for each studied attribute. It is worth noting that most of the mean differences µz observed in our experiment are smaller than the maximum accepted mean differences in other relevant studies: 0.167 (Murdoch et al. Citation2015), 0.667 (Moscoso, Matusiak, Svensson, and Orleanski Citation2015), and 0.889 (Manyoky Citation2015), comparing values that are normalized based on a maximum possible difference of four units, corresponding to the 5-point scale used in our study. A discussion of possible inherent differences in such repeated measures due to the nature of the assessment can be found in in the Appendix A.3.
Another topic of interest is whether the agreement in the responses between the two environments could be a result of the repeated measures experimental design, because each participant was exposed to both environments. By comparing the evaluations of subjects who saw a similar condition (in this case, scenes with overcast sky) and using only the responses for the first environment they were exposed to, we can create a between-subjects data set. A Wilcoxon ranked sum test between 11 subjects who saw the real environment first and 13 who saw the virtual environment first, both groups in overcast sky conditions, indicated no significant differences between the two environments for a significance level α of 0.05 for any of the studied attributes, in accordance with our findings from the paired responses analysis.
In summary, the results indicate a high level of perceptual accuracy of the virtual reality method. A Wilcoxon signed ranks matched pairs test showed no statistically significant differences between the responses in the real and virtual environments for any of the studied attributes. In addition, the application of a second index for perceptual accuracy based on Cohen’s d showed marginally acceptable results regarding how complex and how exciting the space was perceived and acceptable results for all other attributes, demonstrating that the perceptual evaluations in the virtual environment closely match those in the real environment.
5.2. Physical symptoms
Because the experimental data regarding the self-reported physical symptoms of the participants follows the same structure as perceptual impressions, consisting of paired ordinal responses before and after the experimental sessions, we will conduct the same analysis to investigate the possible adverse physiological effects from using the VR headset. The distribution of absolute differences within our sample size is shown in , binning the paired responses before and after the experimental session based on the absolute difference between the two evaluations.
Table 7. Frequency distribution of absolute differences between the reported physical symptoms before and after the use of the virtual reality headseta
With the exception of the question, “How fresh does your head feel?” more than 50% of the sample had identical responses before and after using the VR headset, whereas for all studied questions, more than 85% of the pairs had an absolute difference lower or equal to one. The distribution of subjects’ responses is illustrated in in a series of scatter plots where each data point corresponds to a pair of responses from the same participant; the x and y axes indicate the responses before and after the experimental session, respectively.
Fig. 10. Distribution of responses before (x axis) and after (y axis) the experimental session for each participant. The size and label of the circles correspond to the percentage of paired responses with identical values, rounded to the nearest integer. The dashed diagonal line marks the paired responses with a difference of zero and the dotted lines mark the responses with a difference of ±1 in the evaluation before and after the use of the headset.
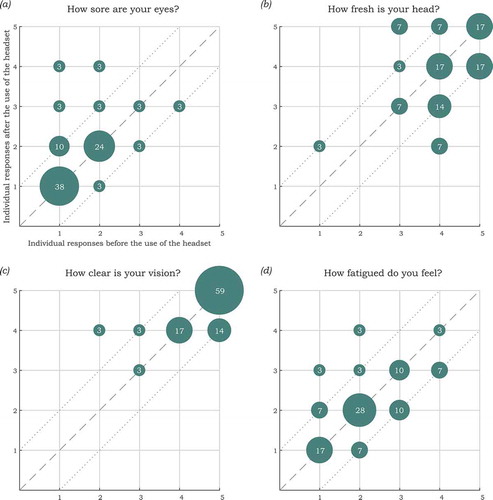
We can observe a clustering of points in the top right quadrant of positive evaluations for both responses in graphs (b) and (c), indicating high agreement between the subjects. For all questions, there are few deviations from the diagonal lines marking a difference of zero and ±1 between the paired responses, showing agreement within subjects in their responses before and after using the headset.
Similarly, the results of a Wilcoxon matched pairs signed ranks test, shown in , show no statistically significant differences for a significance level α of 0.05 between the responses before and after the experimental session for the studied attributes. Ndiff indicates the number of matched pairs with a non-zero difference used in the test from the initial data set of N pairs. Following the conservative approach described in section 3.5, we use two thresholds, an absolute effect size |dz| equal or lower than 0.20 and the result of nonstatistically significant differences shown in , to evaluate whether the use of the VR headset had an adverse effect on the subjects’ self-reported physical symptoms.
Table 8. Results of the Wilcoxon matched pairs signed ranks test on the effect of using the VR headset on participants’ physical symptoms
Table 9. Overview of the effect of using the VR headset on participants’ self-assessments of their physical symptoms for all questionnaire itemsa
From the four questionnaire items, only the question, “How sore do your eyes feel?” fails to meet these requirements. The results are identical when using Hedge’s g—suggested as an unbiased form of Cohen’s d (Hedges and Olkin Citation1985)—instead of dz, as a complementary effect size measure. Lastly, the participants responded to the open question, “Do you have any other symptoms?” (, PS.5) at the end of the experimental session. Of 29 participants, four reported feeling slightly dizzy, whereas 25 reported no other symptoms, corresponding to 14% and 86% of our sample size. The responses to an open question at the end of the experimental session regarding any additional physical symptoms indicated slight dizziness as another minor effect, with four out of 29 participants reporting this as a symptom.
To summarize, the results regarding the participants’ reported physical symptoms demonstrate no effect of using the VR headset, with the exception of the question, “How sore do your eyes feel?” A Wilcoxon signed ranks matched pairs test showed no statistically significant differences between the reported symptoms before and after using the headset for any of the questionnaire items. However, when using Cohen’s d as a second index, the question, “How sore do your eyes feel?” failed to meet our set threshold. Virtual reality–induced symptoms, often referred to as cybersickness, have been identified as a recurrent issue in virtual reality (Sharples et al. Citation2008). Although a combination of subjective evaluations and physiological measurements is suggested as a more reliable assessment method (Kim et al. Citation2005), the present experimental study relied on questionnaires to evaluate the perceptible symptoms that were experienced by the participants. Virtual reality applications that have low conflict between visual and proprioceptive senses, which is the case of our immersive virtual environment, are not expected to generate cybersickness (McCauley and Sharkey 1992), which is consistent with our own findings.
5.3. Perceived presence in the virtual reality environment
As discussed in earlier sections, the questionnaire items regarding the subjects’ perceived presence in the virtual environment were designed to correspond to the three factors of presence defined by Schubert et al. (Citation2001): realness, involvement, and spatial presence. The Cronbach’s alpha reliability measure of 0.78 for the questionnaire indicates good internal consistency, showing that the items indeed measure the same structure (Cronbach Citation1951). shows the distribution of the responses for each question.
Fig. 11. Distribution of the participants’ responses to the questions related to their perceived presence. Each stacked bar is labeled according to the percentage of responses in each point of the scale, out of a sample size of 29 participants. The midpoint of the scale (3) is not shown in order to highlight trends toward the extreme ends of the scale.
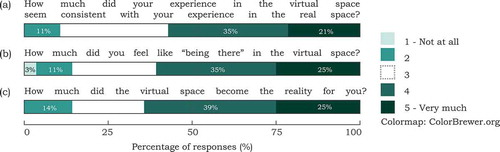
Along with the distribution of responses, we report the mean and standard deviation for each attribute—although our data are ordinal—to provide commonly used measures of comparison with the literature. From a sample size of 28 participants, 56% of the population responded in the positive range of the scale, and 11% responded in the negative range when evaluating the consistency of the experience between the real and virtual environments (µ = 3.680, σ = 0.94). Regarding their sense of being there in the virtual environment, 60% of participants evaluated this attribute positively and 14% evaluated it negatively (µ = 3.685, σ = 1.09); 64% rated their sense of being there in the virtual environment in the positive range, in contrast to 14% in the negative range (µ = 3.750, σ = 1.04).
Using the mean of the responses as a point of reference, we can compare our results with those from the second experimental study described in Kuliga et al. (Citation2015), where participants engaged in a walk in a real environment and the corresponding 2D virtual environment projected on a large screen. Our reported mean values for the perceived involvement and consistency of experience between the two environments are higher than those reported in the study by Kuliga et al. (Citation2015), although by a very small margin. This is particularly interesting when considering the limitations mentioned in Kuliga et al. (Citation2015) regarding the limited realism and field of view of the virtual environment used in their study, possibly suggesting that the high interaction of the participants with the environment through their navigation in the virtual space compensated for these limitations.
5.4. Effect of presentation oder
The presentation order of the experimental stimuli has been identified as a possible influencing factor in relevant studies (Bishop and Rohrmann Citation2003; Kuliga et al. Citation2015; Newsham et al. Citation2010). In this section, we investigate the effect of presentation order on both the perceptual accuracy of the method and the reported presence of the participants.
We categorize the responses of the participants into two groups: responses of participants who saw the real environment first (RF) or virtual environment first (VF), with sample sizes NRF and NVF, respectively, shown in . Because in this analysis we are seeking a significant difference and using multiple questionnaire items, we use a more conservative threshold for statistical significance using a Bonferroni correction and dividing the conventional significance level α of 0.05 by the number of items tested.
Table 10. Results of the Wilcoxon rank sum test for the effect of presentation order on the perceptual accuracy and perceived presence in the virtual space
Because we are interested in identifying an effect on the perceptual accuracy of the method, we test the differences between the paired responses in the two environments. By conducting a Wilcoxon rank sum test for independent ordinal data and using the conservative significance level α′ = 0.05/5 = 0.01, we observe no statistically significant differences between conditions of presentation order for the perceptual accuracy of the studied attributes, with the exception of perceived pleasantness (P = 0.000, rank sum statistic = 134.5), as shown in .
The means of the two data sets, µRF = −0.714 and µVF = 0.357, are very enlightening in this case, because each data set consists of the responses in the virtual space subtracted from their paired responses in the real space. A mean with a negative sign shows that the virtual environment was rated more positively that the real one and vice versa for a positive sign. This finding indicates that the second environment that was experienced by the participant, independent of its type, was evaluated as more pleasant. Contrary to the findings of Newsham et al. (Citation2010), who identified an effect caused by a particular presentation order, reporting that there were fewer differences between real and virtual environments for participants who saw the real space first, we observed an effect of order that depends on the sequence rather than the type of presentation, impacting how pleasant the space was perceived.
We used the same procedure to test the effect of presentation order on the evaluations of the three questions regarding the reported presence in the virtual space, using a significance level of α″ = 0.05/3 = 0.016. No significant differences were observed between the two presentation orders for any of the three dimensions of presence. The absence of an effect of presentation order on the perceived consistency in the experience of the two environments possibly deviates from the results of Bishop and Rohrmann (Citation2003), who found that participants who saw the real environment first evaluated the realism of the simulated environment more positively.
6. Discussion
The participants were invited to discuss their thoughts on the experiment at the end of each experimental session. These comments, omitted for brevity, allow the identification of specific limitations of the current study. The participants pinpointed the difference in sky conditions in the two spaces and the lack of details in the virtual environment as a possible factor in discrepancies between the evaluations of the two environments. Another limitation was the representation of view from the window, because the scenery could change in the real space but not in the virtual one, as a result of the weather conditions or people passing by. Although the statistical analysis of the subjective evaluations showed that the two environments were perceived very similarly, there were inevitable differences between the real conditions and those pictured in the virtual environment, such as the luminance of the scenes (Appendix A.4). Though it could be a limiting factor for the perceptual accuracy and reported presence in this experiment, this might not pose a problem for studies in the virtual environment if there is no need for immediate representation and comparison with the real environment. The positive results regarding the perceptual accuracy of the VR method demonstrate that the immersive virtual environment could be used to adequately convey the visual experience of a real space for the studied perceptual attributes. These findings, along with the mobility offered by this technology, are encouraging for a wide range of possible applications, from education and practice in lighting design and architecture to lighting research, as a means to experience and evaluate luminous conditions in indoor spaces. However, the limited luminance range of the current head-mounted displays is a limiting factor for the investigation of visual discomfort, because it can be problematic to reproduce conditions inducing discomfort such as glare in the virtual reality environment.
Another important challenge in this study regards the tone mapping of the scenes. High range dynamic images have to be compressed to the dynamic range of the selected display, making the subject of tone-mapping operators crucial in the creation of virtual environments (Engelke et al. Citation2013; Murdoch et al. Citation2015; Reinhard et al. Citation2002; Salters et al. Citation2012).
The selection and application of a tone-mapping operator is particularly challenging in the context of an immersive virtual scene, because the content and contrast of the scene changes with the user’s head movement. Current tone-mapping operators are static and applied to the whole virtual scene, whereas an adaptive dynamic behavior would correspond more accurately to human perception. Ongoing work from the authors investigates the perceptual accuracy of different tone-mapping algorithms for the representation of various lighting conditions in immersive virtual reality, using a newer device, the Oculus Rift CV1, which provides a higher resolution and refresh rate.
Due to the nature of this study, where we are seeking the absence of significant differences between the evaluations in real and virtual environments, it is important to note that our findings cannot be generalized to other parameters without further investigation. As discussed in section 3.5, our sample size was adequate for detecting medium to large effects but limited the ability to identify an effect of small magnitude. However, such an effect, as described by Cohen (Citation1992), would be smaller than something noticeable by the naked eye of an observer and thus would be unlikely to affect the overarching findings and usability of the proposed experimental method. Given the importance of validation for the establishment of any new method or technological advancement, further studies are encouraged to test the adequacy of immersive virtual reality scenes in different settings. Indicative settings could include omnidirectional stereoscopic content, improvements on the luminance of the display, and different luminous conditions or levels of user interaction with the environment.
7. Conclusion
In this article, the authors introduced a novel method for generating immersive virtual reality scenes based on photometrically accurate lighting simulations and test the adequacy of this method as an alternative environment for subjective experiments on five aspects of the perception of daylit interior spaces (pleasantness, complexity, excitement, interest, and satisfaction with the amount of view out). The adequacy of this method is assessed in three different areas: the perceptual accuracy of subjective evaluations in virtual scenes of daylit interiors, the effect of the virtual reality headset on the users’ physiological reactions, and their perceived presence in the virtual environment.
Though no significant differences were observed between the evaluations in the real and virtual environments or between the participants’ reported physical symptoms before and after the experimental sessions in the respective nonparametric tests, the authors decided to adopt a more conservative approach, employing a small Cohen’s d effect size as an additional threshold. Following the combination of the two indicators, the perceived impressions of pleasant, interesting, and satisfied with amount of view were deemed sufficiently accurate, whereas complex and exciting had marginally higher effect sizes. The use of the headset did not impact the self-reported physical symptoms of the participants based on the set threshold, with the exception of eye strain, corresponding to a small to medium, rather than small, effect size. Lastly, the reported presence of the subjects in the virtual space showed very satisfactory results, comparable with other studies.
The experimental testing of the proposed method on the perceptual accuracy, adverse physiological effects, and perceived presence demonstrated the adequacy of the produced virtual reality environment to be used as a surrogate to real daylit spaces in subjective experiments investigating the perception of the studied subjective attributes and highlighted its potential as a promising medium for empirical research, to be further studied against additional real conditions. Future work is encouraged to investigate the adequacy of the described method to evaluate other aspects of subjective perception and experience.
Acknowledgments
The authors thank Professor Steve Fotios for his valuable feedback, Professor Jean-Marie Fürbringer and Peter Hansen for their technical support in the design of experiments, Lorenzo Cantelli for his help with the VR headset, and Dr. Parag Rastogi for his contributions in the analysis of solar radiation for the sky descriptions.
Additional information
Funding
References
- Amundadottir ML, Rockcastle S, Sarey Khanie M, Andersen M. 2017. A human-centric approach to assess daylight in buildings for non-visual health potential, visual interest and gaze behavior. Build Environ. 113:5–21. doi:10.1016/j.buildenv.2016.09.033.
- Baños RM, Botella C, Rubió I, Quero S, García-Palacios A, Alcañiz M. 2008. Presence and emotions in virtual environments: the influence of stereoscopy. Cyberpsychol Behav. 11:1–8. doi:10.1089/cpb.2007.9936.
- Bishop I, Rohrmann B. 2003. Subjective responses to simulated and real environments: a comparison. Landscape Urban Plan. 65:261–277. doi:10.1016/S0169-2046(03)00070-7.
- Boyce PR. 2003. Human factors in lighting. London (UK): Taylor & Francis.
- Bülow-Hübe H. 1995. Subjective reactions to daylight in rooms: effect of using low-emittance coatings on windows. Lighting Res Technol. 27:37–44. doi:10.1177/14771535950270010601.
- Cauwerts C. 2013. Influence of presentation modes on visual perceptions of daylit spaces [Doctoral dissertation]. Université Catholique de Louvain; Louvain-la-Neuve, Belgium
- Cauwerts C, Bodart M. 2011. Investigation of 3D projection for qualitative evaluation of daylit spaces. In: Proceedings of PLEA 2011; Louvain-la-Neuve, Belgium.13–15. July 2011.
- Chamilothori K, Wienold J, Andersen M. 2016. Daylight patterns as a means to influence the spatial ambiance: a preliminary study. In: Proceedings of the 3rd international congress on ambiances; Volos, Greece; 21–24. September 2016
- Charton V. 2002. Etude comparative de la perception d’ambiances lumineuses en milieu réel et en milieu virtuel[Comparative study of the perception of luminous ambiences in the real environment and virtual environment] [Doctoral dissertation]. Lyon (France): L’Institut National des Sciences Appliquées de Lyon.
- Cohen J. 1988. Statistical power analysis for the behavioral sciences. New York (NY): Academic Press.
- Cohen J. 1992. Statistical power analysis. Curr Dir Psychol Sci. 1:98–101. doi:10.1111/1467-8721.ep10768783.
- Cronbach LJ. 1951. Coefficient alpha and the internal structure of tests. Psychometrika. 16:297–334. doi:10.1007/BF02310555.
- De Kort YA, Ijsselsteijn WA, Kooijman J, Schuurmans Y. 2003. Virtual laboratories: comparability of real and virtual environments for environmental psychology. Presence-Teleop Virt. 12:360–373. doi:10.1162/105474603322391604.
- Diemer J, Alpers GW, Peperkorn HM, Shiban Y, Mühlberger A. 2015. The impact of perception and presence on emotional reactions: a review of research in virtual reality. Front Psychol. 1–9. doi:10.3389/fpsyg.2015.00026.
- Engelke U, Stokkermans MGM, Murdoch MJ. 2013. Visualizing lighting with images: converging between the predictive value of renderings and photographs. Proceedings of SPIE 8651 Human Vision and Electronic Imaging XVIII, pages L1-L10. 3-7 February; Burlingame, CaliforniaRogowitzBE, Pappas TN, de Ridder H, editors. p. 86510L.
- Faul F, Erdfelder E, Lang A-G, Buchner A. 2007. G*Power 3: a flexible statistical power analysis program for the social, behavioral, and biomedical sciences. Behav Res Methods. 39:175–191. doi:10.3758/BF03193146.
- Ferguson CJ. 2009. An effect size primer: a guide for clinicians and researchers. Prof Psychol-Res Pr. 40:532–538. doi:10.1037/a0015808.
- Flynn JE, Spencer TJ, Martyniuk O, Hendrick C. 1973. Interim study of procedures for investigating the effect of light on impression and behavior. J Illum Eng Soc. 3:87–94. doi:10.1080/00994480.1973.10732231.
- Franz G, von der Heyde M, Bülthoff HH. 2005. An empirical approach to the experience of architectural space in virtual reality—exploring relations between features and affective appraisals of rectangular indoor spaces. Automat Constr. 14:165–172. doi:10.1016/j.autcon.2004.07.009.
- Greene N. 1986. Environment mapping and other applications of world projections. IEEE Comput Graph. 6:21–29.
- HedgesL. V., Olkin I.(1985).tatistical methods for meta-analysis. San Diego, CA: Academic Press.
- Hendrick C, Martyniuk O, Spencer TJ, Flynn JE. 1977. Procedures for investigating the effect of light on impression simulation of a real space by slides. Environ Behav. 9:491–510. doi:10.1177/001391657794003.
- Heydarian A, Carneiro JP, Gerber D, Becerik-Gerber B, Hayes T, Wood W. 2015. Immersive virtual environments versus physical built environments: a benchmarking study for building design and user-built environment explorations. Automat Constr. 54:116–126. doi:10.1016/j.autcon.2015.03.020.
- Heydarian A, Pantazis E, Carneiro JP, Gerber D, Becerik-Gerber B. 2015. Towards understanding end-user lighting preferences in office spaces by using immersive virtual environments. In: Proceedings of the 2015 international workshop on computing in civil engineering; Austin (TX): American Society of Civil Engineers.21–23 June 2015.
- Holl S, Kwinter S, Safont-Tria J. 2011. Color, light, time. 1st ed. Zurich (Switzerland); Lars Müller.
- Kim YY, Kim HJ, Kim EN, Ko HD, Kim HT. 2005. Characteristic changes in the physiological components of cybersickness. Psychophysiology. 42:616–625.
- Kuliga SF, Thrash T, Dalton RC, Hölscher C. 2015. Virtual reality as an empirical research tool—exploring user experience in a real building and a corresponding virtual model. Comput Environ Urban. 54:363–375. doi:10.1016/j.compenvurbsys.2015.09.006.
- Lambooij M, IJsselsteijn W, Bouwhuis DG, Heynderickx I. 2011. Evaluation of stereoscopic images: beyond 2D quality. IEEE T Broadcast. 57:432–444. doi:10.1109/TBC.2011.2134590.
- Larson GW, Shakespeare RA. 1998. Rendering with Radiance—the art and science of lighting visualization. San Francisco (CA): Morgan Kaufmann.
- Lessiter J, Freeman J, Keogh E, Davidoff J. 2001. A cross-media presence questionnaire: the ITC-Sense of Presence Inventory. Presence-Teleop Virt. 10:282–297. doi:10.1162/105474601300343612.
- Lipsey M, Hurley S. 2009. Design sensitivity: statistical power for applied experimental research. In: The SAGE handbook of applied social research methods. 2nd ed. Thousand Oaks (CA): SAGE. p. 44–76.
- Loomis JM, Blascovich JJ, Beall AC. 1999. Immersive virtual environment technology as a basic research tool in psychology. Behav Res Meth Ins C. 31:557–564. doi:10.3758/BF03200735.
- Loomis JM, Da Silva JA, Philbeck J, Fukusima S. 1996. Visual perception of location and distance. Curr Dir Psychol Sci. 5:72–77. doi:10.1111/1467-8721.ep10772783.
- Mahdavi A, Eissa H. 2002. Subjective evaluation of architectural lighting via computationally rendered images. J Illum Eng Soc. 31:11–20. doi:10.1080/00994480.2002.10748388.
- Manyoky M. 2015. Visual–acoustic simulation for landscape impact assessment of wind parks [Dissertation]. Zürich (Switzerland): Eidgenössische Technische Hochschule ETH.
- McNeil A. 2016. Rendering omni-directional stereo images with Radiance; Padov, aItaly.29–30 August 2016.
- Moscoso C, Matusiak B, Svensson UP. 2015. Impact of window size and room reflectance on the perceived quality of a room. J Archit Plann Res.32(4):294–306.
- Moscoso C, Matusiak B, Svensson UP, Orleanski K. 2015. Analysis of stereoscopic images as a new method for daylighting studies. ACM Trans Appl Perce. 11:21.
- Murdoch MJ, Stokkermans MGM, Lambooij M. 2015. Towards perceptual accuracy in 3D visualizations of illuminated indoor environments. J Solid State Lighting. 2:1. doi:10.1186/s40539-015-0029-6.
- Newsham GR, Cetegen D, Veitch JA, Whitehead L. 2010. Comparing lighting quality evaluations of real scenes with those from high dynamic range and conventional images. ACM Trans Appl Perce. 7:1–26. doi:10.1145/1670671.
- Newsham GR, Richardson C, Blanchet C, Veitch JA. 2005. Lighting quality research using rendered images of offices. Lighting Res Technol. 37:93–115. doi:10.1191/1365782805li132oa.
- Oculus Rift Developer Guide. Version 0.6.0.0. 2015.
- Parpairi K, Baker NV, Steemers KA, Compagnon R. 2002. The luminance differences index: a new indicator of user preferences in daylit spaces. Lighting Res Technol. 34:53–66. doi:10.1191/1365782802li030oa.
- Preston CC, Colman AM. 2000. Optimal number of response categories in rating scales: reliability, validity, discriminating power, and respondent preferences. Acta Psychol (Amst). 104:1–15. doi:10.1016/S0001-6918(99)00050-5.
- Reinhard E, Stark M, Shirley P, Ferwerda J. 2002. Photographic tone reproduction for digital images. In: Proceedings of the 29th annual conference on computer graphics and interactive techniques. New York (NY): ACM. p. 267–276.
- Reinhart CF. 2005. Tutorial on the use of daysim/radiance simulations for sustainable design. Ottawa (Canada): NRC.
- Rockcastle S, Amundadottir ML, Andersen M. 2016. Contrast measures for predicting perceptual effects of daylight in architectural renderings. Lighting Res Technol. doi:10.1177/1477153516644292.
- Rockcastle S, Andersen M. 2014. Measuring the dynamics of contrast & daylight variability in architecture: a proof-of-concept methodology. Build Environ. 81:320–333. doi:10.1016/j.buildenv.2014.06.012.
- Rockcastle S, Chamilothori K, Andersen M. 2017. Using virtual reality to measure daylight-driven interest in rendered architectural scenes. In: Proceedings of Building Simulation 2017; San Francisco, CA.
- Russell JA. 1980. A circumplex model of affect. J Pers Soc Psychol. 39:1161–1178. doi:10.1037/h0077714.
- Salters B, Murdoch M, Sekulovksi D, Chen S-H, Seuntiens P. 2012. An evaluation of different setups for simulating lighting characteristics.Proceedings of SPIE 8291Human Vision and Electronic Imaging XVII, pages M1 - M13. Burlingame (CA);22–26. January 2012.
- Schubert T, Friedmann F, Regenbrecht H. 2001. The experience of presence: factor analytic insights. Presence-Teleop Virt. 10:266–281. doi:10.1162/105474601300343603.
- Sharples S, Cobb S, Moody A, Wilson JR. 2008. Virtual reality induced symptoms and effects (VRISE): comparison of head mounted display (HMD), desktop and projection display systems. Displays. 29:58–69. doi:10.1016/j.displa.2007.09.005.
- Shibata T, Kim J, Hoffman DM, Banks MS. 2011. The zone of comfort: predicting visual discomfort with stereo displays. J Vis. 11:1–29. doi:10.1167/11.8.11.
- Siegel S. 1956. Nonparametric statistics for the behavioral sciences. 1st ed. p. 312. New York (NY): McGraw-Hill.
- Slater M, Wilbur S. 1997. A framework for immersive virtual environments (FIVE): speculations on the role of presence in virtual environments. Presence-Teleop Virt. 6:603–616. doi:10.1162/pres.1997.6.6.603.
- Thanachaeronkit A, and Scartezzini J.-L. 2010. Modelling Complex Fenestration Systems using Physical and Virtual Models, Solar Energy. Presence-Teleop Virt. 4, pp.563–386. https://doi.org/10.1016/j.solener.2009.09.009.
- van der Spek ED, Houtkamp JM. 2008. Mixing emotions, how physical discomfort influences the affective appraisal of virtual places. In: 2008 International Conference Visualisation. p. 18–22. 9-11 July 2008.
- Van Erp T. 2008. The effects of lighting characteristics on atmosphere perception [Master’s thesis]. Eindhoven (Netherlands): Eindhoven University of Technology.
- Vogels I. 2008. Atmosphere metrics—development of a tool to quantify experienced atmosphere. In: Westerink JHDM, editor. Probing experience: from assessment of user emotions and behaviour to development of products. Dordrecht (The Netherlands): Springer. p. 25–41.
- Ward Larson G. 1994. The RADIANCE lighting simulation and rendering system. In: Proceedings of the 21st annual conference on computer graphics and interactive techniques. New York (NY): ACM. p. 459–472.
- Zumthor P. 2006. Atmospheres : architectural environments—surrounding objects. Basel (Switzerland): Birkhäuser–Publishers for Architecture.
Appendix
A.1. Radiance sky description for the virtual scenes
The gendaylit script in Radiance can generate a sky description based on given sky radiation measures, date, and local standard time. Because the experiment would take place in November, we calculated the diffuse horizontal and direct normal irradiance for overcast and clear skies in this month. Using the Geneva 067000 (IWEC) EPW weather file, we selected the days in November with overcast and clear skies and their hourly values were used to interpolate the diffuse horizontal and direct normal irradiance for every half hour. The values corresponding to the hour and sky type selected for our simulations, shown in Table A1, were then used in the gendaylit script with the −W option to create descriptions of sky for each scene. The two scenes with overcast sky had an identical sky description and different images mapped on the Radiance sky.
Table A1. Diffuse horizontal irradiance and direct normal irradiance used in gendaylit to generate the description of sky for each of the rendered scenesa.
A.2. Material properties for the cubemap projection
In order have full control over the environment projected in VR, we applied an unlit two-sided material to the cube, ensuring that the textures were unaffected by lighting sources in Unity and that the scene appeared correctly from the user’s point of view. The material is created by manipulating the default Unlit Shader in Unity and adding the option Cull off, which enables the rendering of all faces of the objects in the Unity scene.
A.3. Inherent variation in subjective responses
A limitation of this experiment is the lack of repeated measures from the same participant for the same stimulus, which could provide information on the amount of variance that is expected in any assessment due to the subjective nature of questionnaire responses. To this end, we conducted a follow-up study including a randomized repeated verbal assessment for the same scene, in either the real or virtual environment, and compared the responses of participants between their first and second evaluations. From a total of 56 paired responses, the mean absolute differences between the repeated measures for the combined attributes of how pleasant, interesting, and exciting the space was perceived, µ|z|repeated, was 0.325, normalized for a 5-point scale. Interestingly, this value, though averaged for the three attributes of pleasantness, interest, and excitement, corresponds roughly to half of our reported mean absolute differences between the real and virtual environments shown in . Using this difference as a reference could help explain whether a part of the observed variance between environments is inherent in the nature of subjective evaluation and to what extent it is an effect of the virtual reality medium.
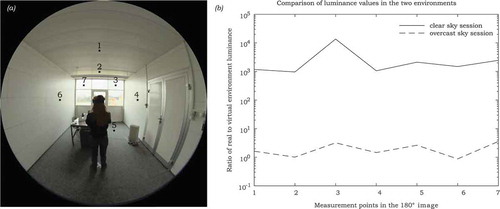
A.4. Luminance comparison in the real and virtual environments
In order to provide a measure of the luminance discrepancy between the real environment and its virtual representation projected in Oculus DK2, we compare the luminance in seven reference points between the two environments. First, we group the 29 experimental sessions based on the sky type of the projected virtual scene in the session, either clear sky (N = 5) or overcast sky (N = 24). Using as a reference the 180° HDR photograph of a randomly selected session from each group, transformed into an angular fisheye projection, we simulate the scene from the same viewpoint with the photograph as a 180° fisheye image with the equivalent rendering settings and ambient data as the virtual scene that was shown in this particular session. The luminance in the real space is directly measured from the HDR photograph, whereas for the projected images of the virtual space it is derived using the response curve of the Oculus DK2 display. Becaus our reference for the luminance in the real space is an HDR photograph taken from a viewpoint behind the subject (), rather than from their point of view, we choose to reproduce the virtual scene of the session from the same viewpoint. Although the resulting luminance measurements do not directly correspond to those from the subject’s point of view, they allow for comparable assessment of the luminance deviation between the real and virtual scenes, shown in .
Fig. A1. (a) Reference points on the fisheye images and (b) ratio of the luminance measurements in those points between the real and virtual environments for the equivalent sessions in both sky types, using a logarithmic scale for the y axis.