
 ?Mathematical formulae have been encoded as MathML and are displayed in this HTML version using MathJax in order to improve their display. Uncheck the box to turn MathJax off. This feature requires Javascript. Click on a formula to zoom.
ABSTRACT
The Farnsworth-Munsell 100 Hue Test, a test that measures an individual’s hue discrimination ability, operates with the fundamental assumption that it is administered using a fixed, standard illuminant. This assumption is violated when the testing illuminant is changed—as is common when testing color discrimination ability of an illuminant—which likely causes a reordering of the caps in the test. To ensure that a participant is not falsely penalized for correctly responding to a hue transposition caused by the new testing light source, an adjusted error score is proposed that reconciles light source–induced hue transpositions and participant performance on the test.
1. Introduction
The Farnsworth-Munsell 100 Hue Test (FM-100) is a physical test of hue discrimination, consisting of 85 colored caps whose chromaticities are distributed around the hue circle. It contains four separate trays of caps—tray A is nominally red to red–orange, B is yellow to yellow–green, C is green to green–blue, and D is indigo to indigo–magenta—that are moveable between two fixed, colored end caps (). The test is used to evaluate the hue discrimination ability of an individual, to classify that individual into superior, average, or low discrimination ability, and to identify individual color anomaly (Farnsworth Citation1957). The FM-100 hue test is largely used as a research tool to understand normal color vision (Kinnear and Sahraie Citation2002; Malone and Hannay Citation1977) and to detect and study its deficiencies (Farnsworth Citation1943; Moreland et al. Citation2014; Verriest Citation1963, Citation1974; Vingrys et al. Citation1992). It is also used as a clinical screening test of color vision for professionals in color-critical applications such as manufacturing (paints, dyes, et cetera) and health care.
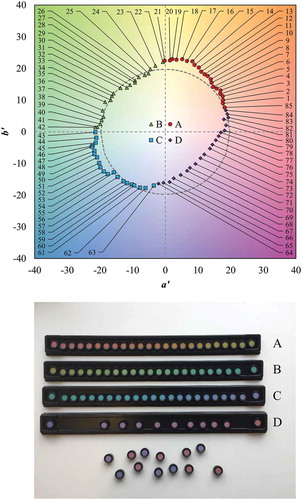
Fig. 1. (Top) The distribution of caps of the FM-100 hue test in the a′b′ plane of CAM02-UCS (using the CIE 1964 10° standard observer) illuminated by CIE standard illuminant C. The caps have an average lightness correlate (J′) of 60.15 and an average colorfulness correlate (M′) of 19.73 (Luo et al. Citation2006). The dashed circle shows an equal colorfulness of 19.73 across all hues. Number labels indicate cap number. (Bottom) Top view of the four physical test trays of the FM-100 test. Tray A has 22 moveable caps between two fixed end caps; trays B, C, and D have 21.
Concerning a light source, color discrimination describes the ability of a light source to allow observers to distinguish between colors of slightly different hue when viewed simultaneously (Thornton Citation1972). To quantify this ability, past researchers have used an experimental design that has participants complete the FM-100 hue test under systematically varied light spectra (Boyce and Simons Citation1977; Esposito Citation2016; Esposito and Houser Citation2017; Mahler et al. Citation2009; Rea and Freyssinier-Nova Citation2008; Royer et al. Citation2012; Wei and Houser Citation2012). The ultimate goal is to link light source colorimetric performance parameters—such as color fidelity (CIE Citation1995; Davis and Ohno Citation2010; IES Citation2015; Smet et al. Citation2015) and gamut area (Davis and Ohno Citation2010; IES Citation2015; Rea and Freyssinier-Nova Citation2008; Thornton Citation1972)—to FM-100 error scores, to predict color discrimination ability of light sources. Absolute thresholds for classifying a light source’s color discrimination ability have yet to be determined. Esposito and Houser (Citation2017) offered a preliminary proposal using a measure of light source–induced cap transpositions called the Total Light Source Error Score, Rd (described in Section 3).
Though varying the light source is necessary for determining a causal link between light source performance parameters and light source color discrimination, doing so violates the intrinsic requirement that the FM-100 hue test be administered with a fixed testing source. In 1957, Farnsworth stated: “reliable results cannot be expected from this test unless standard illumination is used.” That standard illumination is CIE Standard Illuminant C (or daylight), because it retains an optimal spacing of the caps in chromaticity space (Farnsworth Citation1943), which also preserves their numerical order.
Changing the testing light source will alter the hue, chroma, and lightness of the test chips, but it may also swap colored caps or significantly reorder them altogether (Esposito Citation2016; Esposito and Houser Citation2017; Moreland et al. Citation2014). When the test is administered using a light source that causes such transpositions of caps, errors will be miscalculated and the experimental results distorted.
To right this discrepancy, an adjusted Total Error Score is detailed that accounts for the interaction between the light source spectral power distribution (SPD) and the spectral reflectance distribution (SRD) of the FM-100 hue test chips.
2. Standard total error score
The score for any individual cap of the FM-100 test “is the sum of the [absolute] difference between the number of that cap and the numbers of the caps adjacent to it” minus 2 (Farnsworth Citation1957). For example, the arrangement 29–30–31–32 has an error score of zero, and 29–31–30–32 (one transposition) has an error score of 4 (Appendix, Scenario 1). Two transpositions correspond to an error score of 8, three to an error of 12, four to an error of 16, and so on. The Total Error Score (TES) is computed as the sum of the error scores for each of the four separate trays of the test:
where
i is a counter for the four trays (i = 1 is A, 2 is B, 3 is C, and 4 is D);
Cj is the cap number of the jth cap Footnote1;
CEj is the cap error of the jth cap Footnote2;
n is the number of moveable caps in the tray corresponding to i (n = 22 for tray A and 21 for trays B, C, and D);
AES is the standard error score for tray A;
BES is the standard error score for tray B;
CES is the standard error score for tray C;
DES is the standard error score for tray D.
The calculation software that accompanies the physical FM-100 hue test uses (1) and is only applicable when the testing light source preserves the numerical order of caps.
3. An adjusted total error score
The adjusted Total Error Score (TESadj) (Esposito and Houser Citation2017) is a modified Farnsworth-type error score that compares the order of the FM-100 hue test chips illuminated by the testing source—calculated based on hue angle in the a′b′ plane of the CAM02-UCS (Fairchild Citation2013; Luo et al. Citation2006)—to a participant’s order of caps. TESadj guarantees that a participant is not penalized for correctly responding to a hue transposition caused by the light source or mistakenly rewarded because the analysis does not consider the light source’s impact on cap order. TESadj reconciles the discrepancy between a light source–induced transposition and a transposition arranged by a participant performing the test:
where
i is a counter for the four trays (i = 1 is A, 2 is B, 3 is C, and 4 is D);
Pj is the place number of the jth cap (demonstrated in Appendix, Scenario 2);
PEj is the place error of the jth cap;
n is the number of moveable caps in the tray corresponding to i (n = 22 for tray A and 21 for trays B, C, and D);
AESadj is the adjusted error score for tray A;
BESadj is the adjusted error score for tray B;
CESadj is the adjusted error score for tray C;
DESadj is the adjusted error score for tray D.
The principal difference between (1) and (2) is the place number, which is an n × 1 array that is determined by cross-referencing the numerical cap order with their correct place in the array of caps illuminated by the testing illuminant.
As an example, if a light source causes the order of caps 29–31–30–32 and a participant arranges these caps accordingly in tray B of the test, he or she would not be attributed an error (as opposed to an error score of 4 using (1)). In this example, cap number 31 is the ninth cap in the correct order (Pj = 9) and cap number 30 is the 10th cap in the correct order (Pj = 10). When the light source causes no cap transpositions, place number is equal to cap number (Pj = Cj), the adjusted Total Error Score is equal to the standard error score (TESadj = TES), and (2) collapses to (1).
4. Light source error score
Applying (1) directly to the cap order under the testing illuminant produces an objective measure of light source–induced cap transpositions, called the Total Light Source Error Score, Rd (Esposito Citation2016; Esposito and Houser Citation2017); Esposito and Houser (Citation2017) proposed Rd as a measure of color discrimination. Rd is a source-specific error score and is the sum of the source-specific error scores for each of the four trays of the FM-100 hue test:
where
i is a counter for the four trays (i = 1 is A, 2 is B, 3 is C, and 4 is D);
Ctj is the cap number of the jth cap, as ordered by the testing light source;
CEtj is the cap error of the jth cap, as ordered by the testing light source;
n is the number of moveable caps in the tray corresponding to i (n = 22 for tray A and 21 for trays B, C, and D);
Rd is the total light source error score;
Rd,A is the light source error score for tray A;
Rd,B is the light source error score for tray B;
Rd,C is the light source error score for tray C;
Rd,D is the light source error score for tray D.
An Rd of 4 indicates that the light source causes one transposition, a value of 8 is two transpositions, 12 is three transpositions, and so on. shows Rd values for select light sources.
Table 1. Rd for select light sources from the library of the IES TM-30-15 calculator. Multiple spectra of the same source type sometimes exhibited different Rd values. For example, there were multiple phosphor-based LED sources in the library that collectively exhibited all Rd values between 0 and 28.
The Rd calculation compares the order of caps illuminated by the light source to the numerical order of caps that occurs, by design, under CIE standard illuminant C. CIE C, then, becomes the de facto reference.
5. Discussion
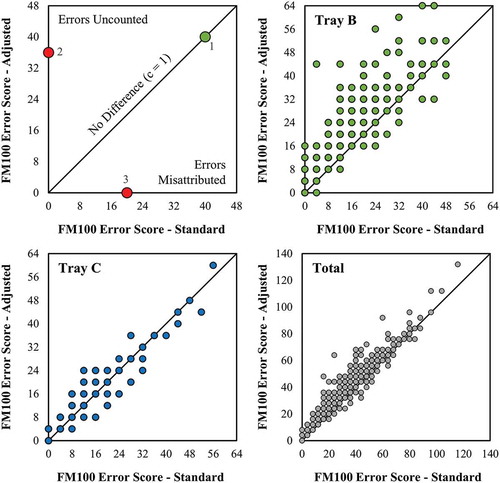
shows that many common light sources, as well as many experimental spectra, transpose at least one cap of the FM-100 hue test. A recent study by Esposito and Houser (Citation2017) evaluated the color discrimination ability of 24 experimental light emitting diode (LED) spectra, 17 of which transposed at least one cap of the FM-100 hue test (Rd ≥ 4). On average, the difference between TES and TESadj for those 17 sources was 7.6 (approximately two transpositions) and as large as 40. shows a comparison of TES and TESadj for their spectra; the comparison suggests that if the order of caps illuminated by the testing source is not considered, results will be significantly distorted. This may lead to erroneous conclusions about the color discrimination ability of a light source.
Fig. 2. (Top left) A generalized comparison of standard error score and adjusted error score. Point 1 indicates that the standard error score equals the adjusted error score (that is, ES = ESadj), which only occurs when a light source causes no cap transpositions (Rd = 0). Equation (1) assumes that the light source causes no cap transpositions and that all resulting participant error scores fall on the c = 1 line. For point 2, the adjusted error score is higher than a standard error score of zero (that is, ESadj > ES = 0), which occurs when a light source causes many transpositions and the participant orders his or her caps in exact numerical order; in this scenario, many errors would be uncounted using the standard error score calculation. For point 3, the standard error score is higher than an adjusted error score of zero (that is, ES > ESadj = 0), which occurs when the light source causes several transpositions and the participant exactly responds. In this scenario, errors are misapplied to the participant using the standard error score calculation because the correct order of caps is not the numerical order. (Top right/bottom left) Trays B and C error score comparison, respectively, for 480 responses (24 spectra × 20 participants) from Esposito and Houser (Citation2017). (Bottom right) Total error score comparison for the same study. Seventeen of their 24 experimental spectra caused at least one hue transposition, which resulted in a large overall discrepancy between TES and TESadj. It is clear that the assumption that all responses fall on the c = 1 line will result in significant error. Note that these panels are a new calculation from the data of Esposito and Houser (Citation2017).
It is possible for a light source to transpose a free cap with a fixed end cap of its given tray. In this scenario, any placement of that cap on the tray is erroneous. Because participants are not permitted to omit caps from the tray—and allowing them to do so is not advisable in order to maintain the simplicity of the testing and scoring procedure—the participant should not be penalized for the error. In this scenario, the transposed cap can simply be removed from the tray before administering the test. Equation (2) will therefore need to be modified to account for the reduced number of caps in the tray; the calculation is otherwise straightforward.
End cap transpositions are, however, seemingly uncommon; none of the 24 structured LED spectra of Esposito and Houser (Citation2017) transposed any of the free caps of the FM-100 hue test with any of the fixed caps; six high-pressure sodium and four mercury vapor lamps (spectra taken from the IES TM-30-15 calculator)—which are known to have poor color discrimination ability and transpose many caps ()—also cause no end cap transpositions.
6. Conclusion
This article details an adjusted error score calculation for the Farnsworth-Munsell 100 Hue Test that considers the impact of a light source’s spectra on cap order, which corrects a fundamental discrepancy between actual cap order and participant performance in color discrimination research. Studies that administer the FM-100 hue test without the recommended standard illuminant (CIE C or daylight) should consider the light source’s impact on cap order and utilize the adjusted error score calculation to avoid potentially distorted results.
Supplemental calculator
Download (1.6 MB)Acknowledgments
The author thanks X-rite for supplying the spectral reflectance distributions of the caps of the FM-100 test and for granting permission to publish the supplemental calculator that accompanies this article. Also, the author gratefully acknowledges Kevin Houser for his help facilitating the discussion to acquire permission.
Supplemental material
An Excel spreadsheet, which performs the computations described herein, accompanies this manuscript and is available online and linked by the same DOI as this manuscript.
Disclosure statement
The author reported no declarations of interest.
Supplementary material
Supplemental data for this article can be accessed on the publisher’s website.
Additional information
Funding
Notes
1. For this equation to work properly, the terms |Cj − Cj + 1| and |Cj − Cj − 1| must each be equal to 1 when the caps are ordered correctly. Because the first free cap in tray A is numbered 85, not 1, the calculation requires a dummy array that assigns cap 85 a value of 1, cap 1 a value of 2, and so on.
2. The cap error must be calculated for the end caps of the try; otherwise, results will be incorrect when errors are made near the tray’s ends; this necessitates the n + 2 term in the equation, the 2 accounting for each end cap.
Related Research Data
References
- [CIE] Commission Internationale de l’Eclairage. 1995. Method of measuring and specifying colour rendering properties of light sources. Vienna (Austria): CIE. Publication No: CIE 13.3-1995.
- [IES] Illuminating Engineering Society. 2015. IES method for evaluating light source color rendition. New York (NY): IES. Publication No: IES TM-30-15.
- Boyce PR, Simons RH. 1977. Hue discrimination and light sources. Lighting Res Technol. 9(3):125-36.
- Davis W, Ohno Y. 2010. Color quality scale. Opt Eng. 49:033602.
- Esposito T. 2016. Modelling color rendering and color discrimination with average fidelity, average gamut, and gamut shape [dissertation]. University Park (PA): The Pennsylvania State University. p. 190. Available from: Penn State’s eTD database, https://etda.libraries.psu.edu/catalog/13478txe136/.
- Esposito T, Houser KW. 2017. A new measure of colour discrimination for LEDs and other light sources. Lighting Res Technol. Published online before print. doi:10.1177/1477153517729200.
- Fairchild M. 2013. Color appearance models. 3rd ed. Chichester (UK): John Wiley & Sons, Ltd. 450 p.
- Farnsworth D. 1943. The Farnsworth-Munsell 100-hue and dichotomous test for colour vision. J Opt Soc Am. 33(10):568-78.
- Farnsworth D. 1957. The Farnsworth-Munsell 100-Hue test for the examination of colour discrimination: Manual. Grand Rapids (MI): Munsell Color Company. 9 p.
- Kinnear PR, Sahraie A. 2002. N New Farnsworth-Munsell 100 hue test norms of normal observers for each year of age 5–22 and for age decades 30–70. Br J Ophthalmol. 86(12):1408-11.
- Luo MR, Cui G, Li C. 2006. Uniform colour spaces based on CIECAM02 color appearance model. Color Res Appl. 31(4):320-30.
- Mahler H, Jean-Jacques E, Francoise V. 2009. Testing LED lighting for colour discrimination and colour rendering. Color Res Appl. 34(1):8-17.
- Malone DR, Hannay J. 1977. The Farnsworth-Munsell 100-hue test: A questions of norms. Percept Mot Skills. 44:1249-50.
- Moreland J, Cheung V, Westland S. 2014. Evaluation of a model to predict anomalous-observer performance with the 100-hue test.J Opt Soc Am. 31(4):A125-30
- Rea MS, Freyssinier-Nova JP. 2008. Color Rendering: A tale of two metrics. Color Research and Application. 33(3). 192-202.
- Royer MP, Houser KW, Wilkerson AM. 2012. Color Discrimination Capability under Highly Structured Spectra. Color Res App. 37(6):441-49.
- Smet KAG, Whitehead L, Schanda J, Luo RM. 2015. Toward a replacement of the CIE color rendering index for white light sources. Leukos 2015. 12(1–2):61-9.
- Thorton WA 1972. Color-discrimination index. J Opt Soc Am. 62(2):191-94.
- Verriest G. 1963. Further studies on acquired deficiency of color discrimination. J Opt Soc Am. 53(1):185-95.
- Verriest G. 1974. Recent advances in the study of acquired deficiencies of color vision. Atti. Fond. G. Ronchi. 29(3):369-449.
- Vingrys AJ, Atchinson DA, Bowman AJ. 1992. The use of colour difference vectors in diagnosing congenital colour vision deficiencies with the Farnsworth-Munsell 100-hue test. Ophthalmic Physiol Opt. 12(1):38-45.
- Wei M, Houser KW. 2012. Colour discrimination of seniors with and without cataract surgery under illumination from two fluorescent lamp types. In: CIE X037. p. 359-68.
AppendixScenario 1
In this example, the light source does not cause any cap transpositions (Rd = 0; see Section 4), and a participant makes one transposition in physical test tray B (BES = 4). Because the light source does not cause any transpositions, (1) applies.
j is the cap counter from (1);
Response order is the order of caps of tray B, as ordered by a hypothetical participant;
CEj is the cap error associated with the jth cap.
Table A1. Worked example where Rd = 0 and BES = 4.
Scenario 2
In this example, the light source causes one transposition in tray B (Rd,B = 4; see Section 4), and the participant does not correctly respond to that transposition (BESadj = 4). Note that if (1) was applied to this participant’s response, he or she would have an error score of zero (BES = 0), which would be erroneous because the participant did not correctly respond to the light source.
j is the cap counter from (2);
Source is the order of the caps of tray B, under a hypothetical light source;
Response order is the order of caps of tray B, as ordered by a hypothetical participant;
ID is a fixed dummy array of numbers used as an intermediate variable to determine Pj;
Pj is the place number from (2), which renumbers the participant’s order of caps based on their correct place compared to the source order. In this example, Excel function VLOOKUP was used to calculate Pj;
PEj is the error associated with the jth place.
Table A2. Worked example where Rd,B=4 and BESadj=4.