
 ?Mathematical formulae have been encoded as MathML and are displayed in this HTML version using MathJax in order to improve their display. Uncheck the box to turn MathJax off. This feature requires Javascript. Click on a formula to zoom.
ABSTRACT
Research indicates that spectral distribution and the direction of the light received at the eye are relevant parameters in studies looking into non-image-forming effects. Nonetheless, lighting conditions are often described with vertical illuminance at the eye and correlated color temperature only, both of which are integral measurements that are not appropriate to give information about the spatial distribution of light and its spectrum. This article describes approaches for spatially and spectrally resolved measurements to properly quantify lighting conditions in research on non-image-forming effects. The overview of measuring methods indicates that the spectral irradiance, when combined with a luminance image of the lighting setting, is an adequate measure in a large number of research approaches. Nonetheless, lighting conditions in experimental setups with different light sources or various surface reflectances require a higher resolution of detail. Four examples of devices are presented that can be applied in different experimental setups or lighting settings. A decision scheme is included to support the selection of the most suitable measuring equipment. The article concludes with a proposal for analysis and representation of the measurements.
1. Introduction
In a recent literature review, Souman et al. (Citation2018) analyzed 68 studies that investigated acute alerting effects of light. Fifteen studies looked into the effect of monochromatic and colored lighting; the remaining studies investigated polychromatic white lighting. Thirty-eight studies analyzed the effect of vertical illuminance at the eye, two thirds of which found that a higher light level has a positive effect on acute alertness, but 12 failed to find these effects. Fifteen studies investigated the effect of spectrum. Of these, 10 studies did not find any significant effects on alertness, and only 5 studies showed significantly better alertness with higher correlated color temperatures or higher content of blue in the spectrum. Souman et al. (Citation2018) discussed potential reasons for the lack of a clear pattern in the findings. The main reasons can be found in the methodology: small sample sizes, low statistical power, different ways of measuring alertness, and nighttime versus daytime studies. In addition, the characterization of the light manipulation differs between the studies.
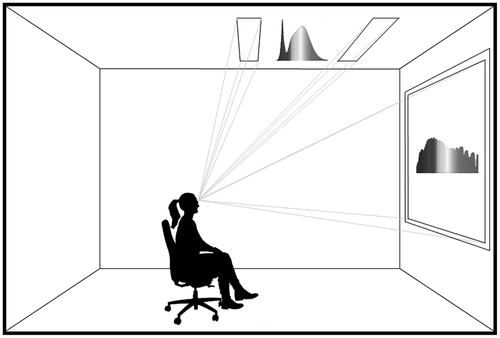
Light level is often represented with vertical illuminance at the eye, and spectral power distribution (SPD) is mostly characterized by correlated color temperature (CCT). illustrates why the simple description of light with vertical illuminance and CCT is not always sufficient. An observer in a room can receive light either from the luminaires at the ceiling, from the window, or from both light sources. The vertical illuminance could have the same value in all cases, even though the origin of the light is very different. The (light emitting diode, LED) luminaire can be set to have a CCT matching the CCT of daylight, but their SPDs still differ significantly. The high variability in results suggests that other variables affect the alerting effect of light. It seems to be necessary to consider other parameters to reduce the inconclusiveness within these studies. An accurate characterization of a lighting situation should include spatially and spectrally resolved measurements.
Fig. 1. Position and spectral power distributions of different light sources within the field of view.
1.1. Spectrally Resolved Measurements
The review of Souman et al. (Citation2018) considered studies on one specific non-image-forming (NIFFootnote1) effect: acute alertness. It revealed a number of studies finding no or negative results on alertness while using higher CCTs or increasing the shorter wavelength part in the SPD. Research shows that other NIF responses at night, such as melatonin suppression and phase shifting, have a distinct spectral sensitivity, and melanopsin-containing intrinsically photosensitive retinal ganglion cells (ipRGCs) are known to play a role in these responses. Because of the effect of light with higher CCTs in experiments on some NIF effects, it is often assumed that ipRGCs are solely responsible for these effects. Thus, the spectral sensitivity function of ipRGC is used to calculate the “melanopic factor amel” (DIN Citation2015), “equivalent melanopic illuminance” (Lucas et al. Citation2014), or “melanopic irradiance” (CIE Citation2015) from SPDs or to measure these quantities with a special filtered radiometer. These values are currently used to represent how NIF-effective a light source or a lighting solution is and for daytime studies. Lighting solutions with the same CCT and different SPDs will have different amel or melanopic illuminance (Knoche Citation2016); nonetheless, this representation is not adequate for all NIF effects. A recent review (Lucas et al. Citation2014) indicates that, in addition to ipRGCs, rods and cones can contribute to NIF effects, although it is still unclear how and to what extent. Therefore, it is advisable to measure the SPD of presented lighting conditions to allow the computation of the effective irradiances for all five photoreceptor types (rods, cones, ipRGCs) for the application of any future spectral weighting function.
1.2. Spatially Resolved Measurements
Current measurement approaches do not consider any spatial light distributions. Studies often lack an adequate description of the lighting conditions and only define the position of the luminaires and the windows in the room. The scientific basis is very small, but literature on melatonin suppression or phase shifts shows that the incident angle of light matters. Inferior retinal light exposure seems to induce a greater melatonin suppression than superior exposure (Glickman et al. Citation2003; Lasko et al. Citation1999; Smith et al. Citation2002), and light illuminating the nasal side of the retina is said to be more effective than light falling on the temporal side (Rüger et al. Citation2005; Visser et al. Citation1999). It seems that ipRGCs are unequally distributed throughout the retina (Hannibal et al. Citation2017). In addition, cones and rods, each located in different areas of the retina, are thought to influence NIF effects (Lucas et al. Citation2014). Consequently, the distribution, in addition to spectral sensitivity, of more than one receptor type should possibly be taken into account. Furthermore, binocular light exposure realizes a higher melatonin suppression than monocular light exposure (Brainard et al. Citation1997; Wang et al. Citation1998). Because only a few studies specifically considered light from defined directions, inclusion of this parameter in future laboratory studies is essential to obtain more insight into the retinal sensitivity and its relevance for NIF effects.
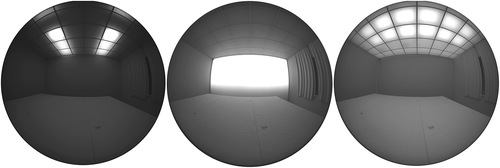
The need for spatially resolved measurements is further illustrated by Broszio et al. (Citation2017). In their study, an analysis of lighting conditions was conducted in an LED backlit test room with typical cell-office dimensions (5 m wide, 4 m long, and 2.8 m high) at the Chair of Lighting Technology of Technische Universität Berlin. The walls and ceiling of this test room with individually addressable cool white (5900 K) and warm white LED panels (2800 K) are covered by a diffusing material. Twelve additional luminaires are installed in the center of the ceiling. These luminaires are equipped with 2000 K and 4000 K LEDs, as well as narrow band blue LEDs with a peak wavelength at 470 nm–480 nm to improve the specific stimulation of ipRGCs. White light with a CCT ranging between 2000 K and 20,000 K can be realized, with acceptable color rendering (Color Rendering Index > 70) up to 8500 K. With this installation, it is possible to set specific luminance and CCT distributions for separate fields of the walls and ceiling while maintaining the same vertical illuminance and melanopic irradiance at eye level (). The study confirmed that lighting conditions with the same vertical illuminance as well as the same melanopic irradiance at eye level (example settings in ) could, for example, result in very different ipRGC effective irradiance if a nonuniformity of ipRGC distribution and sensitivity is considered.
Fig. 2. Three lighting settings that differ in luminance distribution and spectral power distribution but are comparable in terms of vertical illuminance (500 lx–502 lx), melanopic equivalent illuminance (372–390 melanopic equivalent lux), and melanopic irradiance (44.7–46.9 µW∙cm−2): (left) 2 × 1 ceiling luminaire: 6125 K, 2 × 2 ceiling tiles: 4500 K; (middle) upper wall: 5840 K; (right) 6 × 2 ceiling luminaires: 5420 K, remaining ceiling tiles: 4500 K.
Thus, integral parameters such as the illuminance and irradiance at the eye are not appropriate measures. Instead, it seems necessary to take into account the light incidence geometry for the measurement and representation of the light received at the eye in NIF studies, in addition to the level and spectral characteristics. Documentation of this information allows obtaining more insight into retinal sensitivity and its relevance for NIF effects; until now, only a few studies have explored this topic. Furthermore, it allows for the application of a future spatial weighting function.
This article looks into measurement approaches for and representation of spatially and spectrally resolved measurements. It specifically addresses the measurement and description of lighting conditions in NIF studies, but it must also be mentioned here that spatially and spectrally resolved measurements can be used in studies on other physiological and behavioral responses to ocular radiation, such as glare and brightness perception, modeling, or appraisal of light (Liedtke Citation2018). The ipRGCs may also play a role in visual responses to light exposure, the interconnections between the different photoreceptors need further study, and some responses seem to be mediated through both the visual and non-image-forming pathway (CIE Citation2016; Kort de and Veitch Citation2014; Lucas et al. Citation2014). Therefore, it seems of utmost importance to document lighting conditions in appropriate detail to obtain a better understanding of human response to ocular radiation in general.
2. Measurement characterization
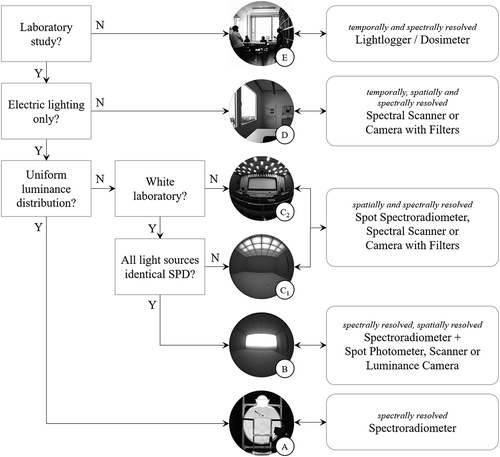
Studies on NIF effects can be divided into two main categories: laboratory and field studies. In laboratory studies, the effect of one or more independent variables under controlled conditions is studied. These studies are conducted, for example, to gain insight into the relevance of those variables in NIF processes, to develop theoretical models for NIF responses, and to define threshold values. Two or more lighting scenarios are compared that, for example, differ in light level, spectral distribution, or luminance distribution. Each lighting scenario needs to be documented separately. As stated in the Introduction, CIE (Citation2015) recommends characterizing a scenario with a spectrally resolved measurement, in order to allow the application of a future spectral weighting function. Whether the documentation of a scenario needs further detailing depends on the lighting condition, the experimental setting, and the research question. In principle, the majority of laboratory scenarios can be assigned to four categories ( to ); field scenarios () need to be discussed separately.
Spectrally resolved (one measurement). The lighting scenario has a completely uniform luminance distribution, with homogeneous color (one SPD) ( in ). This lighting scenario is typically realized in an integrating sphere. The lighting condition does not require a spatially resolved measurement due to its uniform photometric and radiometric distribution. A spectrally resolved measurement by means of a spectroradiometer suffices.
Spectrally resolved, spatially resolved (two independent measurements). In a white laboratory with light sources with identical SPDs, it can be assumed that the spectral characteristics are independent of direction ( in ). Thus, the spectrally resolved measurement can be reduced to a spatially integral measurement, allowing the use of a spectroradiometer for this purpose. The lighting scenario has a nonuniform spatial light distribution, which needs to be captured for analysis with a future spatial weighting function. The documentation of the spatial light distribution can be realized with a separate, spectrally integral, spatially resolved measurement.
Spatially and spectrally resolved (combined in one measurement). In experimental setups with light sources with different SPDs ( in ) and/or with various spectral surface reflections ( in ), light from different directions can have different spectral characteristics. In this case, the lighting scenarios need to be documented with spatially resolved measurements that are spectrally resolved at the same time.
Temporally, spatially, and spectrally resolved (combined in one measurement). For laboratory studies with daylight ( in ), which is a spatially, spectrally, and temporally dynamic light source, measurements must be carried out in short time frames. The lighting scenarios, with or without electric lighting, need to be documented throughout the experiment. Thus, the spatially and spectrally resolved measurements also need to be conducted with a temporal resolution.
Fig. 3. Experimental setups, representative of five categories of lighting scenarios in various experimental conditions: categories A–D for laboratory studies and category E for field studies.
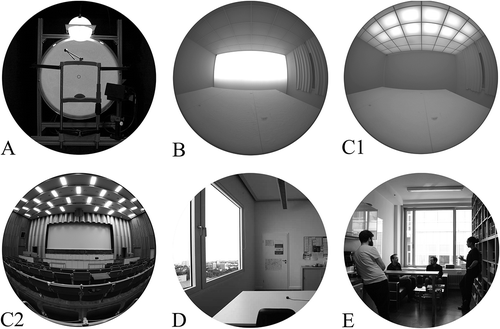
In field studies (category , temporally and spectrally resolved) the effect of prevailing lighting conditions on physiological and behavioral responses in an application representative environment is to be evaluated. These studies are used, for example, to test the applicability of specifically designed electric lighting solutions or to define the light dose received under natural circumstances or in representative living conditions. Participants are not designated to stay in one area and are not asked to hold fixed viewing angles. Daylight is typically not excluded from these studies. Thus, the variability in light level, spectral composition, and spatial light distribution due to individual, surrounding, and temporal factors is high. The main aim is to define integral values for practical application. Due to the varying position and viewing direction of participants in field studies, it is preferred to work with person-bound devices, and a spatial resolution of measurements is impractical. Because the variability in lighting conditions is high, temporally resolved measurements are required; these can be spectrally resolved measurements, as recommended by CIE (Citation2015). Light loggers and dosimeters can serve this purpose. Considerations with respect to performance characterization addressing spectral and spatial response and dynamic range, as well as calibration and deployment of these devices, are discussed in Price et al. (Citation2012), Figueiro et al. (Citation2013), and Markvart et al. (Citation2015).
Only categories B, C, and D need spatially resolved measurements, which are either spectrally integral (B) or spectrally resolved (C and D) measurements. These approaches will be discussed in more detail in Section 3.
3. Spatially resolved data
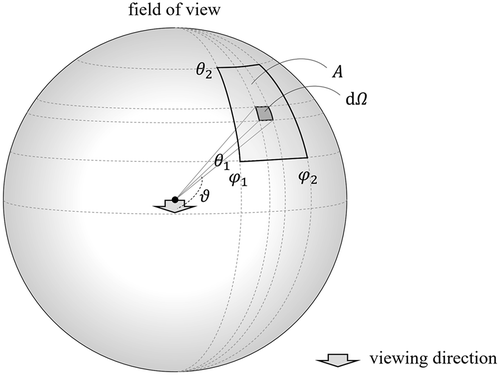
In order to describe lighting conditions spatially resolved and to quantify light from a specific direction, Liedtke et al. (Citation2013) proposed the concept of light incidence . It is defined by the incident luminous flux from a particular direction per unit solid angle (1):
Light incidence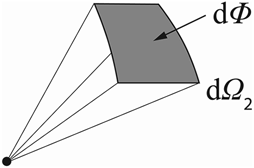
where is the light incidence (lm∙sr−1),
is the incident luminous flux (lm), and
is the solid angle (apex at the receiver) limiting the luminous flux incidence (sr).
Using this principle in radiometric terms means describing the incident spectral flux or incident radiant flux within a specific solid angle. This (spectral) radiant incidence can be weighted with various spectral sensitivity functions, which is the base for all methods addressed in this article. As soon as relevant retinal regions and their respective spectral sensitivity weightings are known, one could work with simplified sensors using a small number of spectroradiometers as, for example, presented by Khademagha et al. (Citation2018) with predefined solid angles as already proposed for other purposes by Van Derlofske et al. (Citation2000, Citation2002). Nonetheless, the number of studies is as yet too small to define areas with different ipRGC sensitivities; in particular, daytime responses are largely unknown. Therefore, it is proposed to scan the field of view of an observer (in a single hemisphere, with its zenith in the viewing direction) and measure the incoming luminous flux or (spectral) radiant flux within a fixed solid angle at predefined points in high angular resolution.
Building on this approach, scanners can be used to directly measure light incidence, radiant incidence, or spectral radiant incidence. Alternatively, luminance cameras with fisheye lenses can be used to derive the light incidence, their measurements being, in principle, measurements of photometric-weighted radiant flux for each pixel, and pixels can be grouped within predefined solid angles. Scanners and cameras differ in a number of characteristics:
Spatial resolution. A scanner will have a fixed solid angle per scan, which allows a direct representation of light incidence or (spectral) radiant incidence. Because an overlap of scanned areas is avoided, a scanner will not cover the complete hemisphere. A camera with a fisheye lens will (almost) cover the entire field of view. Due to the pixel resolution, a camera offers free formation of areas, also in a retrospective assessment. At present, cameras provide a higher degree of freedom in spatial resolution.
Spectral resolution. To address different spectral sensitivities, cameras are typically equipped with filters; scanners can be equipped with filters but also with spectroradiometers. Thus, cameras can provide single values (for example, luminance, radiance) or sets of values (for example, RGB [red, green, blue]), whereas scanners could also provide spectrally resolved information (for example, spectral irradiance or spectral radiant flux). At present, scanners provide better spectral resolution.
Scan time. Cameras offer measurement values for all pixels in one single capture; scanners use subsequent measurements. This is not a restriction when static lighting conditions are considered. Nonetheless, when dynamic light sources are included, scan time needs to be appropriate. Under daylighting conditions, CIE (Citation1994) recommends a complete scan of a scenario within 2.5 min.
Ease of use, costs, mobility, and accuracy can be additional criteria to consider in the measuring equipment selection process.
Hyperspectral imaging technology, used to interpolate and reconstruct spectral data by using several filters, could be an option in the future but will not be considered here. Currently this technology does not provide full spectral resolution, nor does it apply specifically designed filters that address photoreceptor sensitivity. Spot spectral radiance measurements or spot luminance measurements (as described in CIE (Citation2014), section 4.4.2.1) are also not considered in detail in this article. The typical small opening angle would require a high number of measurements to obtain appropriate coverage of the field of view, thus providing a cost-effective but very time-consuming alternative for scanner and camera measurements.
At the Technische Universität Berlin, four measurement approaches are currently being tested: two focusing on spectrally integral, spatially resolved measurements and the two others focusing on spatially and spectrally resolved measurements. They are presented here as examples to show the different measuring methodologies.
3.1. Spatially Resolved Measurements
For experiments in which the spectrally resolved and spatially resolved measurements can be performed separately (category B, ), any luminance camera or scanner with a photometer or radiometer can be used to document the spatial distribution of lighting conditions, allowing future reconstruction once relevant retinal areas are identified.
At the Technische Universität Berlin, a spatial laboratory measurement device was created in order to analyze spatial light distributions (). It operates as a scanner (, right) and makes it possible to measure the light incidence from an arbitrary direction to the point in question. It consists of a digital photometer mounted on a tripod with two axes of rotation being controlled by stepping motors (, left). One can adjust the direction of the photometer to any azimuth and elevation angle desired in the range of the vertical hemisphere; for example, in the viewing direction of an observer position. Further, the aperture of the photometer is limited to a fixed solid angle of choice by a tube in order to measure the incident luminous flux independent of adjacent values. Positive experience has been gathered following a spatial sampling pattern strategy based on Tregenza (Citation1987), which was adjusted in direction and symmetry (, middle), although any other pattern could be applied easily.
Fig. 4. (Left) Measurement device in a black laboratory, (middle) hemispherical sampling pattern with an opening angle of 14° per direction, and (right) principle of scanning in the vertical plane of a room.
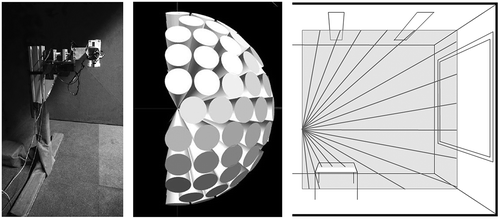
The hemisphere measuring procedure involves a stepwise scan of the desired directions. All information is continuously written to a text file. Due to the slow speed of the stepwise measurement of all directions, conducting a complete scan is currently a time-consuming procedure. Therefore, this device can only be used under static light conditions. The prototype scanner with the applied illuminance meter is cost effective. This measuring device is suitable for measurement of lighting conditions in NIF research with respect to the effect of lighting solutions differing in spatial light distribution. It can also be used for the documentation of spatial distribution of lighting conditions in studies investigating light level or spectral characteristics of light, to allow further analysis of the experimental results once sensitivities of retinal areas are known. At present, this scanner cannot be used in experimental setups with mixed SPDs (categories C and D). Nonetheless, the currently implemented illuminance meter could easily be replaced with a spectroradiometer or radiometer with different filters to fulfill this requirement.
In addition to the prototype scanner, a specially designed LMK 5 color luminance camera (TechnoTeam Bildverarbeitungs GmbH) was used in several lab studies. The camera is equipped with an object lens (circular fisheye lens) covering a 180° angle and a filter wheel with photometric filters (V(λ) and V'(λ)), colorimetric filters (X(λ) and Z(λ)), and a melanopic filter (Nz(λ), according to Lucas et al. (Citation2014)). The fisheye luminance camera is oriented on a tripod in the room to correspond to the observer’s eye position and direction of gaze (). The resulting luminance image equals a matrix of luminance values. Each pixel covers a unique area, representing a specific solid angle of the hemisphere. Together, the pixels describe a complete, continuous, hemisphere. Software is used to implement any spatial pattern with any chosen solid angle size and form (cf. subsection 5.2).
Fig. 5. (Left and middle) Measurement device and (right) principle of capturing a room in a complete hemisphere (cf. ).
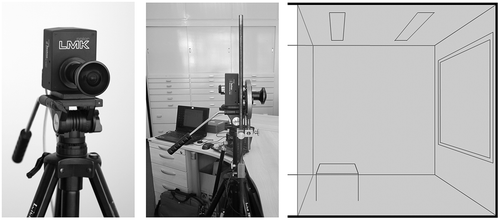
The melanopic filter allows an analysis of a lighting scene considering the spectral sensitivity of ipRGCs. The device provides measures of the melanopic-weighted radiant incidence. However, the camera cannot be used in experimental setups in categories C and D due to the lack of the spectral sensitivity weighting for other photoreceptor types.
3.2. Spatially and Spectrally Resolved Data
Detailed spectral information is fundamental for understanding human responses to light. To allow the subsequent incorporation of future spatial and spectral weighting function(s) for NIF responses and relevant retinal areas, two novel colorimetric measuring methods are currently being considered at the Technische Universität Berlin.
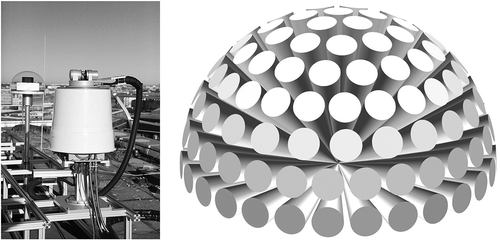
First of all, a further development of the previously mentioned LMK 5 color luminance camera is being worked on, focusing on the replacement of the filters. New filters adapted to the five photoreceptor types of the human retina could bring important insights and the images would allow straightforward selection and weighting of specific retinal regions. This method is particularly suitable for mobile applications. Very short measurement times for one hemisphere would enable the measurement of daylight situations. However, at present, a full spectrum measurement offering higher flexibility in spectral analysis only seems to be feasible with a spectral scanner. The scanner presented in Section 3.1 can be equipped with a spectroradiometer, fulfilling the requirements for category C experiments. Nonetheless, the combination of electric lighting with a spatially and temporally dynamic light source such as daylight increases the demands on the scanning system, so that several spectral irradiance measurements must be carried out in short time frames. According to CIE (Citation1994), due to the variability in prevailing sky conditions, a complete measurement scan of a scenario should not take longer than 2.5 min. A detailed review of existing approaches and requirements for measuring systems to conduct temporally, spatially, and spectrally resolved daylight measurements was conducted before setting up a spectral sky scanner in October 2014 at Technische Universität Berlin () (Knoop Citation2014). With this spectral sky scanner, a complete spectral sky scan of 145 sky patches according to Tregenza (Citation1987) and CIE (Citation1994) can be completed within 1 min. Experience obtained with this spectral sky scanner will lead to the development of a spectral room scanner. It could be realized similarly but would need some adaptations; for example, in the alignment of viewing direction to the measuring system described in Subsection 3.1, which scans the field of view of an observer in a single hemisphere with its zenith in the viewing direction.
Fig. 6. (Left) Spectral sky scanner and (right) scanning pattern with opening angle of 10°.
4. Measurement approach decision scheme
Prototype scanners and state-of-the-art luminance cameras seem to be suitable to obtain spatially resolved measurements. With these data, one can properly describe the lighting conditions in NIF studies investigating the effect of lighting solutions differing in light level, SPD, and spatial light distribution, as long as the SPD of all light sources in one scenario is kept identical (category B, ). It is advisable to document the spatial light distribution with these or similar measurements tools such as luminance meters (spot photometers). This allows for a spatial reconstruction and definition of the resulting NIF effective irradiance, once sensitivities of retinal areas and the roles of other photoreceptor types are known. For other laboratory studies (categories C and D, ), new measuring equipment needs to be developed, focusing on spectrally and spatially resolved measurements, which are preferably conducted with a scanner or an appropriately filtered camera. A cost-effective but time-consuming alternative for scanners and cameras is a spectroradiometer, used for multiple spot measurements of spectral radiance, which can be used in laboratory studies without daylight (category C). The decision-making process for appropriate measuring equipment can be supported by . It should be noted that the availability of measuring equipment might restrict the scope of research, and a specific research question might require an explicit measuring tool. If a high resolution of spatial measurements is not feasible, spectral measurements of areas of interest should be included, considering luminance contrast and spectral surface reflectances within the scenario. Once sensitivities of retinal areas are defined, this information allows for a decision to include or exclude the research in a cross-experimental analysis.
Fig. 7. Decision scheme to select devices to measure lighting scenarios to quantify all relevant lighting parameters in NIF studies (each scenario offered to the participants is considered separately).
5. Visualization and analysis of measurements
Measurements of light incidence and spatially resolved spectral measurements require a new format for data collection and representation. Assuming a subdivision of hemisphere according or comparable to Tregenza (Citation1987) and CIE (Citation1994), 145 integral or spectral measurements per setting or time frame should be captured and represented. This spatial resolution can vary as required, but the regarded solid angles should not overlap. The measurements can be stored in matrices, but the representation is also of importance for evaluation and visualization purposes.
5.1. Representation of Spatial Distribution of Light
New types of diagrams, called incidence solids and directograms, are proposed for the graphical representation of spatially resolved data. These diagrams contain information on measurements in two opposite hemispheres to represent the incident light of the entire lighting scene.
An incidence solid (, left) represents the spatial distribution of incident luminous or radiant flux at a point in question; for example, the position of an object or the human eye. The length of each line is proportional to the measured value. For solids with a large number of lines due to a high spatial resolution of the sampling pattern, it is convenient to limit the representation to specific planes (, middle).
Fig. 8. (Left) Incidence solid, (middle) plane of an incidence solid, and (right) directogram.
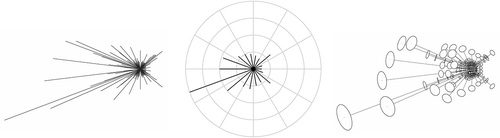
A directogram (, right) also shows the spatial distribution of incident luminous or radiant flux with the viewing point located centrally. It consists of circular discs connected to the observer position with a straight line. The disc size and line length are both indicators of the quantity of the regarded unit. The tilted disc surfaces of the directogram and their position relative to one another offer a better spatial (depth) perception than the incidence solid representation. The disc color can also be used as a fifth dimension—next to the three spatial dimensions and the disc size—to indicate an additional unit; for example, the considered quantity or CCT in false colors.
It might be possible to characterize and evaluate a straightforward luminance distribution in a white laboratory situation with existing protocols for describing lighting. However, in surroundings that are more complex with respect to spectral reflection or in situations in which light sources with different SPDs are applied, the incidence solids or directograms give additional information about the lighting conditions in NIF experiments. Directograms give a good impression of the direction of the light, and planes of the incidence solids are suitable for scientific representation of lighting conditions. Examples of representation of the spatial distribution of light for the scenario presented in is given in .
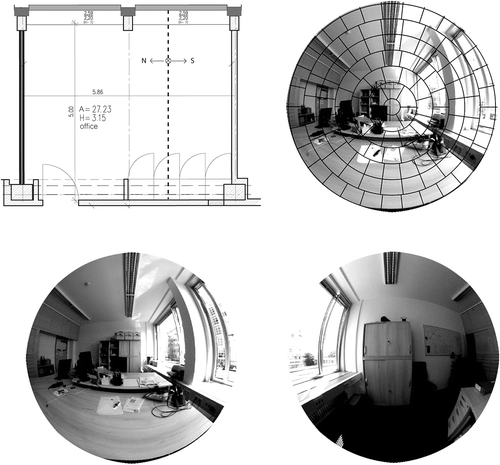
Fig. 9. Scenario: (Top left) Setup with floor plan, (bottom) two fisheye pictures of opposite hemispheres, and (top right) subdivision of one hemisphere.
5.2. Analysis for NIF Effects
Incidence solids, planes of incidence solids, or directograms are very suitable to present the lighting conditions in NIF experiments (). They enable the evaluation of the effect of higher NIF sensitivity for nasal, inferior, as well as binocular light exposure in different lighting solutions.
Fig. 10. Representation of lighting conditions in : (Top left, top right, and bottom left) Planes of the incidence solid, where each line shows the amount of the incident luminous or radiant flux within a fixed solid angle in a certain direction, and (bottom right) directogram as the extension of the incidence solid.
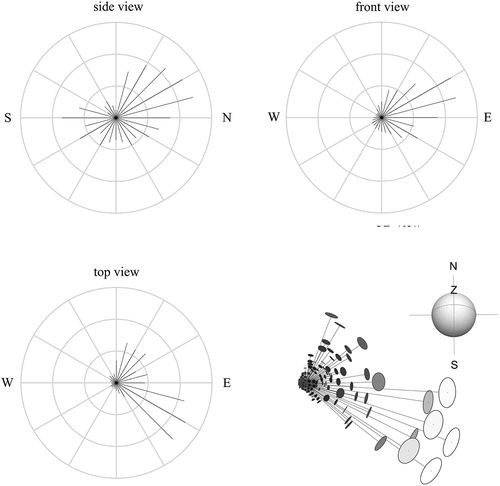
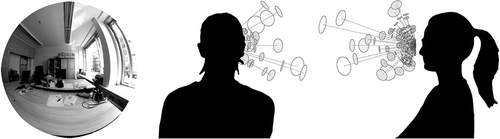
Fig. 11. Directograms for lighting conditions at the observer’s eye level: (Left) Fisheye image of lighting condition in the viewing direction; (middle) representation in the viewing direction; and (right) representation seen from the side, perpendicular to the viewing direction.
The proposed representation can incorporate factors to emphasize, reduce, or discard the effect of light coming from specific regions of the hemisphere, allowing retrospective analysis with respect to retinal sensitivity related to NIF effects during daytime and nighttime. Information about spatial distribution of light will then also provide information about the effectiveness of light reaching the eye. At this moment, the spectral radiant incidence could, for example, be weighted with the spectral efficiency functions of each photoreceptor type (CIE Citation2015).Footnote2
If required, this incidence of luminous or radiant flux can be used to define the NIF effective irradiance. When properly calibrated and combined with fundamentals (2), (3), and (4), a camera image provides information about the contribution of a relevant area within the field of view to the overall illuminance or α-opic irradianceFootnote2 on a plane (Broszio et al. Citation2017).
For nonspectrally resolved measurements (category B scenarios):
where is the vertical illuminance contribution from a considered area
within the field of view at the observer’s eye level (lx), where area
is defined by inclination
and
and azimuth
and
;
is the luminance of an area contained within solid angle
, whose position in the field of view is determined by
(cd∙m−2);
is the solid angle (apex at the receiver/eye; sr); and ϑ is the angle between the direction of the solid angle and the viewing direction (normal to the vertical surface) (rad).
For spectrally resolved measurements (categories C and D scenarios):
where is the vertical spectral irradiance contribution from a considered area
within the field of view at the observer’s eye level (W∙m−2∙nm−1);
is the spectral radiance of an area contained within solid angle
, whose position in the field of view is determined by
(W∙m−2∙sr−1∙nm−1); and
where is the vertical α-opic irradiance contribution from a considered area
within the field of view at the observer’s eye level (W∙m−2) and
is the α-opic action spectrum, where the prefix α indicates the photoreceptor response (CIE Citation2015).
The solid angle can be the one applied by the scanner or a single pixel or a group of pixels of the camera image. It is of special interest that results can contain an illuminance contribution value or α-opic irradiance contribution value in a matrix for each pixel of a fisheye picture. Hence, free grouping of pixels according to the identified areas in the observer’s field of view is possible. When the contributions in each region are added together and set in relation to the integral vertical illuminance or integral α-opic irradiance at the eye, it provides information about the NIF effective irradiance. A detailed description of this methodology is given in Broszio et al. (Citation2017); the principle is described below.
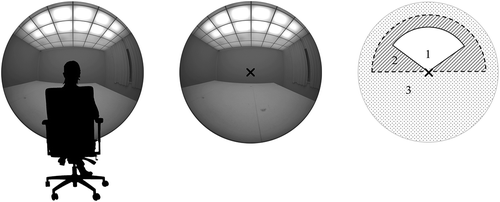
Assuming different areas of sensitivity—represented hypothetically in —lighting conditions can be evaluated and compared with respect to their potential to realize effective NIF irradiance. Light coming from region 1 illuminates the lower part of both retinas and is said to be effective in inducing NIF effects with melanopic spectral sensitivity. Light from region 2 illuminates the nasal part of the left eye or the right eye, as well as the retinal areas that are supposed to have an NIF effect. Region 3 is said to have no effect (Fördergemeinschaft Gutes Licht Citation2014). Thus, when specifically looking into effective ipRGC irradiance, the melanopic-weighted radiant incidence from different areas should be considered (). For demonstration purposes, this analysis is also performed for vertical illuminance.
Table 1. Application of theoretical approach to determine effective ipRGC irradiances for a selection of lighting conditions
Fig. 12. Hypothetical areas of interest within the field of view, related to presumed ipRGC distribution and sensitivity (for demonstration purposes only).
Setting weighting factors for specific retinal areas is again feasible in the abovementioned approach. Even though camera measurements are most favorable for this analysis, scanner measurements can also be used to reconstruct effective irradiance, though they do not provide full coverage of the hemisphere. This approach can be used with a coverage correction factor, provided that the luminance distribution is noncomplex and does not have harsh luminance contrasts.
6. Discussion and conclusions
This article presents approaches to measure and document lighting conditions with a representation that accounts for the origin and spectral composition of light received at the eye. The three-dimensional concept of light incidence, or spectral radiant incidence, allows for a direction-dependent and spectrally selective weighting of the light. This should be considered in the assessment and study of NIF effects, because the role of each photoreceptor type, the relevance of specific retinal regions, and their respective sensitivity weighting is not well understood.
Integral measures, such as vertical illuminances and irradiances at eye level, are only adequate for experiments conducted in an integrating sphere, where the luminance distribution is uniform. For all laboratory experiments studying the effect of light level, SPD, or spatial light distribution on NIF effects, we advise using a laboratory with spectrally neutral surface reflectances and light sources with identical SPDs (within one scenario), while recording the spatial light distribution with a luminance camera or a scanner for future analysis. Lighting conditions in laboratory experiments with different SPDs or variation in spectral surface reflectance can be described with a spot spectroradiometer. Considering measuring time, these lighting conditions, as well as those in laboratory experiments with inclusion of daylight, are preferably described with appropriately filtered luminance cameras or spectral scanners. Nonetheless, these types of custom-made devices are scarce and expensive. Therefore, we recommend including spectral spot measurements of areas of interest within the scenario and excluding daylight from the scenario. Though a retrospective detailed analysis of the research data might not be possible, these measurements will indicate whether the research can be combined with other research to draw cross-experimental conclusions, once sensitivities of retinal areas are defined. Light loggers and dosimeters are recommended for field studies due to their practicality.
The proposed measurement approaches, decision scheme, as well as analysis and representation of data are also suitable for other research related to human responses to ocular radiation. Still, it should be noted that the spatial and spectral characteristics are not the only additional variables that need to be recorded. Investigating physiological and behavioral effects of ocular radiation is a complex research topic that requires a detailed consideration and documentation of all possible influencing variables. In the case of NIF effects, these could be, for example, timing and duration of exposure, light history, and chronotype. We would like to propose, as also suggested, for example, by Aarts and others (Citation2016), drawing up a guide, in line with or as an addition to the Guide to Protocols for Describing Lighting (CIE Citation2014), to align documentation of experimental conditions on an international level. In this document, the broader application of spatially and spectrally resolved measurements for studies on other physiological and behavioral responses to ocular radiation, such as glare and brightness perception, modeling, or appraisal of light, could also be addressed.
Though simulation would be a powerful approach to reconstruct lighting conditions and to derive information on light incidence or spectral radiant flux per solid angle, these parameters are not easily simulated in existing tools. In addition, spectral simulation does not yet conveniently offer the detail required to allow for adoption of different spectral weighting functions in the future. However, it is expected that lighting software can be developed to allow for this, and available spatially and spectrally resolved measurements will support the verification of these tools.
Acknowledgments
The authors thank TechnoTeam for the provision of the LMK luminance camera, Florian Heptner for his support in the development of the room scanner, and Karsten Schmidt for his support in the representation of the scanning patterns. Furthermore, the authors thank the guest editor, Dr. Jennifer Veitch, and the anonymous reviewers for their valuable feedback.
Disclosure statement
The authors report no declarations of interest.
Additional information
Funding
Notes
1. In this context, the non-image-forming effects relate to eye-mediated, biological responses to light influenced by ipRGCs. These are circadian and acute effects, such as melatonin suppression, phase shift, increased heart rate, alertness, or sleep quality.
2. Spectral efficiency function of the photoreceptor types, where prefix α reflects the photoreceptor type: sc for s-cone, mc for m-cone, lc for l-cone, z for ipRGC, r for rod. Weighting of irradiance results in cyanopic irradiance (Ee,sc), chloropic irradiance (Ee,mc), erythropic irradiance (Ee,lc), melanopic irradiance (Ee,z), and rhodopic irradiance (Ee,r), respectively (CIE Citation2015).
References
- Aarts MP, Aries MB, Diakoumis A, van Hoof J. 2016. Shedding a light on phototherapy studies with people having dementia: a critical review of the methodology from a light perspective. Am J Alzheimers Dis Other Demen [Internet]. 31(7):551–163. [accessed 2018 May 12]. doi:10.1177/1533317515628046.
- Brainard GC, Rollag MD, Hanifin JP. 1997. Photic regulation of melatonin in humans: ocular and neural signal transduction. J Biol Rhythm [Internet]. 12(6):537–146. accessed 2018 Jan 13]. http://journals.sagepub.com/doi/pdf/10.1177/074873049701200608.
- Broszio K, Knoop M, Niedling M, Völker S. 2017. Effective radiant flux for non-image forming effects – is the illuminance and the melanopic irradiance at the eye really the right measure? In: Kobav MB, editor. Lighting for modern society. Proceedings of the lux Europa 2017. European lighting conference; 2017 September 18-20. Ljubljana, Slovenia. (Slovenia. Ljubljana): Lighting Engineering Society of Slovenia. p. 31–36. [accessed 2018 Jan 8]. http://www.sdr.si/pdf/le2017_proceedings.pdf.
- [CIE] Commission International de l’Éclairage. 1994. Guide to recommended practice of daylight measurement. Vienna (Austria): CIE. Publication No: CIE TR 108–1994.
- [CIE] Commission International de l’Éclairage. 2014. Guide to protocols for describing lighting. Vienna (Austria): CIE. Publication No: CIE 213:2014.
- [CIE] Commission International de l’Éclairage. 2015. Report on the first international workshop on circadian and neurophysiological photometry, 2013. Vienna (Austria): CIE.Publication No: CIE TN 003:2015.
- [CIE] Commission International de l’Éclairage. 2016. Research roadmap for healthful interior lighting applications. Vienna (Austria): CIE. Publication No: CIE 218:2016.
- [DIN] Deutsches Institut für Normung e.V. 2015. Strahlungsphysik im optischen Bereich und Lichttechnik - Teil 100: Über das Auge vermittelte, melanopische Wirkung des Lichts auf den Menschen - Größen, Formelzeichen und Wirkungsspektren. Berlin (Germany): Beuth. Publication No: DIN SPEC 5031-100: 2015-08.
- [FGL] Fördergemeinschaft Gutes Licht. [Internet]. 2014. Wirkung des Lichts auf den Menschen. Frankfurt am Main: licht.de. Report No. 19. [updated 2014 March; accessed 2018 Jan 8]. https://www.licht.de/fileadmin/Publikationen_Downloads/1403_lw19_Wirkung_auf_Mensch_web.pdf.
- Figueiro MG, Hamner R, Bierman A, Rea MS. 2013. Comparisons of three practical field devices used to measure personal light exposures and activity levels. Lighting Res Technol [Internet]. 45(4):421–434. [accessed 2018 Aug 2]. doi:10.1177/1477153512450453.
- Glickman G, Hanifin JP, Rollag MD, Wang J, Cooper H, Brainard GC. 2003. Inferior retinal light exposure is more effective than superior retinal exposure in suppressing melatonin in humans. J Biol Rhythm [Internet]. 18(1):71–79. [accessed 2018 Jan 13]. http://journals.sagepub.com/doi/pdf/10.1177/0748730402239678.
- Hannibal J, Christiansen AT, Heegaard S, Fahrenkrug J, Kiilgaard JF. 2017. Melanopsin expressing human retinal ganglion cells: subtypes, distribution, and intraretinal connectivity. J Comp Neurol [Internet]. 525(8):1934–1961. [accessed2018 Jan 13]. doi:10.1002/cne.24181.
- Khademagha P, Aries MBC, Rosemann ALP, van Loenen EJ. 2018. A multidirectional spectral measurement method and instrument to investigate non-image-forming effects of light. Meas Sci Technol [Internet]. 29(8):085902. [accessed 2018 Aug 6]. doi:10.1088/1361-6501/aac937.
- Knoche S. 2016. Optimierte Spektren für human centric lighting - Theoretische Grenzen. Licht 2016 Tagungsband - Proceedings; 2016 September 25-28, Karlsruhe, Germany; Karlsruhe (Germany): KIT Scientific Publishing. p. 155–162. [accessed 2018 Jan 16]. doi:10.5445/KSP/1000057817.
- Knoop M. 2014. Analysis of spatially resolved measurement approaches to assess spectral characteristics of sky patches. In: CIE x039:2014. Proceedings of CIE 2014 - Lighting Quality & Energy Efficiency; 2014 April 23-26; Kuala Lumpur, Malaysia. Vienna: CIE. p. 130–139.
- Kort de Y, Veitch JA. 2014. From blind spot into the spotlight: introduction to the special issue ‘light, lighting, and human behaviour’. J Environ Psychol [Internet]. 39:1–4. [accessed 2018 May 12]. doi:10.1016/j.jenvp.2014.06.005.
- Lasko TA, Kripke DF, Elliot JA. 1999. Melatonin suppression by illumination of upper and lower visual fields. J Biol Rhythms [Internet]. 14(2):122–125. [accessed 2018 Jan 13]. http://journals.sagepub.com/doi/pdf/10.1177/074873099129000506.
- Liedtke C. 2018. Quantifizierung der räumlichen Lichtverteilung [dissertation]. Berlin (Germany): Technische Universität Berlin. Unpublished dissertation.
- Liedtke C, Völker S, Knoop M. 2013. The light direction and directional light—towards a new quantification of an essential lighting quality criterion. In: CIE x038:2013. Towards a new century of light. Proceedings of the CIE centenary conference; 2013 April 15-16; Paris, France. Vienna, (Austria): CIE. p. 542–551. doi:10.1177/1753193412469126.
- Lucas RJ, Peirson SN, Berson DM, Brown TM, Cooper HM, Czeisler CA, Figueiro MG, Gamlin PD, Lockley SW, O’Hagan JB, et al. 2014. Measuring and using light in the melanopsin age. Trends Neurosci [Internet]. 37(1):1–9. [accessed 2018 Jan 13]. doi:10.1016/j.tins.2013.10.004.
- Markvart J, Hansen ÅM, Christoffersen J. 2015. Comparison and correction of the light sensor output from 48 wearable light exposure devices by using a side-by-side field calibration method. LEUKOS [Internet]. 11(3):155–171. [accessed 2018 Aug 2]. doi:10.1080/15502724.2015.1020948.
- Price LLA, Khazova M, O’Hagan JB. 2012. Performance assessment of commercial circadian personal exposure devices. Lighting Res Technol [Internet]. 44(1):17–26. [accessed 2018 Aug 2]. doi:10.1177/1477153511433171.
- Rüger M, Gordijn MCM, Beersma DGM, de Vries B, Daan S. 2005. Nasal versus temporal illumination of the human retina: effects on core body temperature, melatonin, and circadian phase. J Biol Rhythm [Internet]. 20(1):60–70. [accessed 2018 Jan 13]. http://journals.sagepub.com/doi/pdf/10.1177/0748730404270539.
- Smith JS, Kripke DF, Elliott JA, Youngstedt SD. 2002. Illumination of upper and middle visual fields produces equivalent suppression of melatonin in older volunteers. Chronobiol Int [Internet]. 19(5):883–891. [accessed 2018 Jan 13]. doi:10.1081/CBI-120014107.
- Souman JL, Tinga AM, Te Pas SF, van Ee R, Vlaskamp BNS. 2018. Acute alerting effects of light: a systematic literature review. Behav Brain Res [Internet]. 337:228–239. [accessed 2018 Jan 13]. doi:10.1016/j.bbr.2017.09.016.
- Tregenza PR. 1987. Subdivision of the sky hemisphere for luminance measurements. Lighting Res Technol [Internet]. 19(1):13–14. [accessed 2018 Jan 13]. http://journals.sagepub.com/doi/pdf/10.1177/096032718701900103.
- Van Derlofske J, Bierman A, Rea MS, Ramanath J, Bullough JD. 2002. Design and optimization of a retinal flux density meter. Meas Sci Technol [Internet]. 13(6):821. [accessed 2018 Jan 13]. http://iopscience.iop.org/article/10.1088/0957-0233/13/6/301/pdf.
- Van Derlofske JF, Bierman A, Rea MS, Maliyagoda N. 2000. Design and optimization of a retinal exposure detector. In: international symposium on optical science and technology. Proceedings SPIE 4092. Novel optical systems design and optimization III; 2000 October 2; San Diego (CA). Bellingham (WA): SPIE. p. 60–70. [accessed 2018 Jan 8]. doi:10.1117/12.402413.
- Visser EK, Beersma DGM, Daan S. 1999. Melatonin suppression by light in humans is maximal when the nasal part of the retina is illuminated. J Biol Rhythms [Internet]. 14(2):116–121. [accessed 2018 Jan 13]. doi:10.1177/074873099129000498.
- Wang JY, Hanifin JP, Rollag MD, Brainard GC. 1998. Ocular regulation of the human pineal gland: the significance of total retinal exposure for melatonin suppression. In: Holick MF, Jung EG, editors. Biologic effects of light. Boston (MA): Springer US; p. 367–374.