
 ?Mathematical formulae have been encoded as MathML and are displayed in this HTML version using MathJax in order to improve their display. Uncheck the box to turn MathJax off. This feature requires Javascript. Click on a formula to zoom.
ABSTRACT
Dynamic lighting is one of the new trends in lighting research; providing the right lighting level at the right time could possibly increase the alertness and performance of office workers. However, they might have preferences that deviate from this “healthy” lighting. Simultaneously, the building environment becomes increasingly automated, with occupancy-based control as one of the most well-known examples to reduce offices’ lighting energy consumption. Nevertheless, preferences for lighting levels in the unoccupied area of the multi-occupant office space have not been addressed yet. Therefore, we studied luminance distribution preferences in relation to time of day and subjective alertness (SA) in a single occupancy scenario. Participants (N = 30) set the surrounding and background lighting six times a day as we first probed for SA. Our results clearly showed that a subset preferred varying luminance distributions; participants had fluctuating feelings of alertness, too. Preferences deviated sometimes from the typical dynamic lighting scenarios, suggesting that they do not always prefer healthy lighting. Moreover, we identified an effect of SA on the preferences, both with and without controlling for time of day. Hence, this study showed that we need to address these two factors when we want to provide satisfactory lighting conditions in case the office is not fully occupied. These are likely to affect other lighting preferences and therefore deserve more attention from research. Because we identified large individual differences, we suggest personalizing dynamic scenarios as the focus of future research.
1. Introduction
Lighting tends to be a fixed element of the work environment—luminaires are installed at the commissioning of a building and not moved or changed for the lifetime of that same building, except for the renewal of the light sources. Because it illuminates the space at a fixed intensity, lighting is considered purely functional—it enables indoor work activities when daylight conditions are insufficient. Over the last 30 years, research has shown that lighting comprehends much more than a functional aspect of the office space; it has an enormous impact on its occupants (e.g., Boyce Citation2014; Heerwagen Citation1990). It affects not only occupants' performance and satisfaction but also their mood and health (Van Duijnhoven et al. Citation2017; Veitch et al. Citation2008, Citation2013). Lighting technology has developed rapidly alongside these discoveries on the human factors side. The introduction of smart light emitting diode lighting makes it possible to provide different lighting doses over the course of the day—static lighting might soon belong to the past. This dynamic aspect means a large quality improvement in electric lighting and compromises one of the factors that makes daylight being typically desired over electric lighting (Galasiu and Veitch Citation2006). Most important, because smart lighting enables control over the amount and timing of the lighting variation, electric lighting can be further tailored to users’ needs and preferences.
This technological advancement initiated the development of dynamic scenarios that aim to support humans’ natural circadian rhythms. Recently, research discovered the ability of light to modulate the human biological clock through the “third” photoreceptor (intrinsically photosensitive retinal ganglion cells; Berson et al. Citation2002). Lighting has the ability to, among others, influence subjective alertness (SA) levels: higher illuminance levels result in higher feelings of vitality (e.g., Cajochen et al. Citation2000), even during daytime (Smolders et al. Citation2013; Zhu et al. Citation2017). Because users’ needs for a boost in alertness fluctuate, dynamic lighting scenarios provide different illuminance levels depending on the time of day as well as a varying correlated color temperature (CCT). It should be noted that the effectiveness of these scenarios has not been demonstrated yet; they might be aiming too high, because it is difficult to mimic daylight with artificial lighting due to its low irradiance and different spectrum. Nevertheless, preferences might deviate from these “healthy” doses. Earlier examples can be found of discrepancies between lighting needs and preferences; for example, though preferred desktop illuminances of 80 lux were detected (Newsham et al. Citation2005), the European norm recommends 500 lux (European Committee for Standardization Citation2011). Such a conflict would be alarming because we do not want to create a situation where occupants work in lighting conditions that dissatisfy them; this will be detrimental to their well-being (Veitch et al. Citation2008) and counteract the beneficial effect of the dynamic scenarios on occupants’ health.
The variation in lighting preferences over the day has received limited attention of research; we identified only three studies that touched upon this relationship for the preferred desktop illuminance. In a study by Begemann et al. (Citation1997), participants added more artificial light to the daylight level in the morning and afternoon compared to midday. Similarly, Newsham et al. (Citation2008) identified that, on average, participants chose an increasing desktop illuminance in the morning and a decreasing value in the afternoon. Chraibi et al. (Citation2016), however, revealed in a real office environment that occupants dimmed down the luminaires more often in the morning, whereas at the end of the day they dimmed them up. Clearly, their results do not agree; their different experimental designs are likely one cause; nevertheless, this indicates a need for research that clarifies these ambiguities.
In addition to these preference studies, research has investigated the acceptance of different illuminance levels over the course of the day. In a study by Borisuit et al. (Citation2015), participants reported worse visual acceptance when the vertical illuminance was increased at the beginning of the afternoon, whereas at 3 pm a decrease in illuminance resulted in higher comfort levels. Huiberts et al. (Citation2016) assessed the appraisal of three illuminance levels; participants rated the highest illuminance level as significantly less pleasant compared to two lower illuminance levels. Because these acceptance studies also show contrasting results for the influence of time of day, there is clearly a need for studies that address the role of this factor in lighting preferences. SA might underlie these dynamics, as also argued by Begemann et al. (Citation1997). van Duijnhoven et al. (Citation2018) found a relationship between SA and the preferred horizontal illuminance at the desk but only for a subset of users. Similarly, SA might explain only the variation in preferences of some users; hence, it is important to investigate these on an individual level. Therefore, this study aims to investigate the role of both time of day and SA in lighting preferences, in general and individually.
The studies described above all concentrated on preferences for desktop illuminance, except Newsham et al. (Citation2008), who analyzed luminance maps of the space as well but found no better predictor of participants’ dimming actions than the desktop illuminance. The authors were surprised by this finding: they suggested that it might be due to the limited range of possible luminances, which suggests that more studies are required to validate this finding. Lighting preferences might not be limited to the task area; it seems also relevant to provide comfortable levels in the remainder of the space, especially when the office space is not fully occupied. Nevertheless, research on occupancy-based lighting control tends to focus on energy efficiency (de Bakker et al. Citation2017). Occupancy-based lighting control is, together with daylight-linked control, the most well-established and applied strategy to diminish offices’ energy consumption; reported (potential) savings range from 20% to 60% (Chung and Burnett Citation2001; Galasiu et al. Citation2007; Von Neida et al. Citation2001). Therefore, it is particularly important to consider the preferences related to this strategy.
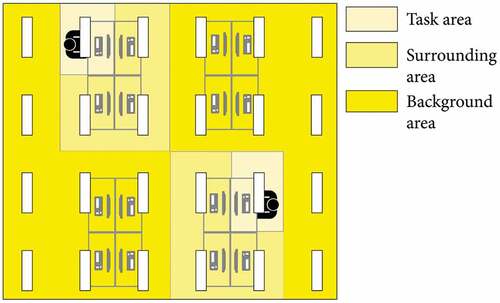
We developed a highly granular occupancy-based strategy that applies dimming instead of switching-off luminaires in the unoccupied areas of the office space (de Bakker et al. Citation2018). It distinguishes between a task, surrounding, and background area, as visualized in for an example office case. These areas comply with the minimum measures as recommended by the European lighting standard EN12464–1:2011, Light and Lighting—Lighting of Workplaces. Part 1: Indoor Work Places (European Committee for Standardization 2011), but are related to the architectural configuration of bullpen offices to enable the use of different output levels across the areas. A detailed explanation can be found in de Bakker et al. (Citation2018). This strategy, called “local lighting control,” thereby limits the nonuniformity in the office space, which is a first step in the right direction to maintain users’ comfort. When participants evaluated different combinations of dimming levels in the surrounding and background areas in a setting where daylight was absent, the majority (70%) considered seven of the eight combinations comfortable. Most interesting, the “task ≈ surrounding > background” luminance ratio was accepted by the highest number of participants, suggesting that occupants might prefer nonuniform distributions to uniform distributions. This finding should be validated in a setting with daylight but, if confirmed, is alarming because lighting designers aim for uniformity. Therefore, luminance distribution preferences deserve more attention from research. As explained by de Bakker et al. (Citation2018), studies on this topic are currently missing in bullpen offices. Addressing these preferences would not only provide more insight regarding how to satisfy office users but also increase the applicability of local lighting control.
Fig. 1. The concept of local lighting control in an example office space: different dimming levels in the task, surrounding, and background areas when individual absences occur
This study fills two main research gaps: (1) the influence of time of day and SA on lighting preferences and (2) preferences for luminance distributions. We aimed to answer the following four research questions: which luminance distributions, meaning values in and ratios between the three areas, office workers prefer over the day (q1); whether these preferences vary over the workday (q2); whether SA levels vary over the workday (q3); and whether SA explains the variation in luminance preferences, generally and/or individually (q4). The relationship between alertness and luminance preferences as investigated in this study is visualized in . Here it can be seen that q2 focuses on the differences between luminance preferences at different moments during the day (tn₋1 versus tn versus tn+1) and q3 addresses the variation in alertness levels between these moments. The effect of alertness on the luminance preferences is assessed by q4; it determines whether this effect differs between the various moments during the day (q4).
Fig. 2. Interplay of relationships between preferred luminance distributions and SA over time as studied in this research
We formulated hypotheses for each of the four research questions; shows the expected variations in preferred luminance values and SA levels (q2 and q3). First, we expected the preferred luminance values to be relatively high (q1); we used conventional office luminaires—that is, ceiling-based luminaires—which are designed to provide 500 lux at the desk at their maximum output. This value is recommended by the European lightings standard EN 12464-1, Light & Lighting—The Lighting of Workplaces. Moreover, we hypothesized that participants would prefer a uniform ratio or the ratio “task ≈ surrounding > background,” because this ratio was the most favored in an earlier study (de Bakker et al. Citation2018). Simultaneously, we expected participants to prefer luminance doses that support their health; hence, we based our hypotheses on the dynamic scenario of de Kort and Smolders (Citation2010), which is representative of the general curve that all dynamic lighting scenarios seem to offer (e.g., Hoffmann et al. Citation2008). Thereby, the reader should keep in mind that these scenarios are still a topic of heavy discussion among researchers. Nevertheless, we expected occupants to choose higher luminances in the early morning and directly after lunch and declining luminances over the course of the morning and afternoon (q1). We hypothesized that these effects would be more pronounced for the surrounding luminance (Lsurr) than for the background luminance (Lback) because the surrounding area is closest to the participant’s eyes and thus has the largest possible influence on alertness. Despite this preference for higher luminances when feeling less alert, participants might also prefer a ratio that focuses their attention on their work and thus a lower background than task luminance (task and surrounding > background ratio) and possibly also a lower surrounding than task luminance (task > surrounding and background ratio).
Fig. 3. Expected variation over the day in Lsurr and Lback and SA levels (q2 and q3)
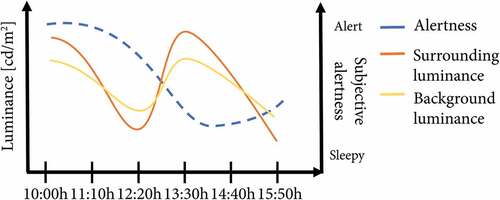
For SA, it is more complicated to develop plausible expectations because studies reported contrasting results (q3); nevertheless, shows a possible course of SA levels based on the common picture that literature on human daily alertness curves provides. When inspecting the hypothesized curves, it can be seen that the relationship between SA and Lsurr and Lback depends on the time of day; we expected participants to prefer higher luminances in the morning, although feeling relatively alert, but also after lunch, when they are feeling sleepy (q4).
2. Method
2.1. Study design
We used a repeated measures design: at six times during the day, each participant was automatically probed for SA via a user interface on the PC, followed by the task to set the surrounding and background luminaires such that they would feel comfortable. The task luminaire was fixed at 100%; participants were not allowed to adjust this setting to always provide them with sufficient desk lighting. The resulting surrounding (Lsurr) and background luminance (Lback) and the task : surrounding : background ratio comprised the dependent variables (DVs) and SA and time of day comprised the independent variables (IVs).
During the experiments, participants were alone in the office space; this single-occupancy scenario can serve as a basis for scenarios where more workers are simultaneously present. The presence of coworkers might affect participants’ choices; submissive users might choose a setting that satisfies other workers to avoid conflicts (Despenic et al. Citation2017).
2.2. Participants
The data was collected in two time periods. In the first period (on weekdays in March and the beginning of April 2017), 21 users participated, but three of them did not attend the part where they set the lighting. In the second period (on weekdays in May 2018), 12 completed the experiment. Because each user participated separately for an entire day (8:45 am to 5:00 pm), these data for 30 users in total were obtained in 30 days. They represented a normal office population and were recruited through promoting the experiment at Eindhoven University of Technology. The sample consisted of 10 females and 20 males, age range 20–47 (mean = 25, SD = 5.3); the sample size was thus not homogeneous in sex and age, which should be kept in mind when interpreting the results. Selection criteria included workers aged 18–65 and with normal to normal-corrected vision. The experiment started after sunrise, meaning that participants were exposed to some daylight upon arrival. Prior to the experiment, all participants signed an informed consent that explained the purpose and general setup of the experiment. Everyone participated voluntarily without financial compensation; they were rewarded for their effort with coffee and cake after the experiment.
2.3. Settings
The experiment was conducted in a darkened laboratory space (5.1 × 5.55 × 2.4 m); daylight was excluded to minimize the variance in the conditions at the six different moments (within participants) and on different days (between participants). The space was furnished with four desks arranged parallel to each other (0.75 × 1.7 m; see ). Computer screens were placed on all desks; the participants’ screens had a luminance of 100 cd/m2. They used the screens control the surrounding and background lighting and for their work activities so that all participants were exposed to the same screen luminance. Instead of a PC, participants’ laptops were connected to this computer screen such that they could perform their own work.
Fig. 4. Plan of the lab room, with the desks and chairs (grey), the task luminaire (blue), surrounding luminaires (pink), and background luminaires (green); the participant sat behind desk 3, and the walls are numbered 1 to 4
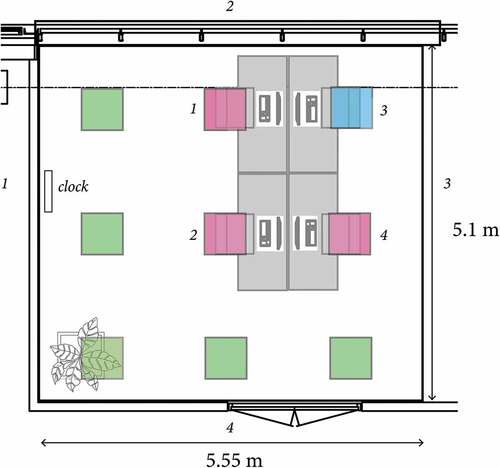
To be representative of a typical bullpen office, no partitions were placed between the desks. Daylight was excluded through a darkening screen to such an extent that the amount of daylight entering was too little to cause any variance in participants’ lighting conditions. provides the room characteristics pertaining to the luminous conditions. Although EN12464-1:2011 recommends a floor reflectance in the range of 20% to 40%, the experimental room included a black floor with a reflectance of 12%; we chose to maintain these original conditions, which forms a practical limitation of this study.
Table 1. Room surface materials and reflectances. The numbers of the walls and desks can be found in
The space was illuminated by nine 600 × 600 mm PHILIPS RC461B G2 PSD W60L60 1xLED34S/840 recessed luminaires. They were equally distributed over the ceiling in a 3 × 3 grid, resulting in a spacing of 1.2 m between luminaires (see ). Each desk was placed underneath a single luminaire. The height of the space was relatively low (2.4 m); therefore, luminaires were shielded to prevent the extreme luminances of the luminaires from confounding the results. White carbon board was used to create shields with the same width as the luminaires and their height was tailored to the viewing angle of the participant, which prevented the participant from looking into the luminaire. Consequently, their height decreased when they were positioned further away from the participant. The luminaire above each participant did not have such shields because it was not in the participant's field-of-view. Although the UGR was ≤19 in all conditions, this extra precautionary measure was taken because when extreme luminances occur in the field of view, they might feel uncomfortable; nevertheless, participants in the study by de Bakker et al. (Citation2018) disliked the brightest condition the least, and research showed that indices are limited in estimating human perceptions (Suk et al. Citation2017). This discomfort might consequently dominate their general perception of the lighting and hence prevent them from setting their real preferred luminances. The luminaires consisted of light emitting diodes with a correlated color temperature Tcp = 4000 K and a general color rendering index Ra = 80. The maximum power draw of each luminaire was 30 W. Their spectra are shown in , as measured with a Konica Minolta CL-500a Spectrophotometer.
2.4. Procedure
The procedure is depicted in : the experiment started with an explanation of the procedure (step 1). Subsequently, participants sat for 10 min in a completely dark lab space to create a similar baseline condition for all (step 2). Then lighting was set at the start level and participants were given a pretest questionnaire measuring possible confounding variables (step 3), as will be explained in the Measures section. Next, participants experienced the preset conditions twice in separate trials, which took ±54 (step 4); this was repeated at the end of the day (step 7). These two steps related to an investigation of the influence of adaptation, but the results are not reported because they fall outside the scope of this article. At 10:00 am, participants were provided control over the surrounding and background lighting for the first time (step 5). A user interface on the computer consisting of a slider allowed them to adjust the dimming levels in steps of 1%; the position of the slider within the range was indicated (i.e., the percentage they selected) as well as the range (1%–100%). Thus, they could not switch off the lighting completely; this was disabled because it could result in dangerous situations and conflicts with the European lighting standard (European Committee for Standardization 2011).
Fig. 5. Procedure of the experiment: step 1 = explanation of procedure, step 2 = baseline setting, step 3 = pretest questionnaire, step 4 = evaluation of preset conditions, step 5 = participants setting the surrounding (pink) and background lighting (green) (six times), step 6 = lunch break, step 7 = evaluation of preset conditions, step 8 = interview. Time of each step is indicated in minutes in front of the clock symbols underneath the boxes
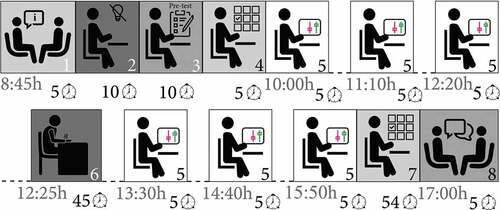
Participants were prompted to set these levels at five other times evenly distributed over the day: 11:10 am, 12:20 pm, 1:30 pm, 2:40 pm, and 3:50 pm (step 5). This distribution did not often interrupt participants' work but provided us with sufficient data points in both the morning and afternoon. Each day participants were asked to reset both luminaire groups to 1% and adjust them from thereas noted during the instructions. After this resetting, they were allowed to set the lighting to the same levels as before, though this was not explicitly stated. During the day, they could do their own work. They left the space for a lunch break between 12:25 pm and 1:10 pm (step 6); their settings chosen at 12:20 pm were kept. The experiment ended with a closed-structured interview, which, among others, included the questions “How did you set the lighting during the day?” and “What did you think about the absence of daylight?” (step 8). Some relevant quotes related to these questions are included in the Discussion; because interviews were only performed in the first time period (N = 18), their results were not extensively analyzed.
2.5. Measures
2.5.1. Alertness
Alertness was measured with the Karolinska Sleepiness Scale (Åkerstedt and Gillberg Citation1990); this subjective measure was chosen because we were interested in whether users’ own perceptions of their alertness state would affect their choice of luminance distribution. We chose not to investigate the effect on their actual performance, but it would be a relevant measure to include in a follow-up study. We inverted the scores to reflect participants’ subjective alertness.
2.5.2. Luminance distributions
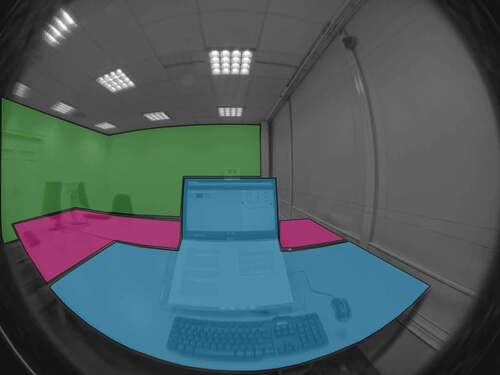
To describe the luminance distributions, we chose Lsurr and Lback, as explained above, and the ratio between the luminances in these areas and the task area, the task : surrounding : background ratio. These three areas were chosen because they included the architectural surfaces that were directly affected by setting the respective luminaires; therefore, the areas on participants’ right sides were not included in the background area. shows the three areas as seen from the participants’ points of view. The task luminance was not included as a DV because participants were not allowed to dim the task level; hence, the luminance in this area remained relatively constant. After the experiment, participants’ settings were retrieved and the resulting scenes were photographed with Bee-Eye, a luminance distribution measurement device developed by Kruisselbrink et al. (Citation2017). The resulting pictures were automatically combined in a high-dynamic-range image; we used the Hdrscope program developed by Inanici and Heerwagen (Citation2012) to obtain the median luminances in the three areas; the use of mask images ensured consistency across the analyses (see .
Fig. 6. Mask areas used when analyzing the high-dynamic-range images of participants’ preferred scenes (blue for the task area, pink for the surrounding area, and green for the background area)
To provide recommendations on which luminance distributions to apply throughout the day, we categorized the median luminances in the following four categories based on the range of the measured values: low (l) for 20 ≤ 35 cd/m2, low-medium (l-m) for 35 ≤ 50 cd/m2, medium (m) for 50 ≤ 65 cd/m2, and medium-high (m-h) for 65–80 cd/m2. Humans perceive lighting contrasts not based on the absolute levels but in a relative sense of order; therefore, the task : surrounding : background ratio was computed based on the relative differences between the luminances in the three areas, just like the Weber contrast (Fechner Citation1860/1966). The task : surrounding and surrounding : background ratios were obtained by dividing the mean luminance of the first area by the mean luminance of the second area. These ratios were used to create categorized task : surrounding : background ratios according to the scheme depicted in .
Table 2. Categorization scheme of luminance ratios between the task and surrounding areas and surrounding and background areas
We chose a deviation of 20% in both the positive and negative realms to categorize a contrast as similar to account for measurement errors. Humans are able to perceive a contrast of 1%, as shown by Fechner (Citation1860/1966). Following the scheme, this means that when the task : surrounding ratio was 0.9 and the surrounding : background ratio 1.3, we classified the task : surrounding : background ratio as “task and surrounding > background.”
2.5.3. Possible confounding characteristics
In the pretest questionnaire (step 3 in ), age, gender, ethnicity, highest level of education, vision deficiency, and color vision deficiency were assessed because they could possibly confound the results. Color vision deficiency was assessed using the question, “Do you have difficulties distinguishing colors?” In addition, we probed four user characteristics: (1) privacy desire (Kaya and Weber Citation2003); (2) satisfaction with screen brightness, with a self-developed question; (3) light sensitivity, measured with the three questions from Smolders et al. (Citation2012) on a 5-point Likert scale; and (4) importance of physical factors in the work surroundings, by rank ordering lighting, noise levels, temperature, privacy, air quality/ventilation, size of work space, and window access (after Veitch et al. Citation2007).
During the experiment, we asked participants to note the main task that they performed every hour: (1) typing, (2) other computer work, (3) reading a paper, (4) writing a paper, or (5) other. These were classified into four categories: computer work (1 and 2), paper work (3 and 4), both, or other. Lastly, the weekday was included as a possible confounding factor of participants’ SA levels and luminance preferences.
2.6. Analyses
2.6.1. Testing for confounding factors
First, we analyzed the distribution of the DVs and SA scores; they closely approximated a normal distribution. We used the standardized scores of the DVs to identify outliers; none exceeded −3 or 3, so no data were excluded. Five data points of the 160 were missing because participants missed and/or failed at setting the lighting. One participant had color deficiency; whether excluding this user affected the significance of the results was determined and, if so, his data were excluded. A paired t-test showed that none of the environmental variables was attributed a different ranking after the experiment compared to before; thus, these variables were excluded as confounding factors. When correlating the potentially confounding variables correlated with the DVs and SA, several significant correlations >0.3 were identified, as reported in in the Appendix; these were included in subsequent analyses. Sex and age did not have such correlations, suggesting that the nonhomogeneity of the sample did not affect the results.
2.6.2. Answering the research questions
To analyze the data, linear mixed modeling was chosen due to the repeated structure within participants and because alertness varied between the six moments; analysis of variance does not allow for including a varying covariate. However, because of the limited sample size, we considered this model testing inappropriate and limited ourselves to trend analyses over time. To answer q1, we used the categorized values of Lsurr, Lback, and their ratios and plotted these over the day. For q2, we calculated the relative change in luminance that participants applied to the value chosen at the previous moment (%):
For the luminance ratio type, we determined whether participants chose the same or a different type compared to the previous moment (binary scale). We calculated individuals’ changes in SA (q3) with the same formula as Lchange. For q4, we calculated the correlation between L and SA at the same moment, with and without controlling for time to determine whether the correlation depended on time. Moreover, we calculated the correlation separately for each of the six moments. We accounted for the significant confounding characteristics by adding them as a control variable in the partial correlations. These correlations were only computed for Lsurr and Lback, not the ratios, because it had a categorical scale without intrinsic ranking.
3. Results
3.1. Preferred luminance distributions over the workday
shows the percentage of participants who chose the different categories of Lsurr and Lback for the six moments (the absolute values are reported in in the Appendix). In general, participants preferred lower values for the background area (l and l-m) than the surrounding area (l-m and m). At 11:10 am and 12:20 pm, we see a small shift toward medium-high values for Lsurr; these values were lowest for Lsurr at the start and end of the day. At the end of the day, participants preferred lower values in the background area than before (m instead of m-h). Similar to Lsurr, most participants did not choose medium-high background luminances at the start of the day.
Fig. 7. Preferred Lsurr and Lback over the day: the number of participants in each of the four luminance categories is shown (N = 30)
shows the percentage of participants who preferred different task : surrounding : background ratios. We first determined all different types that were chosen; to make this number comprehensible, we shared a type under the category “other” if it was chosen only a few times (5% of 180 instances)—this resulted in four categories, as depicted in Fig. 8. reports the descriptive statistics of the exact values of the task : surrounding and surrounding : background ratios for the six different moments. The figure shows that participants preferred mostly a uniform condition (task ≈ surrounding ≈ background ratio), followed by a “task and surrounding > background” ratio and a “task > surrounding > background” ratio. The distribution of the participants over the different categories remained relatively constant throughout the day; only at 11:10 amdo we see a small shift: instead of a “task > surrounding > background” ratio, more participants prefer a uniform or other, uncategorized, ratio.
Fig. 8. Preferred task:surrounding:background ratios over the day: the number of participants in each of the five luminance ratio categories is shown (N = 30)
3.2. Variation in preferred luminance distributions over the workday
shows Lchange,surr, and Lchange,back throughout the day; the median values were around 0, suggesting that, on average, preferences remained constant (the absolute changes are reported in in the Appendix). The figures also shows that, at 12:20 pm and 2:40 pm, participants adjusted the luminances the least, because the 25% and 50% quartiles are the smallest; 50% translates to approximately 25 cd/m2. At 11:10 am and 3:50 pm, 50% of the participants significantly increased Lsurr and Lback compared to the previous moment (up to +40%). Moreover, shows that individual differences were large, with 25% of the participants making adjustments of ±50% most of the time, and at 11:10 am even 120%, whereas others chose similar luminances.
Fig. 9. Lchange,surr and Lchange,back compared to the previous moment, in percentages (N = 30)
For the ratio, the number of participants who made a different choice compared to the previous moment ranged from 39% to 52% for the different moments, indicating that about half of the participants preferred dynamic ratios.
3.3. Variation in SA levels over the workday
shows SAchange over the day, which shows that, on average, participants felt evenly alert throughout the day, because the median approximated 0 at all times except 2:40 pm (the absolute values and changes are reported in and in the Appendix, respectively). The medians indicate that the majority felt less alert when the morning progressed. In the afternoon, the median values were all negative, meaning that, on average, participants experienced more sleepiness; the most significant drop occurred at 2:40 pm, with 75% of the participants feeling sleepier. Again, we see large individual variation; the 25% and 50% quartiles of the boxplot reached relatively far—at 11:10 am they were over +40%. This means that the majority of participants had a varying SA state over the day.
Figure 10. SAchange compared to the previous moment, in percentages (N = 30)
3.4. Influence of SA on preferred luminances over the workday
The correlations between Lsurr and Lback (at tn) and SA (at tn) were both significant without time (r = 0.16, p =.040; r = 0.18, p = .016, respectively) and with time (r = 0.15, p =.047; r = 0.17, p = .022, respectively). Adding the possible confounding characteristics made the results insignificant (we report these correlations in in the Appendix). ecause the change due to adding time of day was very small, this factor does not seem to influence the relationship between the luminances and SA. No significant correlations were found at the six moments separately (see in the Appendix). On an individual level, only one participant showed a significant correlation for both Lsurr and Lback (these are reported in in the Appendix).
4. Discussion
We will first discuss the preferred luminance distributions (q1), followed by their variation over the day (q2) as well as the SA levels (q3) and the possible explanation of the variation in preferences by SA (q4). Subsequently, we indicate the limitations of this study and possible future research directions.
4.1. Preferred luminance distributions over the workday
One of our subgoals was to reveal office workers’ preferences for luminance distributions in bullpen offices, starting in a setup without daylight. The results suggest that, in this setup, we can satisfy ±70% of the participants by offering Lsurr in the low to low-medium range (35–65 cd/m2) and Lback in the low-medium to medium range (20–50 cd/m2) continuously throughout the day (q1). This is interesting for energy saving purposes, because it means that office luminaires might be able to operate at relatively low power at moments of vacancy, despite the absence of daylight. Moreover, our results suggest that participants are comfortable with lower luminances (<65 cd/m2) at the start of the workday; this might be due to their preceding exposure to daylight. To satisfy the majority of the participants regarding the task : surrounding : background ratio, this ratio should be either uniform, as typically applied by lighting practice, or of the type “task > surrounding > background” or “task ≈ surrounding > background.” This last ratio was also evaluated as best in the study of de Bakker et al. (Citation2018), suggesting that the reliability of these studies is high. The preference for a “task > surrounding > background” ratio is in line with lighting standards that recommend as a rule of thumb 1:3:10. It should be noted that these preferences are probably only applicable to the one position of the participant who was tested in this study; at other positions, users have different views of the space; for example, if they are sitting closer to the opposite wall, this wall covers a larger area of their view.
4.2. Variation in preferred luminance distributions over the workday
On average, the luminance distribution preferences were rather constant, and plotting the relative changes as made by the individual participants further confirmed this (q2). However, this also showed that some individuals do have dynamic preferences (50% of the participants applied changes from −20% to +50%); this individual variation is in line with Newsham et al. (Citation2008), who detected fluctuations of 25% to 50% around individuals’ own means. At 11:10 am and 3:50 pm, the majority increased the luminances in both areas. This was confirmed by only two participants in the interviews; they indicated that they liked brighter settings in the morning but lowered them as the day continued. Another participant raised the lighting again at the end of the day, because she had her “midday dip”; she felt that “more light would be good again.” In the dynamic lighting scenarios, this rise was applied directly after lunch (de Kort and Smolders Citation2010; Motamed et al. Citation2016), but we identified that participants in this study preferred increasing levels later in the afternoon, which is in line with Chraibi et al. (Citation2016) and Newsham et al. (Citation2008). At the beginning and end of the day, the majority chose higher luminances compared to the previous moment, suggesting that dynamic scenarios should apply an increase at these moments; for the other times, the first and third quartiles reached into both the positive and negative; hence, it remains difficult to provide a suggestion on how to vary the luminances over the day to satisfy this subset of users with dynamic preferences. Nevertheless, the dynamic lighting scenarios do offer the same scenario to all individuals, which becomes questionable based on our results; instead, personalized lighting should be provided. This is a complicated matter in multi-occupancy scenarios, but the grouping of luminaires into task, surrounding, and background areas makes this easier. First of all, the task levels can always be set according to the individual preferences, because they are related to one specific desk. This task level might be the surrounding or background level of another occupant, but because it is most determinant for the comfort of the occupant to whom it provides the task level, it should be set according to her or his preferences. The surrounding luminance can be personalized when other coworker(s) sit(s) at another desk group; the background luminance will always need to satisfy all present coworkers; consensus control can solve this issue (see, for example, Lashina et al. Citation2019).
We did not expect varying ratios, but close to half of the participants preferred different ratios throughout the day. At 11:10 am, a small shift toward more uniform ratios could be detected.
4.3. Variation in SA levels over the workday
We did see a significant drop in SA at 2:40 pm, which confirms the midday dip identified in several earlier studies (Begemann et al. Citation1997; Monk Citation2005; Valdez et al. Citation2008). Individual variation was again large, which corresponds with the difficulties of other researchers to understand the development of SA over the day. As Viola et al. (Citation2008) explained, external factors—for example, one’s chronotype and sleep duration—cause this variation. We did find that SAchange reached into the positive rangemore in the morning, suggesting that the majority felt increasingly alert. This contrasts with our expectations but could be explained by the chosen luminances. This finding also suggests that the absence of daylight did not cause participants to feel less alert as the day progressed; during the interviews, only four participants mentioned being bothered by the absence of daylight, and three of them also missed a view. It should be noted that the study lasted only for a day; with a longer study duration, more participants may be annoyed. Overall, we can conclude that SA levels during the course of the day differ between individuals (q3); hence, our results suggest that research should focus on investigating the relationship between lighting and SA on an individual level.
4.4. Influence of SA on preferred luminances over the workday
SA correlated significantly with Lsurr and Lback chosen subsequently by participants; both correlations were positive but small (q4). The positive direction suggests that when participants felt more alert, they chose higher luminance levels, thus aligning them with their feelings of alertness instead of employing them as a means to cure their feelings of fatigue. We learned something different from the interviews; that is, several participants indicated that they increased the lighting levels when feeling more tired: “One time when I felt tired, I set them higher to try whether I liked that more.” This finding could be explained by individual differences, but we only detected a significant correlation with one participant; this is likely due to the limited number (six) of data points per individual.
Nevertheless, our results suggest that a solution to make office workers feel more alert could be to ask them to set the lighting according to their real-time concentration needs several times a day, instead of applying automatic scenarios. This approach will also assure that we provide simultaneously satisfying and healthy lighting conditions; thta is, conditions that support the natural circadian rhythm. We found this relationship to be independent of time of day and positive, suggesting that occupants always want to align the lighting with their feelings of alertness. This contrasts with the idea of dynamic lighting scenarios, which aim to alert office workers when feeling sleepy.
4.5. Limitations
First, the sample size was not homogeneous in sex and age; this could have caused differences in preferences in addition to SA and time of day, but the correlations suggested that this was not the case.
In addition, the experiment space did not provide any distractions; participants could not talk to colleagues, were not allowed to leave the space for anything except bathroom use, and had no access to daylight and a view. Consequently, changes in the electric lighting might have formed a more welcome distraction than they would in the real office environment. Here, users might leave the lighting at the same setting throughout the day because their work environment already poses so many distractions. However, dynamic lighting has the potential to support and even enhance their work performance and therefore might be a welcome addition in a real office.
Moreover, we did not control the lighting conditions that participants experienced before arrival and during their lunch break. All participants were exposed to the lighting in the entrance space; its CCT was lower than the lighting in the experiment space. Some might have also gone outside into the daylight, and the light output and CCT of the lunch locations might have differed as well. As a result, participants might have entered after lunch with a variety of SA levels, but this likely only influenced the lighting settings directly after lunch.
We did not assess any sleep-related variables, such as sleep quality and duration or chronic sleep deprivation. These might have shifted participants’ SA levels because circadian rhythm is dependent on the sleep–wake rhythm (Borbély et al. Citation2016). In addition, participants’ circadian rhythms might have been shifted due to transmeridian travel. Although participants showed on average SA levels that comply with earlier research, this means that we cannot ensure that their SA levels are representative of “normal” levels. Though we had participants set the lighting each time, in a real office environment they might forget to do so. A solution could be to automatically dim the lighting several times a day; this would be beneficial for energy saving purposes as well. However, as explained before, these levels should be chosen such that they do not harm occupants’ health.
Similarly, we did not control for health-related variables, such as body mass index, medication use, dietary restrictions, alcohol and caffeine intake, and participant’s health status. These could have affected the alertness levels; therefore, the conclusions of this study might not be hold for the entire population.
4.6. Future research directions
We identified that a subset of users preferred dynamic over static luminance distributions. Research should validate whether this also holds for other lighting parameters, such as task illuminance. Moreover, this study showed that alertness is one of the factors that determines which dimming levels are preferred in the surrounding and background areas. Daylight is likely another important factor, because several studies showed that daylight is strongly preferred over electric light (Galasiu and Veitch Citation2006). Because one of its characteristics is varying light output, participants could have chosen varying luminance settings over the day to mimic this quality. To exclude this effect, we should replicate this study with daylight; this might yield different results for the preferred background luminances because daylight often enters office spaces from the back.
5. Conclusion
Current developments in smart lighting make it possible to provide different lighting doses over the course of the day. Though research has developed dynamic lighting scenarios that aim to support humans’ natural circadian rhythms, users’ varying preferences for luminance levels and ratios over the day have not been studied. Occupancy-based lighting control is one of the most applied automatic strategies to reduce energy consumptionin workplaces. However, studies tend to focus on this aspect, whereas users’ comfort has received little attention. Therefore, this study investigated preferred luminance distributions in a single-occupancy scenario in relation to time of day and SA. We identified the range of luminance levels and ratios with which the majority of participants could be satisfied continuously throughout the day; close to half of them showed dynamic preferences. Moreover, we found a correlation between SA and the preferred luminances, meaning that we should consider office workers’ real-time SA in the design of local lighting control. Individuals chose to align the luminance levels with their feelings of alertness, which contrasts with healthy lighting scenarios. Throughout the study, we found large individual differences, showing the importance of personalizing lighting scenarios; therefore, this should be the focus of future research. Moreover, the influence of factors such as the presence of coworkers and daylight should be studied to be able to apply local lighting control.
Acknowledgments
This research was performed within the framework of the Strategic Joint Research Program on Intelligent Lighting between TU/e and Koninklijke Philips N.V. and the Impuls II SPARK Program.
Disclosure statement
The authors have no financial interests to declare.
Additional information
Funding
References
- Åkerstedt T, Gillberg M. 1990. Subjective and objective sleepiness in the active individual. Int J Neurosci. 52(1–2):29–37.
- Begemann SHA, van den Beld GJ, Tenner AD. 1997. Daylight, artificial light and people in an office environment, overview of visual and biological responses. Int J Ind Ergon. 20(3):231–239.
- Berson DM, Dunn FA, Takao M. 2002. Phototransduction by retinal ganglion cells that set the circadian clock. Science. 295(5557):1070–1073.
- Borbély AA, Daan S, Wirz-Justice A, Deboer T. 2016. The two-process model of sleep regulation: a reappraisal. J Sleep Res. 25(2):131–143.
- Borisuit A, Linhart F, Scartezzini J-LMunch M. 2015. Effects of realistic office daylighting and electric lighting conditions on visual comfort, alertness and mood. Light Res Technol. 47(2):192–209. doi:10.1177/1477153514531518.
- Boyce PR. 2014. Human Factors in Lighting. 3rd ed. Boca Raton, FL: CRC Press.
- Cajochen C, Zeitzer JM, Czeisler CA, Dijk DJ. 2000. Dose-response relationship for light intensity and ocular and electroencephalographic correlates of human alertness. Behav Brain Res. 115(1):75–83.
- Chraibi S, Lashina T, Shrubsole P, Aries M, van Loenen E, Rosemann A. 2016. Satisfying light conditions: a field study on perception of consensus light in dutch open office environments. Build Environ. 105:116–127.
- Chung TM, Burnett J. 2001. On the prediction of lighting energy savings achieved by occupancy sensors. Energ Eng. 98(4):6–23. doi:10.1080/01998590109509317
- de Bakker C, Aarts M, Kort H, Rosemann A. 2018. The feasibility of highly granular lighting control in open-plan offices: exploring the comfort and energy saving potential. Build Environ. 142:427–438.
- de Bakker C, Aries M, Kort H, Rosemann A. 2017. Occupancy-based lighting control in open-plan office spaces: a state-of-the-art review. Build Environ. 112:308–321. doi:10.1016/j.buildenv.2016.11.042
- de Kort YAW, Smolders KCHJ. 2010. Effects of dynamic lighting on office workers: first results of a field study with monthly alternating settings. Light Res Technol. 42(3):345–360. doi:10.1177/1477153510378150.
- Despenic M, Chraibi S, Lashina T, Rosemann A. 2017. Lighting preference profiles of users in an open office environment. Build Environ. 116:89–107.
- European Committee for Standardization. 2011. EN 12464-1:2011 light and lighting - lighting of work places - Part 1: Indoor work places. Brussels.
- Fechner GT. 1860/1966. Elemente der Psychophysik. In H. E. Adler (Transl.), Elements of psychophysics. 1966. New York, NY: Holt, Rinehart, and Winston.
- Galasiu AD, Newsham GR, Suvagau C, Sander DM. 2007. Energy saving lighting control systems for open-plan offices: a field study. LEUKOS.4(1):7–29. doi:10.1582/LEUKOS.2007.04.01.001.
- Galasiu AD, Veitch JA. 2006. Occupant preferences and satisfaction with the luminous environment and control systems in daylit offices: a literature review. Energ Buildings. 38(7):728–742.
- Heerwagen JH. 1990. Affective functioning, “Light Hunger,” and room brightness preferences. Environ Behav. 22(5):608–635.
- Hoffmann G, Gufler V, Griesmacher A, Bartenbach C, Canazei M, Staggl S, Schobersberger W. 2008. Effects of variable lighting intensities and colour temperatures on sulphatoxymelatonin and subjective mood in an experimental office workplace. Appl Ergon. 39(6):719–728. doi:10.1016/J.APERGO.2007.11.005.
- Huiberts LM, Smolders KCHJ, de Kort YAW. 2016. Non-image forming effects of illuminance level: exploring parallel effects on physiological arousal and task performance. Physiol Behav. 164(October):129–139.
- Inanici M, Heerwagen J. 2012. High dynamic range image processing toolkit for lighting simulations and analysis. 13th Conference of the BS2013.
- Kaya N, Weber MJ. 2003. Cross-cultural differences in the perception of crowding and privacy regulation: American and Turkish students. J Environ Psychol. 23(3):301–309. doi:10.1016/S0272-4944(02)00087-7.
- Kruisselbrink T, Aries M, Rosemann A. 2017. A practical device for measuring the luminance distribution. Int J Light. 19(1):75–90.
- Lashina T, Chraibi S, Despenic M, Shrubsole P, Rosemann A, Evert VL. 2019. Sharing lighting control in an open office: doing one’s best to avoid conflict. Build Environ. 148:1–10. doi:10.1016/j.buildenv.2018.10.040.
- Monk TH. 2005. The post-lunch dip in performance. Clin Sports Med. 24(2):e15–e23. doi:10.1016/J.CSM.2004.12.002.
- Motamed A, Benedetti M, Scartezzini J-L. 2016. On the impact of Integration of Non-Image Forming (NIF) effect of light on electrical lighting control in non-residential buildings. 9th International Conference on Indoor Air Quality Ventilation & Energy Conservation In Buildings. Seoul, Korea.
- Newsham G, Arsenault C, Veitch J, Tosco AM, Duval C. 2005. Task lighting effects on office worker satisfaction and performance, and energy efficiency. LEUKOS. 1(4):7–26.
- Newsham GR, Aries MBC, Mancini S, Faye G. 2008. Individual control of electric lighting in a daylit space. Lighting Res Technol. 40(1):25–41.
- Smolders KCHJ, de Kort YAW, Cluitmans PJM. 2012. A higher illuminance induces alertness even during office hours: findings on subjective measures, task performance and heart rate measures. Physiol Behav. 107(1):7–16.
- Smolders KCHJ, de Kort YAW, van den Berg SM. 2013. Daytime light exposure and feelings of vitality: results of a field study during regular weekdays. J Environ Psychol. 36:270–279.
- Suk JY, Schiler M, Kensek K. 2017. Investigation of existing discomfort glare indices using human subject study data. Build Environ. 113:121–130. doi:10.1016/J.BUILDENV.2016.09.018.
- Valdez P, Reilly T, Waterhouse J. 2008. Rhythms of mental performance. Mind Brain Educ. 2(1):7–16. doi:10.1111/j.1751-228X.2008.00023.x.
- van Duijnhoven J, Aarts MPJ, Rosemann ALP, Kort HSM. 2018. Ambiguities regarding the relationship between office lighting and subjective alertness: an exploratory field study in a dutch office landscape. Build Environ. 142:130–138.
- Van Duijnhoven J, de Bakker C, Aarts MPJ, Rosemann ALP, Kort HSM. 2017. An unobtrusive practical method to derive individual’s lighting conditions in office environments. Proceedings of the 2017 IEEE 14th International Conference on Networking, Sensing and Control, ICNSC 2017. New York, NY. doi:10.1109/ICNSC.2017.8000138.
- Veitch J, Newsham G, Boyce P, Jones C. 2008. Lighting appraisal, well-being and performance in open-plan offices: a linked mechanisms approach. Lighting Res Technol. 40(2):133–151.
- Veitch JA, Charles KE, Farley KMJ, Newsham GR. 2007. A model of satisfaction with open-plan office conditions: COPE field findings. J Environ Psychol. 27(3):177–189.
- Veitch JA, Stokkermans MGM, Newsham GR. 2013. Linking lighting appraisals to work behaviors. Environ Behav. 45(2):198–214.
- Viola AU, James LM, Schlangen LJM, Dijk DJ. 2008. Blue-enriched white light in the workplace improves self-reported alertness, performance and sleep quality. Scand J Work Environ Health. 34(4):297–306.
- Von Neida B, Maniccia D, Tweed A. 2001. An analysis of the energy and cost savings potential of occupancy sensors for commercial lighting systems. J Illum Eng Soc. 30(2):111–125.
- Zhu Y, Yang M, Yao Y, Xiong X, Xiaoran L, Zhou G, Ning M. 2017. Effects of illuminance and correlated color temperature on daytime cognitive performance, subjective mood, and alertness in healthy adults. Environ Behav. doi:10.1177/0013916517738077.
Appendix
Figure A1. Spectral power distribution of the luminaires in the experiment space
Preparatory analyses
Table A1. Significant correlations ≥0.3 between the dependent variables and potentially confounding variables
Preferred luminances over the workday (q1)
Table A2. Descriptive statistics for preferred surrounding and background luminance at the six moments (N = 30)
Table A3. Descriptive statistics for preferred task : surrounding and surrounding : background ratios at the six moments (N = 30)
Variation in preferred luminances over the workday (q3)
Table A4. Descriptive statistics for absolute Lchange,surr and Lchange,back (N = 30)
Variation in SA over the workday (q3)
Table A5. Descriptive statistics for SA at the six moments (N = 30)
Table A6. Descriptive statistics for absolute SAchange (N = 30)
Influence of SA on preferred luminance distributions over the day (q4)
Table A7. (Partial) correlations between SA (tn) and Lsurr and Lback, (tn), controlled by the significant correlating confounding variables (see ; N = 30)
Table A8. Correlations between SA (tn) and Lsurr and Lback (tn) at the six moments (N = 30)
Table A9. Significant individual correlations between SA (tn) and Lsurr and Lback (tn)