
ABSTRACT
Daylight provision to the indoor space is affected by different building elements that cannot be fully controlled by the users, such as the window size of a space. The dimensions of the fenestration not only affect the lighting levels, but they also affect how the space is perceived by its users. The present study examines three different window sizes via virtual reality, to study how they affect the perception of both a small and a large space at high latitudes. Additionally, two context scenarios (socializing and working), as well as three different sky types (overcast sky and clear skies with either high or low sun angle) were evaluated. The experimental study applied a mixed design with within-subjects and between-subjects factors. A total of 150 participants evaluated the scenes using a Likert-type scale to rate eight different subjective attributes. The statistical results showed that both window size and space type significantly affect the participants’ spatial perception, as well as their satisfaction with the amount of outside view. Larger windows led to more positively evaluated spaces for all studied attributes. Moreover, a significant interaction was found between window size and type of space for the satisfaction with the amount of view in the space, indicating that the window size was dependent on the type of space in which the windows are located. Specifically, the window sizes were rated higher in the small space than in the large space for the evaluation of amount of view. The findings show that window size affects how people perceive a space, and additionally, that other spatial features, such as space type, affect window size preferences.
1. Introduction
A deeper understanding of the effects of space and light on human perception is advocated as necessary for the creation of built environments that are not only energy efficient and comfortable, but also positively perceived by their users (Lam and Ripman Citation1977). Thus, in times when the building standards are changing to make way to zero-emission buildings, it is essential to examine the acceptance of design choices – such as the size and form of building elements – from the perspective of the occupant. For example, windows as a building element, is inextricably related to the luminous conditions and the perception of a space. The importance of luminous conditions (of either daylight or artificial lighting) in the perceptual performance of a space has been addressed in various studies (de Kort and Smolders Citation2010; Parpairi et al. Citation2002; Rockcastle and Andersen Citation2014; Veitch Citation2001). However, there is no defined range of indicators regarding the positive perceptual qualities of space connected with the quality of daylight, which depends on many factors including context, function and user needs. This lack of effort in the field of subjective appraisal in lit environments has been discussed by lighting researchers (Fontoynont Citation2002; Pellegrino Citation1999). This shortfall leaves a thin body of knowledge about the perceptual evaluation of daylight, as there is much that is still unexplored. The present paper investigates user preferences and perception toward windows in the context of high latitudes, while addressing essential factors related to the use and the type of space.
1.1. Window size
With sustainability high on the agenda of professionals in the building sector, windows have been found to be responsible for roughly 30% of the heat loss of a building (Grynning et al. Citation2011). It is not surprising then, that the dimensions of windows are a target of discussion in view of establishing new building regulations. Not only do windows admit daylight or a connection to the outdoors, but also already widely acknowledged positive psychological effects (Butchart et al. Citation2006; Ulrich et al. Citation1991; Veitch and Galasiu Citation2012). In working environments, window access has been found to be an important factor that impacts the satisfaction with lighting, mood and well-being in open-plan and private offices (Boubekri et al. Citation1991; Butler and Steuerwald Citation1991; Leder et al. Citation2016). Moreover, the negative aspects that could be associated with working in an open-plan office could be diminished by having a proximity to windows (Yildirim et al. Citation2007). Considering windows and their effect on human perception, research has also found the impact that window has on the esthetic evaluation of architectural spaces (Matusiak Citation2006; Moscoso et al. Citation2015a; Ozdemir Citation2010; Stamps and Krishnan Citation2006). Different parameters of the window design (e.g. location, size and shape) are factors that affect the distribution of the daylight, but also play a critical role on how a person perceives the environment (Dogrusoy and Tureyen Citation2007; Franz et al. Citation2005).
Regarding different aspects of window design, studies found that, among various factors, the window size is important to judge the spaciousness of a room (Inui and Miyata Citation1973, Citation1977). Although large windows are generally preferred over smaller windows (Dogrusoy and Tureyen Citation2007; Moscoso et al. Citation2015a), this preference has been suggested to be influenced by the use of space, with specific uses leading to a preference for smaller windows (Butler and Biner Citation1989). Indeed, the size and form of the window have been shown to influence the perceived dimensions of a room, affecting impressions of openness, spaciousness and enclosedness (Franz et al. Citation2005; Matusiak Citation2006; Stamps Citation2010a, Citation2010b).
Regarding building recommendations for window sizes, the introduction – in 2010 for Norway – of the 2% average Daylight Factor (DF) as a minimum threshold (Statens Bygningstekniske Etat Citation2011; TEK Citation2017) was a step toward considering additional aspects, such as obstructions to the view out and light transmittance of the glazing. However, in practice the threshold of 2% DF has been used in common architectural practice in Norway as a target rather than a minimum level. The problem arises when this criterion is fulfilled as a maximum window size in building designs, and, independently of the use of the space, windows appear small and insufficient for the users’ positive perception of the space.
Furthermore, high latitudes usually count with subarctic climates, which are characterized by having long, very cold winters, and a small amount of yearly solar radiation compared to other regions (Peel et al. Citation2007). The climatic conditions present the challenge of reconciling the need for daylight access with the presence of extremely low sun angles, particularly in the winter months (i.e. around + 4°). Even though sunlight penetration in a space undoubtedly affects the occupants’ visual and thermal comfort, the presence of sunlight patches has also been shown to positively influence the spatial experience of occupants in studies that investigate the perceptual effects of both window size (Boubekri et al. Citation1991; Wang and Boubekri Citation2011) and of architectural design (Rockcastle et al. Citation2017a, Citation2017b). These findings, in combination with the effects of window size on spatial perception, bring forth the question of the joint impact of window size and daylight penetration on an occupants’ experience of space, particularly in the context of high latitudes. Daylighting studies carried out at high geographical latitudes are limited compared to those conducted in lower latitudes, thus creating a need to conduct dedicated studies in order to uncover new knowledge for the corresponding climates and populations.
1.2. Spatial context and size of space
Another factor that is suggested as essential in an occupant’s impression of the space is the use of that space. Boyce (Citation2003), argued that the occupants’ impressions toward lighting, will vary in different contexts of space use, stating that in order to explore high-order perceptions, people need to be placed in a specific context. The use of a specific spatial context has been shown to influence not only the preferred lighting conditions across spaces, but even within the same space. Specifically, studies that investigated the preference toward lighting levels as a function of the use of space showed that the light levels declared as most preferred differed dramatically for scenarios of different use of the same space (e.g. dining versus working) (Butler and Biner Citation1987). With attention to the perception of (day)lit spaces, scenarios of different uses of the same space have been shown to influence how interesting and exciting the space was perceived (Chamilothori et al. Citation2019a), as well as the preferred proximity of occupants to a sunlit area (Wang and Boubekri Citation2010). Additionally, user preference toward windows has been shown to be dependent on the size of the space (e.g. small- to medium-sized offices) (Butler and Steuerwald Citation1991). These outcomes raise an important question for our understanding of occupants’ preferences toward the design of windows: how is the preference toward window size mediated by the size of the space, or the activities conducted in that space?
1.3. Virtual reality as an experimental tool for lighting studies
Studies that focus on the impact of window size and of sunlight on perception have repeatedly emphasized the difficulty of ensuring the stability of the experimental conditions (Boubekri et al. Citation1991; Wang and Boubekri Citation2010), which limits the validity and reproducibility of research findings. In order to overcome the methodological constraints that daylighting studies may present, stereoscopic imaging has been used as a research tool in experimental lighting research (Cauwerts and Bodart Citation2011; Moscoso et al. Citation2015b). Moreover, for increase realism, the level of perceived immersion achieved by using virtual reality (VR) is even higher than the aforementioned studied modes due to the lack of conflicting stimuli from the peripheral vision. The user of a VR Head Mounted Display (HMD) cannot perceive anything else in the visual field except for the projected image, allowing for a more immersive and realistic experience. HMD VR displays have been shown as suitable in reproducing several aspects of visual perception (e.g. pleasantness, excitement, or interest) in interior spaces when comparing real and virtual reality environments depicting both daylit (Chamilothori et al. Citation2019b) and artificially lit scenes (Abd-Alhamid et al. Citation2019; Higuera-Trujillo et al. Citation2017). However, due the limited luminance range of the display in current HMD VR displays, some aspects of visual perception, such as glare, cannot be investigated. In addition, as a consequence of this limited luminance range, high dynamic range (HDR) images are typically tone-mapped before being displayed to account for the human eye’s brightness perception. The application of a suitable tone-mapping algorithm plays therefore an important role when visual perception factors are investigated, especially for aspects related to brightness perception.
In the last years, a growing number of investigations within lighting research have used VR as an experimental tool for studies examining the role of artificial light in way-finding (Cosma et al. Citation2016), simulation and visualization of daylighting and artificial lighting design in buildings (Natephra et al. Citation2017), interaction with lighting controls (Heydarian and Becerik-Gerber Citation2017), and subjective impressions of lit spaces (Chamilothori et al. Citation2019a; Mania Citation2001; Mania and Robinson Citation2004; Sawyer and Chamilothori Citation2019).
1.4. Objectives
Considering the previous sections, the main objective of the present paper is to evaluate the effects of window size on the subjective impressions of daylit spaces and, additionally, to assess to what extent the sky type and the use and size of the space may influence window size preferences. Thus, this paper presents the results of an experiment designed to answer the following research questions:
Q1: How do different window sizes affect the subjective impressions of different spaces at high latitudes?
Q2: Do different sky types, space type and contexts affect window size preferences in rooms at high latitudes?
To address these questions, an extensive experimental study was conducted in virtual reality, following a mixed experimental design that addressed the main factors of interest – window size, sky type, spatial context, and space type – as well as their interactions. Regarding the dependent variables, we examined the subjective impressions regarding both the emotional and visual aspects of the space – such as how pleasant or interesting the space is perceived, respectively–, and used the direction of the participant responses as an indicator of preference; examining, for example, whether a particular feature of the space led to a higher rating of pleasantness in the space for the same window. Further information can be found in Section 2.3. Following the focus of the present study on high latitudes, this study was conducted in Trondheim, Norway.
2. Method and procedure
To address the methodological constraints that studies with daylighting usually present, the present study employs a virtual reality (VR) headset following a VR-based experimental method that was developed and validated against real environments for investigating the perception of daylit spaces (Chamilothori et al. Citation2019b).
The VR method was selected as a research tool to overcome logistics and experimental challenges related to daylighting studies, e.g. daylight fluctuations and lack of control under natural light conditions. The experimental sessions occurred at the Norwegian University of Science and Technology (NTNU), in the city of Trondheim, Norway (63°43ʹ N), during the months of September and October 2018.
2.1. Experimental design
Considering the focus of the present study, the window size, with three levels (small, medium, and large) and the type of space (small and large) were used as within-subject factors to eliminate the variance between participants and increase the statistical power of those factors. In addition, two levels of spatial context (socializing and a working), and three levels of sky type (overcast sky, and two variations of clear skies with different sun angles) were used as between-subject factors. The studied factors and their levels are listed in .
Table 1. Experimental factors
As this experiment was part of a larger experimental study that also examined the occupants’ perception of façade patterns and the resulting daylight composition, the presented scenes include horizontal stripes placed on the windows of the depicted space. Although the factor façade pattern was part of the statistical analyses, the reporting of this factor is excluded in this paper, as it exceeds the scope of the present study. A wider investigation of façade geometry variations and their perceptual effects is presented in a subsequent dedicated paper by the authors. Specifically, in the reported conditions of the present manuscript, the façade pattern consisted of horizontal stripes representing typical horizontal blinds with a 40% opening ratio to the total glazed surface.
2.2. Experimental design: stimuli
As stated in the Method and Procedure section, simulated images were used to present the experimental stimuli evaluated by the participants using a VR headset. The following subsections describe the setting and selection of the stimuli prior to the generation of the images.
2.2.1. Spaces, context and sky type
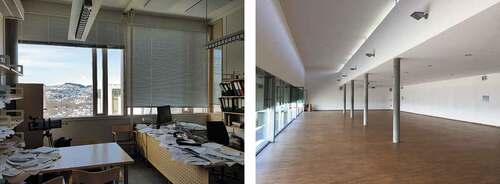
Two rooms facing east, a small space and a large space, were selected to provide contrasting stimuli. In order to ensure the realism of the resulting scenes, existing real spaces were used as a reference for the virtual environments. The real spaces were physically measured to be computer simulated, this means that the dimensions of the spaces and the windows were equal to the ones existing in both spaces. In addition, the light technical measures of the room surfaces including RGB values were registered and used in the simulations. The first space was a single office situated in the Realfagbygget at the NTNU campus in Trondheim, Norway. The dimensions of the office were 4.29 m × 4.70 m, with a height of 3.45 m. The second space was a multi-use space located at the EPFL campus in Lausanne, Switzerland. The dimensions of the room were 21.44 m × 10.88 m, with heights of 3.42 m for the lower area and 5.76 m for the higher area (next to the glazing area). The materials and the colors of all the surfaces in both rooms were registered using a SpectraScan® PR-655 spectroradiometer at NTNU and Konica Minolta CM-600d Spectrophotometer at EPFL, and then used to derive the reflectance and specularity for the specification of material properties in Radiance (see ). presents photos of the two real environments that were used as a basis for the modeled spaces shown in VR.
Table 2. Radiance material properties used in the simulation
Fig. 1. Real environments that served as basis to the modeled spaces shown in VR. To the left: NTNU space (small room), to the right: EPFL space (large room)
For the spatial context factor, the type of furniture placed in the space was used to establish either a social or a working context. For the social context, the furniture consisted of white couches with gray throw pillows, low round coffee tables and white chairs in both spaces. For the work context, desk tables with gray surfaces and black office chairs were used in both spaces. The furniture arrangement of the spaces was naturally different in both scenarios considering the dissimilar dimensions of the rooms. For instance, the small room contained only two desk tables and two office chairs for the work context; whereas the large room consisted of 18 tables and 26 office chairs (see ).
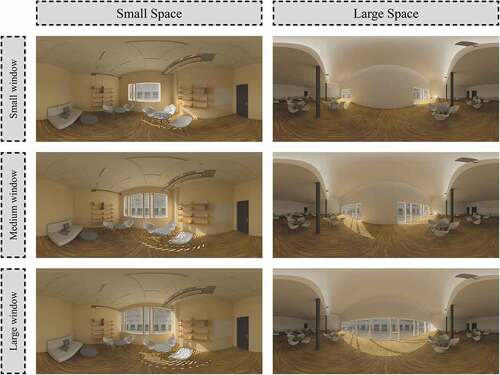
Fig. 2. Perspective views of the rendered equirectangular images to create the fully immersive 360° stereoscopic scenes, partially representing the different stimuli for the variables context and sky type for the small space presented to the experiment participants
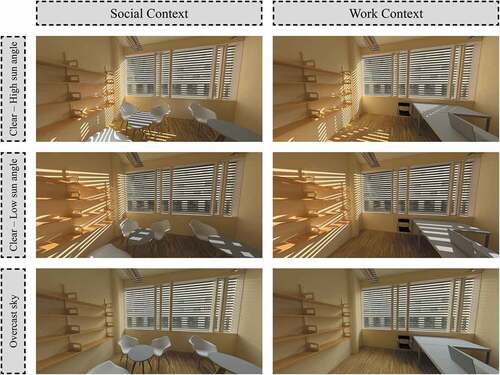
Fig. 3. Perspective views of the rendered equirectangular images to create the fully immersive 360° stereoscopic scenes, partially representing the different stimuli for the variables: context and sky type for the large space presented to the experiment participants
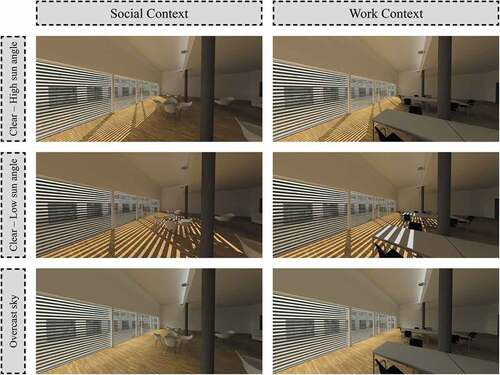
Different sky conditions were used for each of the three levels of the experimental factor sky type: i. an overcast sky generating diffuse daylight conditions, representative of common sky conditions in Trondheim (city at high latitude, 63° N); ii. a clear sky with high sun angle (solar altitude 33.5°, azimuth angle −39.8) that limits the presence of sun patches on the furniture of the rooms; and iii. A clear sky with low sun angle (solar altitude 20.5°, azimuth angle −62.5), i.e. with deeper sunlight penetration in the room, representative of experienced sunny conditions in Trondheim.
2.2.2. Window size
Three different window sizes were selected for the study: Small, Medium and Large. The selection criteria for these sizes were i. for the small window: to create the minimum acceptable window size according to Norwegian regulations, which state that the mean daylight factor in a room must be a minimum of 2% (TEK Citation2017); ii. for the medium window: to calculate a window area that is an average between the small and large window of the experiment; and iii. for the large window: to remain close to the window areas found in the real spaces (see Section 2.2.1).
The same criteria were applied to both spaces. In order to calculate the minimum window area required to obtain a mean daylight factor of 2%, the computer-simulated models of the spaces were analyzed using the software Relux (www.relux.com) and DIVA-for-Rhino (www.diva4rhino.com). Thus, the small space presented the following windows dimensions: 2.55 m × 1.40 m for the small window, 3.60 m × 1.90 m for the medium window, and 4.70 m × 2.09 m for the large window. Likewise, the large space presented the following windows dimensions: two openings of 5.00 m × 2.36 m for the small windows, two openings of 7.40 m × 2.36 m for the medium windows, and the existing dimensions of 19.78 m × 2.36 m for the large window. For the large room, the glazing area was further sub-divided to remain realistic for a room of this size. Indeed, rather than expanding a single central window to fit the targeted dimension -which would not change the visual experience much from the middle of the room-, the individual window parts were distributed across the width of the façade while fitting the total glazing area to the criteria. This way, the experience of window size became more distinct and architecturally convincing (see ).
Furthermore, based on the thresholds for a medium and a high level of access to view out, according to the European Standard EN 17037:2018 (CEN Citation2018), the small window sizes in both rooms correspond to a medium level of view out, while the medium and large window sizes correspond to a high level of view out (see ). Lastly, the large window in the small space is equivalent in terms of horizontal sight angle to the medium window in the large space, allowing a direct comparison between the two spaces.
Fig. 4. Distribution of horizontal sight angle from the observer’s viewpoint across the studied stimuli, according to the European Standard EN 17037:2018. The sight angles are combined in the case of multiple windows
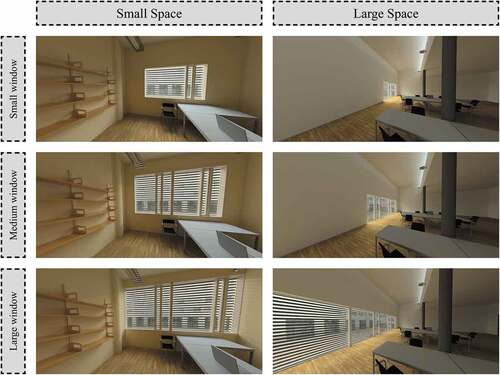
Fig. 5. Perspective views of the rendered equirectangular images to create the fully immersive 360° stereoscopic scenes, partially representing the different stimuli for the variable window size for both spaces presented to the experiment participants. For brevity, the variable window size is shown here only in a work context, and under overcast sky conditions
2.2.3. Generation and presentation of stimuli in virtual reality (VR)
By using VR as an experimental tool, the experimenters retained control over the experimental variables and ensured identical lighting conditions, which greatly reduced the time allocated to each session as multiple scenes could be shown in quick succession. The VR headset used (Oculus Rift CV1) uses a PenTile OLED display with a 2160 × 1200-pixel low persistence organic light emitting diode (resulting in a resolution of 1080 × 1200 pixels per eye), with a refresh rate up to 90 Hz, and a maximum luminance of 98.18 cd/m2. The headset’s weight is 470 g, which – when asked directly about the weight – did not lead to any reporting of discomfort by the participants.
In order to generate the images to be shown in the VR headset, a specific protocol was followed, adapted from the workflow developed in (Chamilothori et al. Citation2019b). First, each space was modeled in 3D using the software Rhinoceros, and then exported, including material properties derived from measurements (cf. ), through the DIVA-for-Rhino 4.0 (Jakubiec and Reinhart Citation2011) toolbar to Radiance 5.2a, currently the most widely validated lighting simulation software tool (Ward Citation1994). By combining all factors (window size, space type, spatial context, and sky type), a total of 36 unique Radiance scenes were generated. These scenes were used to create 360 over-under stereo-equirectangular renderings, using high accuracy rendering parameters (see ) and a resolution of 12960 by 12960 pixels. To increase the quality of the final image, anti-aliasing was performed by reducing the resolution by one third. The resulting high dynamic range (HDR) renderings were tone-mapped with the photographic tone reproduction operator by Reinhard (Reinhard et al. Citation2002) using pfstools.
Table 3. Radiance parameters for the equirectangular projection renderings
These renderings were generated for a view position in the middle of each space, selected to have nearly equal distance to all main wall surfaces. To account for differences in height, four viewpoints that varied in height were created, considering human anthropometric data and corresponding to four ranges of eye height. These four viewpoints corresponded to a standing height up to 1.58 m, from 1.59 m to 1.69 m, from 1.70 m to 1.80 m, and more than 1.80 m, respectively. Using these viewpoints, four variations were created for each of the 36 scenes, resulting in a total of 144 renderings. presents a selection of the rendered equirectangular images of the experimental stimuli, each corresponding to the view from one eye.
Fig. 6. Equirectangular images applied to spheres in the software Unity to create stereoscopic content, following the principle of stereopsis
The final images were imported into the Unity game engine (version 2018.1.0f2) to create immersive scenes that can be projected in VR. Each pair of equirectangular images was applied as textures on two spheres, each corresponding to one eye, in order to create stereoscopic content for each of the experimental stimuli. An Unlit two-sided material was used to ensure that the projected scene was not lit by other sources in Unity. The OVRCameraRig function in Unity was used as a virtual camera placed in the center of each sphere allowing the control of the camera via the Oculus head-tracking feature. Each sphere was projected at the equivalent eye position in the VR headset, resulting in fully immersive 360° stereoscopic scenes.
2.2.4. Monitoring: photometric and colorimetric values of the rendered scenes
The differences in vertical illuminance and color across experimental scenes were measured to ensure that the visual stimuli and the lighting conditions in the scenes presented to the participants remained under control. To this end, the vertical illuminance of the scenes was measured at the center of each lens of the VR headset used in the study. The average height of the 150 Norwegian participants was M = 1.75 m, i.e. close to the reported mean height for men aged 20 to 49 in Norway of 1.80 m (OECD Citation2009). Hence, the scenes corresponding to the second highest eye height (i.e. 1.637 m) were registered. A Beha 93408 Digital lux meter was placed at the center of each Oculus lens, which physical characteristics and dimensions allowed a precise registration of the illuminance coming solely from the lenses. In addition, the measurements were registered in a fully dark room, in which all the room surfaces were black and where there was no daylight opening present. No electrical light was switched on in the room, and the second lens of the headset was covered to assure the only light source registered was the light from the lens being measured at the time. Considering all 36 combinations (i.e. 3 window size × 2 context × 3 sky type × 2 space variations) there was a maximum factor difference of 1.00, which lies under the threshold of 1.50, corresponding to the smallest difference for a noticeable variation in illuminance (CEN Citation2011).
Considering the sensitivity difference of the human eye for diverse colors, the color difference ΔE*ab (CEN Citation2007) between all the 36 rendered scenes was also calculated. This was performed by registering the average RGB values of the equirectangular images and transforming them to the L*a*b color space for calculating the color difference ΔE*ab. Similar to the photometric registration, the scenes corresponding to the second highest eye height were used. The calculated maximum ΔE*ab for the factor window size within the same combination of sky type, space type and spatial context was of 0.59. The calculated maximum ΔE*ab value corresponding to the difference between all 36 combinations, was of 7.86, suggesting that the color differences could be affected by the lighting conditions under different sky types (e.g. larger sunlight patches modifying the visual environment). Considering that sky type was a between-factor, each participant evaluated one sky type only, and thus differences in color product of the sky type are not considered problematic in this study. Moreover, the outcomes of the color difference calculations of the main stimulus of the study which is directly comparable, i.e. window size, lie below the threshold of 2.3 for color differences that is considered noticeable by the human eye (CEN Citation2007).
2.3. Dependent variables
The subjective impressions of a space relate to both emotional and visual aspects and corresponding to non-scalable and scalable properties of the space, as defined by Tiller and Rea (Citation1992). In order to study subjective impressions, eight perceptual attributes were selected to study. The selection was based on the Circumplex model of affect found in Russell’s emotion theory (Russell Citation1980), as adapted from Boubekri et al. (Citation1991) for lighting research. However, these attributes were projected to the environment, rather than the observer (e.g. asking “how interesting is this space” rather than “how interested do you feel”), an approach which is suggested to be a more stable variable (Vogels Citation2007). Regarding the visual appearance of the space, three other attributes were included in our analysis:
Complexity, an attribute that is part of Kaplan’s framework of predictors of preference (Kaplan Citation1987) and has been previously included in lighting studies (Moscoso and Matusiak Citation2017; Veitch and Newsham Citation1998);
Spaciousness which should not be discarded when discussing the experience of a space: in particular, the present study sought also to complement the findings pertaining to how people in high latitudes experience the spaciousness of different rooms (Matusiak Citation2006; Moscoso et al. Citation2015a);
Amount of view: which relates directly to the “Prospect and refuge” theory proposed by Appleton (Citation1975, Citation1988) about environmental preference. According to this theory, the environments need to supply people the ability to observe and/or predict opportunities (prospect) without being seen in order to feel safe (refuge). Although the use of a noun differs from the format of the other questionnaire items, this specific phrasing was based on the literature on the effect of design variables on occupants (Cetegen et al. Citation2008) as well as studies that compared the satisfaction with the amount of view between real and virtual reality environments (Chamilothori et al. Citation2019b). Thus, the amount of view was evaluated focusing on the level of satisfaction, rather than adding an adjective to define the amount of view;
Brightness: in the same vein, the brightness of a space is an essential attribute in the evaluation of the visual environment, as it relates to the amount of light in the space and indirectly to how much information we can get from it (Boyce Citation2003); having established that the experimental stimuli do not differ perceptibly between one another in terms of vertical illuminance at the eye level, the investigation of impressions of Brightness allowed the identification of psychological effects driven from the presented stimuli.
presents the different dependent variables and their respective questionnaire items.
Table 4. Dependent variables and their respective questionnaire items
Since these questions were asked in a VR setting, shows an overview of relevant existing studies which have shown the studied attributes to be reliable when collected in immersive virtual environments. As shown in , the literature shows consistent findings regarding the perceptual accuracy of the attributes studied in the present study for use in virtual reality. Regarding pleasantness, the high agreement among multiple existing studies suggest that the perception of pleasantness can indeed be adequately represented in VR.
Table 5. Overview of relevant VR-based studies on the perceptual accuracy of the studied attributes
However, in the case of brightness, evaluations of this particular attribute in a VR setting have to be interpreted with care due to the limitations of current static tone-mapping algorithms, especially if a scene consists of large bright and dark areas. In general, a tone-mapping algorithm applies typical human brightness perception to an image and reduces the high contrast of an HDR image to a displayable image with low contrast. Currently available tone-mapping algorithms, when applied to 360° rendered scenes, compress the dynamic range of the entire 360° image once, whereas in the real world the eye would adapt to the different luminance levels in a scene depending on the viewing direction. Therefore, the tone-mapped scene would deviate more from real world perception the more the luminance levels differ between the bright and dark areas. An adaptive tone-mapping depending on the viewing direction would probably address this issue. However, for the current study, where only a static tone-mapping algorithm is applied, as discussed in Section 2.2.3, the aforementioned limitations apply. To highlight these limitations, as well as the restricted generalizability of findings related to brightness evaluations, results regarding this attribute will be reported separately.
As the questionnaires were provided in English, it was important to avoid variable interpretations of each attribute by the participants. To that effect, laconic definitions from the Cambridge Dictionary were provided in written form to every participant prior to the experiment. Additionally, if required, the participants had the opportunity to ask clarifications about the definitions to the experimenter. This participant training was carried out prior to the commencement of the experimental session. During the experiment itself, as participants were fully immersed in VR and thus could not interact with a printed questionnaire, the experimenter asked the questions verbally, each time requesting the participant to evaluate the attribute according to a consistent rating scale (see ). The participants answered verbally, and the experimenter recorded their answers. To ensure that people would easily understand the question, a Likert-type scale with a range from 0 to 10 with 5 as a middle point was selected. The participants were requested to choose one integer number from the scale according to their own evaluation before moving on to the next question or stimulus.
2.4. Participants
The participants were recruited via mailing lists, visual advertisements on the NTNU campus, posts on social media groups, and through the university’s intranet site. The participation was voluntary and was rewarded with a movie ticket. The total sample size consisted of 150 participants (64 female, 86 male) between 20 and 49 years old (M = 24.8, SD = 6.5). The total sample size was dictated by power and sample size assessments using the software G*Power (Faul et al. Citation2007), which indicated that the sample size of 150 provided a power of over 0.80. The group of participants consisted of 82% Norwegian citizens and 18% citizens of other nationalities who had lived a minimum of 18 months in Norway, considered sufficient for cultural adaptation in a foreign country (Lysgaard Citation1955; Markovizky and Samig Citation2008).
The participant group consisted of people with and without architectural and/or lighting training, in which 22% had received either or both types of training. Although there was homogeneity of the sample suggesting representativeness of mostly young, educated people, and eligibility criteria were used, there was no further differentiation in the recruitment of the participants. Regarding the eligibility criteria, the vision of the participants was tested to ensure that they did not have any particular vision impairments that could compromise the collected data. Two vision tests were conducted: i. the Stereoscopic Vision Test, making use of the Random Dot 2 Stereo Acuity Test, and ii. a Presbyopia test, making use of a text chart used for presbyopia test measurements placed at 40 cm from the participants’ eyes. Only the data from participants with 32 seconds of arc disparity in the stereoscopic vision test, and with a visual acuity of 0.8 in the presbyopia test were retained for the study. The results of the vision tests were provided verbally to each participant after testing and were not saved nor further reported in any way. In total, 154 participants took part of the experiment. However, four of them did not meet the eligibility criteria and thus, their data was deleted and not considered in the analyses. Although no sensitive information was collected, the study was subject to an application to the Norwegian Social Science Data Services (NSD – Norsk Samfunnsvitenskapelig Datatjeneste), considering that personal information was collected (i.e. age, gender, nationality) and the vision tests were sought to be performed. The NSD granted the approval to perform the study.
2.5. Experimental procedure
The 150 participants took part in the experiment in individual experimental sessions. Only the experimenter and one participant at a time were present in the experimental room. Experimental sessions were conducted in a single office located at NTNU – Gløshaugen campus during daytime. Due to the position of the experimental room in campus, the thermal and acoustic conditions were in their majority considered comfortable, i.e. inside temperature of around 21°C, and low outside noise. When asked directly by them as possible disturbing factors, no participant reported any discomfort relating to the acoustic or the thermal conditions. The participants booked their sessions according to their availability and in coordination with the experimenter. The same protocol was maintained in each of the sessions. Participants were welcomed to the experiment, where they received practical information (i.e. experimental protocol, approximate duration of the experiment, their rights as participants as well as the ethical considerations of the data treatment), task information (i.e. the evaluation of the spatial impression), as well as the verbal and written instructions for the experiment (i.e. use of rating scale, use of the VR headset).
Having read all necessary information and having had time to have their questions answered, the participants who were willing to contribute to the collection of data were invited to sign a consent form. After being tested for their vision, (see Section 2.4), the collection of data started by filling a demographic questionnaire including gender, age, nationality and period of residence in Norway. The participant-training phase was carried out by reading the definitions of the attributes to be evaluated, followed by questions, if any. Next, while the experimenter adjusted the scene selection according to the participant’s height (see Section 2.2.3), the participant put on the VR headset. The first scene that was shown was a black screen with the logos of the two collaborating education institutions (i.e. NTNU and EPFL), used to verify the correct adjustment of the headset. Following this step, a monochromatic scene was presented, corresponding to the mean RGB value of all stimuli that would be presented to that participant. This scene was projected for a minimum of 15 seconds to allow adaption to the brightness in the VR. Following the monochromatic scene, the stimuli exposure started by showing the experimental scene, awaiting 30 seconds to let the participant explore the scene visually then starting the verbal questionnaire. This procedure was repeated for all scenes. The presentation of the stimuli followed a randomization principle to avoid sequential contraction bias (Zieliński et al. Citation2008).
In total, the participants evaluated 12 stimuli, divided in 2 parts as follows: one part designed to evaluate window size (i.e. window size block) and the other part designed to evaluate the façade patterns (i.e. patterns block, see Section2.1). The two parts were also presented to the participants in a randomized order. There was a short break of a few minutes between the two parts to avoid fatigue, in which the participants were requested to remove the headset to let the experimenter inquire about any discomfort related to the use of VR that they might have had. No participant reported any discomfort during the course of the experiment. After the break, the participants put on the headset again and the same protocol was repeated (i.e. adaptation scene, stimulus presentation, verbal questionnaire) until the end of the experimental session. Although there was no time limit for the participants to evaluate each stimulus, the experimenter noticed that the time taken to complete the sessions had an average of 30 minutes, with a minimum session time of 25 minutes and a maximum of 35 minutes.
3. Results
3.1. Analysis strategy
Considering the number of independent variables, dependent variables, and the mixed design, the data was analyzed using a Linear Mixed Model (LMM) analysis (McCulloch et al. Citation2011). The basis of an LMM is that the responses of the experiment’s participants are a sum of the fixed and random effects, in which the fixed effects are the variables of interest that could affect the population mean, whereas the random effects are not of primary interest but can influence the covariance structure of the data. This statistical model offers more flexibility in the analysis, as it includes both between-subjects and within-subjects design, and both fixed and random effects: this allowing a wide variety of variance-covariance patterns to be modeled accounting for eventual missing data or imbalance of conditions. (Seltman Citation2012).
It was first necessary to evaluate the statistical power and the statistical assumptions, as requested in social sciences and lighting research (Uttley Citation2019). To this end, the sample size and the power of the study were analyzed using the G*Power software, yielding a power over 0.80, calculated as a priori type of power analysis for F tests – linear multiple regression for the five analyzed predictors (i.e. factors). As discussed in Section 2.3, the data was measured using a Likert-type scale with a range from 0 to 10. Although Likert scales are usually considered to be ordinal, the use of 11-point Likert scales, specifically from 0 to 10 and including a middle point, have been recommended to be used to approximate to interval scales (Wu and Leung Citation2017). As a result, in this analysis we employ LMM, which has been previously used to analyze ordinal data in lighting research (de Kort and Smolders Citation2010; Smolders et al. Citation2012).
Assessments of statistical assumptions were performed to confirm the suitability of LMM for the present study. Considering that LMM is a statistical test that uses the F-distribution, the assumptions are similar to regression analysis, with the difference that the normality should be tested in the residual errors in addition to all the test variables (Field Citation2009; Verbeke and Molenberghs Citation2001). The assumption of normality was verified by a visual inspection of normal probability plots of the variables and the residuals. Furthermore, the violations of the assumptions of correlation and homoscedasticity were tested with the software Stata (Cox Citation2004) and showed that the data did not present autocorrelation and was homoscedastic. Finally, the assumption of independence of the data was treated through a randomization principle in the experimental design. Not only was the order of presentation of the stimuli to each participant randomized, but also the order of the questions.
The data was analyzed using the command syntax MIXED with the IBM® SPSS® Statistics software version 25.0.0.1 (Field Citation2009). In the experiment presented in this paper, the fixed factors were the independent variables previously indicated, i.e. Window Size, Space Type, Spatial Context, and Sky Type. As mentioned previously, façade pattern was also a fixed factor as it was included in the experimental design, however, it will be reported in subsequent articles by the authors (see Section 2.1). In addition, due to the focus of the study, three interactions of interest were treated as fixed effects, i.e. the interactions between Window Size with Space, Context and Sky Type separately. The random factor was considered to be the participants of the experiment, as they represented an effect associated with the experimental procedure. Most importantly, this allowed to include and test the variance in the between-subjects ratings. Additionally, the presentation order of the window size and space was included as two different covariates in the model to account for possible confounding variables (e.g. if seeing first a specific window size and/or a specific space influenced the participants’ ratings). Effect sizes are reported using conditional R2, which indicates the amount of the total variance in each of the dependent variable that is explained by both fixed and random effects (Nakagawa et al. Citation2017), and were computed using the function Linear Regression with the software SPSS. To account for the multiple comparison analyses, experiment-wise significance levels were adjusted using the Bonferroni correction, from an initial criterion of significance α of 0.05. Considering that there were five fixed factors, two covariates, three studied interactions and eight questions, the new experiment-wise alpha level was of 0.05/[(5 + 2 + 3) x 8] = 0.0006. In the case of statistically significant effects of the main factors, post-hoc pairwise comparisons analyses were conducted using the command syntax/EMNEANS in the software SPSS. The pairwise analyses were based on the estimated marginal means with a 0.05 significance level, applying the Šidák adjustment for multiple comparisons in order to control the Type I error rate (Šidák Citation1967).
3.2. Linear mixed model analysis
In the following sections, we first present the findings related to the main studied attributes, followed by those on perceived brightness, and lastly, we examine possible effects of confounding factors.
3.2.1. Pleasantness, interest, excitement, complexity, spaciousness, and satisfaction with the amount of view
The numerical results of the mixed model analysis considering the factors window size, context, sky type and space are reported in . Findings suggest that window size has a statistically significant effect on the majority of the attributes. Specifically, these results suggest that the window size significantly influenced how pleasant, interesting, exciting, complex and spacious the space was perceived, as well as the level of satisfaction with the amount of view. The factor space was also found as being statistically significant for the majority of the attributes. The attributes calmness and complexity were not influenced by the factor space. Along this line, the attribute calmness was not influenced by any of the factors of the study. The factor sky type did not have a statistically significant effect on any of the studied attributes. Lastly, the factor context was only shown to influence the impressions of spaciousness.
Table 6. Effects of the factors window size, context, sky type, and space on seven of the studied attributes (N = 150)
Additionally, three binomial interactions of interest were studied: i. Window size x Context, ii. Window size x Space, and iii. Window size x Sky type. Results showed that the interactions between the window size and context and between window size and sky type did not influence the evaluations of any studied attribute. The interaction between Window size and Space presented a significant effect on one attribute only, i.e. Amount of view (F (2, 1375.291) = 7.873, p < .0001).
As indicated previously, the conditional R2 for each of the LMM analysis (i.e. each dependent variable) were calculated. Considering that the attribute calmness was not influenced by any of the independent variables, this attribute was not further analyzed. According to the benchmarks given by Ferguson (Citation2009) in which 0.04, 0.25 and 0.64 represent small, medium and large effect size respectively, all the attributes presented small effect sizes; i.e. pleasantness (R2 = 0.039), satisfaction with the amount of view (R2 = 0.081), interest (R2 = 0.202), excitement (R2 = 0.163), complexity (R2 = 0.177), and spaciousness (R2 = 0.243), the latter approaching a medium effect.
To allow comparison with the literature, descriptive statistics (means and standard deviations) for all studied variables are reported in . Moreover, graphical representations of the data depicting the preferences for window size in relation to space are shown for each dependent variable in .
Table 7. Data means and standard deviation of the variables Window size and Context – M (SD). (N = 150)
Table 8. Data means and standard deviations of the variables Sky Type and Space – M (SD). (N = 150)
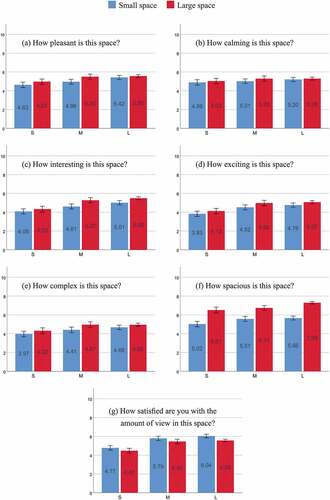
Fig. 7. Graphical bar plots representing the mean values for each studied attribute in the Y-axis (0 corresponds to “not at all” and 10 to “very”). The X-axis represents the variable Window Size. The different colors represent the variable Space. Error bars: SD
3.2.2. Pairwise comparisons
Considering that window size, a main factor of study in the present paper, presented a significant effect in nearly all attributes, post-hoc pairwise comparisons were carried out to further investigate the preferences among the three different window sizes. There were in total seven independent pairwise analyses, not including the attribute calmness as it did not present statistically significant results. Seven different matrices corresponding to the remaining attributes influenced by the window size are shown in . For ease, only the significant differences are reported.
Table 9. Post-hoc pairwise comparisons of the three window sizes for seven of the studied attributes. Estimates β (comparison: row minus column) and adjusted significance levels are shown for pairs with significant differences (N = 150)
The pairwise comparisons of the three different window sizes showed no significant differences between the medium and the large windows for the evaluations of the attributes Interest, Excitement and Complexity. In general, the evaluations increased scores as the size of the windows increased. Specifically, the exposure to the medium windows produced significantly higher scores in the 11-point scales, compared to the small windows across all studied variables, while the exposure to the large windows produced higher scores than the medium windows for the impressions of Pleasantness, Spaciousness, and Satisfaction with the amount of view in the space. In addition, findings demonstrate a consistent significant difference between small and large window sizes for all studied attributes, with higher ratings for the large windows in comparison to the small windows. This was more evident in the evaluation of the attribute Satisfaction with the amount of view, in which the scores are estimated to increase over 1.0 unit in a 11-point rating scale when a person is exposed to a large window compared to a small window. This difference is translated to an 16% increase in the satisfaction with the amount of view. The numerical results of the pairwise comparisons are in alignment with the graphical plots presented in , in which the scores of the window size increase as the size of the windows is enlarged. The interpretation of these graphical plots in relation to the size of the space and to the pairwise comparisons are further discussed in Section 4.
3.2.3. Brightness
As mentioned in Section 2.3, the perceived brightness in VR might be affected by the applied tone-mapping workflow, where the 360° image was tone-mapped as a whole and not dynamically and dependent on the participant’s view direction. For this reason, which limits the validity and generalizability of the brightness evaluations in VR, the results of this attribute are discussed separately in this section.
presents the descriptive statistics (means and standard deviations) of the perceived brightness for the presented scenes across variations of Window Size, Context, Sky Type, and Space.
Table 10. Data means and standard deviation of brightness evaluations of the variables window size, context, sky type, and space – M (SD). (N = 150)
The LLM analysis showed a significant effect of Window Size (F(2, 1344.025) = 116.368, p < .0001) and Space (F(1, 1401.033) = 21.852, p < .0001) on brightness evaluations. To complement these findings, shows the means and standard deviations of brightness evaluations across variations in Window Size and Space. No significant effect was found for the factors Context or Sky Type (all ps > 0.258). Similarly, no significant effects were found for the studied interactions Window size x Context, Window size x Space, and Window size x Sky type. The calculation of the conditional R2 for the LMM showed a small effect size also for the case of Brightness (R2 = 0.089).
Fig. 8. Graphical bar plots representing the mean values for the evaluations of brightness in the Y-axis (0 corresponds to “not at all” and 10 to “very”). The X-axis represents the variable Window Size. The different colors represent the variable Space. Error bars: SD
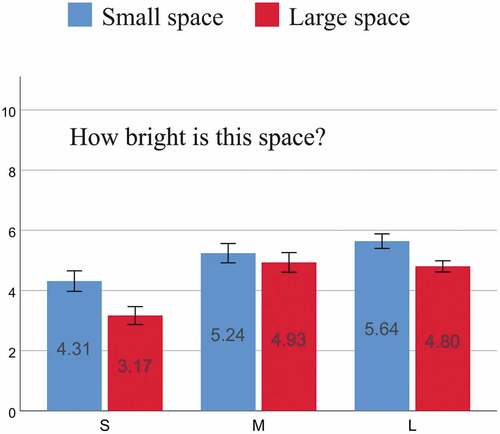
Following the significant effect of Window Size on brightness evaluations, post-hoc pairwise comparisons were conducted for all studied variations. Findings show significant differences between all possible pairs, with the largest effect between the small and large window sizes. In particular, the space was evaluated as brighter when a participant was exposed to a large window compared to the equivalent small window (β = 1.225, p < .0001), considering the 11-point rating scale, the estimated change equal to 11% increase in perceived brightness. The medium window led also to significantly higher evaluations of reported brightness compared to the small window ((β = 0.997, p < .0001); and the large window led to an estimated increased of 0.228 units when compared to the medium window (β = 0.228, p = .015).
3.3. Effects of possible confounding factors
Possible effects of confounding variables were analyzed to test the robustness of the results. For this purpose, the presentation order of two stimuli was analyzed: window size and space. These were treated as covariates in the LMM and the previously calculated Bonferroni-corrected factor was used (i.e. new alpha level = 0.0006). Although there were neither effects of presentation order of the window size for any of the dependent variables (all ps > 0.193) nor effects of presentation order of the space for nearly all dependent variables (minimum non-significant p = .160), there was a small effect of presentation order of the space for the perceived spaciousness of the room (p < .0001, R2 = 0.022).
This result suggests that the order effect, known to affect preference judgments (Bruine de Bruin and Keren Citation2003; Englund and Hellström Citation2012) – especially when there is a limited sample of the stimuli with unique physical features, like here with two space options –, played only a minor role in this experiment. Nonetheless, the results concerning the perceived spaciousness of a room should be treated with caution but, by no means, completely disregarded as it contributes to theory and literature: indeed, the results align with the findings by Bokharaei and Nasar (Citation2016), who indicated that the size of the first experienced space had an observable impact on how people evaluated the spaciousness of the succeeding stimulus, e.g. showing a larger preference for a room that was preceded by a smaller one.
4. Discussion
The present study examines the user perception and preference toward window sizes from a multi-factor perspective, considering the impact of the sky type, the context, and the type of space in high latitudes conditions.
Findings show that the window size significantly influence the perceptual impressions of the presented spaces, with the large window size leading to more positive evaluations of how pleasant, interesting, exciting, bright, complex, and spacious the space was perceived, as well as to higher levels of satisfaction with the amount of view, answering the first research question of the study. In accordance with previous research (Butler and Biner Citation1989; Matusiak Citation2006; Moscoso et al. Citation2015a), a clear effect of window size was anticipated on how the esthetic attributes of a room would be evaluated. The results show that this was the case for nearly all the studied attributes.
Overall, the large windows were the most preferred window size by the participants (see ), confirming the numerical results of the pairwise comparisons, in which the scores of the windows increased as the window size was enlarged. Indeed, in previous research held at high latitudes, larger windows are generally preferred by the users (Moscoso et al. Citation2015a); including visually impaired participants sensitive to high light levels, who have shown a preference for rooms with middle large windows (Matusiak et al. Citation2009). The preference toward large windows in the present study suggests that the use of a minimum DF of 2% as the sole criterion for the design the window size is not necessarily preferred by occupants in Norway. Regarding the average daylight factors in both rooms, the medium-sized windows achieved DF estimates of 3.8% and 3.2%, whereas the large windows achieved DF estimates of 5.1% and 4.2% in the small and the large room respectively. In the same vein, when considering the horizontal sight angle, which is introduced in the new European standard, the small window sizes, which correspond to a medium level of access to view out, were shown to lead to more negative evaluations of the space compared to both the medium and the large window sizes, which correspond to a high level of access to the view out.
Considering the second research question, findings showed a statistically significant interaction between window size and space for the reported satisfaction with the amount of view, where all three window sizes were rated higher in the small space than in the large space (see ). These results imply that the preference for window size in relation to the amount of view stems from the size of the space in which the window is located. Moreover, in the present study, the large window in the small space and the medium window in the large space were found to be equivalent in terms of horizontal sight angle (around 80 degrees, see ), both presenting high levels of view out, confirming the recommended sight angles according to the European Standard EN 17037:2018 (CEN Citation2018). Additionally, both factors (i.e. window size and space), considered separately, had an effect on the perception of spaciousness. This result is in agreement with previous findings in the literature, in which space size and window size had medium and large effects respectively on the perception of spaciousness of a room (Bokharaei and Nasar Citation2016).
Spaciousness has been largely discussed in the literature as a variable influenced by the physical properties of a room (Stamps Citation2007, Citation2008, Citation2010a). Indeed, the results presented in this paper confirm that the window size, context and the size of the space influence the perception of spaciousness of a room. These results are in alignment with Bokharaei and Nasar (Citation2016), who found that the perceived spaciousness is dependent on size, lightness, window size and amount of furniture. Lastly, in contrast to the authors’ expectations, the sky type did not influence any of the studied attributes, nor was the interaction between window size and sky type significant. This could have been elicited by the very similar vertical illuminances measured among the stimuli presented to the participants, or the design of the experiment, where sky type was a between-subject factor. Nevertheless, this finding is positive for the applicability of the findings in real-world applications, as it implies that the window size influences the perception of a space independently of the lighting conditions.
5. Limitations and future work
This paper discusses the importance of window size on the subjective impressions of daylit spaces. The information provided represents a contribution to current discussions regarding building regulations in relation to the window size, and it provides discussion on how a change in window size affects human perception of interior spaces. However, in order to provide a more precise and trustworthy information, it seems important to indicate the limitations present in the study, together with recommendations for future research.
The use of virtual reality, while allowing complete control over the presented visual stimuli, restricted the luminance range of the scenes. This is a principal limitation of the present study, as in the adopted experimental setup it is not possible to induce visual or thermal discomfort, leading to scenes that are inherently comfortable. As such, although the findings of this work are valid in terms of the perceptual effects of the different studied factors, further studies in real environments are still needed.
Moreover, as a result of the experimental design and the VR method used in the present study, which limited the exposure time to the presented scenes, the evaluation of the experimental variables was studied at an immediate response level only. Additionally, although the participants had the possibility to see in 360°, the evaluations of the scenes were undertaken from a fixed position in the space (i.e. in the middle of both spaces), thus limiting the movement and natural exploration of the scenes by the participants. More advanced simulations, e.g. including 3DoF or 6DoF (degrees of freedom), in which the participants can have freedom of movement in the space and the possibility to evaluate the scene for a longer time span, should be subject of future research. As discussed in Section 2.3, in the workflow to create the immersive scenes used in the present study we employed currently available static tone-mapping operators, which perform an average tone-mapping of the 360° image, instead of adaptive tone-mapping according to the viewing direction of the user in VR. This tone-mapping procedure has important limitations, especially in scenes with large bright and dark areas (as might be the case in our conditions with large window sizes) and restricts the robustness and generalizability of findings related to the perceived brightness. Additional studies are encouraged to develop view-dependent dynamic tone-mapping operators and examine further the perceptual accuracy of brightness perception in immersive VR environments.
Due to the focus of the study on people living in high latitudes, the results cannot be generalized to other demographic groups. In order to examine the presence of possible regional effects, further studies comparing the studied variables in different latitudes are reported by the authors in a subsequent dedicated publication.
6. Conclusions
The present paper examined the influence of window size on the perception of different spaces in the context of high latitudes, as well as the impact of the lighting conditions, the context, and type of space on this perception. Findings showed that to achieve spaces that are evaluated as being more pleasant, interesting, exciting, bright, spacious, and having a satisfactory amount of view, medium to large window size seem to be preferred. However, the preferences for the window size, specifically for the satisfaction with the amount of view, seem to be dependent on other factors, e.g. the size of the space. This suggests that it becomes crucial to study multiple factors together with the window size, and that further work is necessary to establish the preference for window size and how these preferences impacts the perception of a space.
The study underscores the importance of the window size on the user evaluations of spaces. Nonetheless, further studies with other window dimensions should be undertaken. In times when new building standards regarding windows are being developed and deeply discussed in sustainable agendas, the user perspective is a crucial parameter, which cannot be disregarded. The findings presented in this paper contribute in the discussion and in the development of new aspects for regulations and for architectural practice regarding window size in Nordic countries.
Acknowledgments
This paper is the result of a collaboration between the Light & Colour Centre at the Faculty of Architecture and Design, Norwegian University of Science and Technology - NTNU in Trondheim, Norway and the Laboratory of Integrated Performance in Design at the Ecole polytechnique fédérale de Lausanne – EPFL, in Switzerland. The authors gratefully acknowledge the contributions of John Sølve Tyssedal and Christian Klöckner with help on the statistical analyses, Krzysztof Orleanski for helping with the technical equipment, and Einar Næss Jensen from the HPC group at NTNU for assisting with the renderings of the study providing high performance computer services.
Disclosure statement
No potential conflict of interest was reported by the authors.
Additional information
Funding
References
- Abd-Alhamid F, Kent M, Bennett C, Calautit J, Wu Y. 2019. Developing an innovative method for visual perception evaluation in a physical-based virtual environment. Build Environ. 162:106278.
- Appleton J. 1975. The experience of Landscape. London (UK): Wiley.
- Appleton J. 1988. Prospects and refuges revisited. In: Nasar JL, editor. Environmental aesthetics: theory, research, and application. New York (NY): Cambridge University Press. p. 27–44.
- Bokharaei S, Nasar JL. 2016. Perceived spaciousness and preference in sequential experience. Hum Factors. 58(7):1069–1081.
- Boubekri M, Hulliv R, Boyer L. 1991. Impact of window size and sunlight penetration on office workers’ mood and satisfaction: a novel way of assessing sunlight. Environ Behav. 23:474–493.
- Boyce P. 2003. Human factors in lighting. 2nd ed. New York (NY): Taylor and Francis.
- Bruine de Bruin W, Keren G. 2003. Order effects in sequentially judged options due to the direction of comparison. Organ Behav Hum Decis Process. 92(1–2):91–101.
- Butchart M, Symon A, Carr V. 2006. Window view and the birth environment. Paper presented at the Proceedings of the 19th Annual Conference of the International Association for People-Environment Studies; Alexandria, Egypt.
- Butler DL, Biner PM. 1987. Preferred lighting levels: variability among settings, behaviors, and individuals. Environ Behav. 19:695–721.
- Butler DL, Biner PM. 1989. Effects of setting on window preferences and factors associated with those preferences. Environ Behav. 21(1):17–31.
- Butler DL, Steuerwald BL. 1991. Effects of view and room size on window size preferences made in models. Environ Behav. 23(3):334–358
- Cauwerts C, Bodart M. 2011. Investigation of 3D projection for qualitative evaluation of daylit spaces. Paper presented at the 27th International Conference on Passive and Low Energy Architecture: architecture and Sustainable Development, PLEA 2011; Louvain-la-Neuve, Belgium.
- CEN. 2007. 11664-4:2008: colorimetry - part 4: CIE 1976 L*a*b* Colour space Tech. Rep. Brussels (Belgium).
- CEN. 2011. Light and lighting - lighting of workplaces - Part 1: indoor work places (EN 12464-1-2011). Paris (France): European Committee for Standardization.
- CEN. 2018. Daylight in buildings. In: European standard NS-EN 17037:2018. Brussels (Belgium): European Committee for Standardization.
- Cetegen D, Veitch JA, Newsham GR. 2008 Oct 7–10. View size and office luminance effects on employee satisfaction. Paper presented at the Proceedings of Balkan Light 2008; Ljubljana, Slovenia.
- Chamilothori K, Chinazzo G, Rodrigues J, Dan-Glauser E, Wienold J, Andersen M. 2019a. Subjective and physiological responses to facade and sunlight pattern geometry in virtual reality. Build Environ. 150:144–155.
- Chamilothori K, Wienold J, Andersen M. 2019b. Adequacy of immersive virtual reality for the perception of daylit spaces: comparison of real and virtual environments. LEUKOS. 15(2–3):203–226.
- Cosma G, Ronchi E, Nilsson D. 2016. Way-finding lighting systems for rail tunnel evacuation: a virtual reality experiment with Oculus Rift®. J Transp Saf Secur. 8(Issue sup 1: Railroad Safety Special Issue):101–117.
- Cox NJ. 2004. Speaking stata: graphing model diagnostics. Stata J. 4(4):449–475.
- de Kort YAW, Smolders K. 2010. Effects of dynamic lighting on office workers: first results of a field study with monthly alternating settings. Light Res Technol. 42(3):345–360.
- Dogrusoy IT, Tureyen M. 2007. A field study on determination of preferences for windows in office environments. Build Environ. 42(10):3660–3668.
- Englund MP, Hellström Å. 2012. If you have a choice, you have trouble: stimulus valence modulates presentation-order effects in preference judgment. J Behav Decis Making. 25(1):82–94.
- Faul F, Erdfelder E, Lang A-G, Buchner A. 2007. G*Power 3: a flexible statistical power analysis program for the social, behavioral, and biomedical sciences. Behav Res Methods. 39(2):175–191.
- Ferguson CJ. 2009. An effect size primer: a guide for clinicians and researchers. Prof Psychol. 40(5):532–538.
- Field A. 2009. Discovering statistics using SPSS. 3rd ed. London (UK): SAGE Publications Ltd.
- Fontoynont M. 2002. Perceived performance of daylighting systems: lighting efficacy and agreeableness. Solar Energy. 73(2):83–94.
- Franz G, von der Heyde M, Bülthoff HH. 2005. An empirical approach to the experience of architectural space in virtual reality - exploring relations between features and affective appraisals of rectangular indoor spaces. Autom Constr. 14(2):165–172.
- Grynning S, Gustavsen A, Time B. 2011. Solar shading systems and thermal performance of windows in nordic climates. Paper presented at the 9th Nordic Symposium on Building Physics; Tampere, Finland.
- Heydarian A, Becerik-Gerber B. 2017. Use of immersive virtual environments for occupant behaviour monitoring and data collection. J Build Perform Simul. 10(5–6):484–498.
- Higuera-Trujillo JL, Lopez-Tarruella Maldonado J, Linares Millan C. 2017. Psychological and physiological human responses to simulated and real environments: a comparison between photographs, 360° panoramas, and virtual reality. Appl Ergon. 65:398–409.
- Inui M, Miyata T. 1973. Spaciousness in interiors. Light Res Technol. 5(2):103–111.
- Inui M, Miyata T. 1977. Spaciousness, behavior and the visual environment. J Light Visual Environ. 1(1):59–63.
- Jakubiec A, Reinhart CF. 2011. DIVA 2.0: integrating daylight and thermal simulations using Rhinoceros 3D, DAYSIM and EnergyPlus. Paper presented at the Proceedings of Building Simulation (IBPSA); Sidney, Australia.
- Kaplan S. 1987. Aesthetics, affect, and cognition: environmental preference from an evolutionary perspective. Environ Behav. 19:2–32.
- Lam WMC, Ripman CH. 1977. Perception and lighting as formgivers for architecture. 4th ed. New York (NY): McGraw-Hill.
- Leder S, Newsham GR, Veitch JA, Mancini S, Charles KE. 2016. Effects of office environment on employee satisfaction: a new analysis. Build Res Inf. 44:34–50.
- Lysgaard S. 1955. Adjustment in a foreign society: norwegian fulbright grantees visiting the United States. Int Social Sci Bull. 7:45–51.
- Maffei L, Masullo M, Pascale A, Ruggiero G, Romero VP. 2016. Immersive virtual reality in community planning: acoustic and visual congruence of simulated vs real world. Sustainable Cities Soc. 27:338–345.
- Mania K. 2001. Connections between lighting impressions and presence in real and virtual environments: an experimental study. Paper presented at the AFRIGRAPH ‘01 Proceedings of the 1st international conference on Computer graphics, virtual reality and visualisation Camps Bay; Cape Town, South Africa.
- Mania K, Robinson A. 2004. The effect of quality of rendering on user lighting impressions and presence in virtual environments. Paper presented at the VRCAI ‘04 Proceedings of the 2004 ACM SIGGRAPH international conference on Virtual Reality continuum and its applications in industry; Singapore.
- Markovizky G, Samig Y. 2008. The process of immigrant adjustment: the role of time in determining psychological adjustment. J Cross Cult Psychol. 39(6):782–798.
- Matusiak B. 2006. The impact of window form on the size impression of the room. Full-scale studies. Archit Sci Rev. 49(1):43–51.
- Matusiak B, Fosse P, Sørgjerd AE. 2009. Daylighting/lighting preferences for subjects with visual impairment and for subject with normal vision. A full-scale study in a room laboratory. Norges teknisk-naturvitenskapelige universitet. Trondheim (Norway): Fakultet for arkitektur og billedkunst.
- McCulloch CE, Searle SR, Neuhaus JM. 2011. Generalized, linear, and mixed models. Vol. 651. 2nd ed. Hoboken, NY: John Wiley & Sons, Inc.
- Moscoso C, Matusiak B. 2017. Aesthetic perception of a small office with different daylighting systems. Indoor Built Environ. 27(9):1187–1202.
- Moscoso C, Matusiak B, Svensson UP. 2015a. Impact of window size and room reflectance on the perceived quality of a room. J Archit Plann Res. 32(4):294–306.
- Moscoso C, Matusiak B, Svensson UP, Orleanski K. 2015b. Analysis of stereoscopic images as a new method for daylighting studies. ACM Trans Appl Percept. 11(4):Article 21.
- Nakagawa S, Johnson PCD, Schieltzeth H. 2017. The coefficient of determination R2 and intra-class correlation coefficient from generalized linear mixed-effects models revisited and expanded. J R Soc Interface. 14(134):20170213.
- Natephra W, Motamedi A, Fukuda T, Yabuki N. 2017. Integrating building information modeling and virtual reality development engines for building indoor lighting design. Visualization Eng. 5(19). doi:10.1186/s40327-017-0058-x
- OECD. 2009. Society at a Glance 2009: OECD social indicators. Paris (France): OECD Publishing.
- Ozdemir A. 2010. The effect of window views’ openness and naturalness on the perception of rooms’ spaciousness and brightness: a visual preference study. Sci Res Essays. 5(16):2275–2287.
- Parpairi K, Baker NV, Steemers KA, Compagnon R. 2002. The luminance differences index: a new indicator of user preferences in daylit spaces. Light Res Technol. 34(1):53–66.
- Peel MC, Finlayson BL, McMahon TA. 2007. Updated world map of the Köppen-Geiger climate classification. Hydrol Earth Syst Sci. 11(5):1633–1644.
- Pellegrino A. 1999. Assessment of artificial lighting parameters in a visual comfort perspective. Light Res Technol. 31(3):107–115.
- Regulation concerning technical requirements of buildings in Norway (TEK17). 2017. Chapter 13: indoor climate and health - §13-7 Light. Oslo (Norway): Direktoratet for Byggkvalitet.
- Reinhard E, Stark M, Shirley P, Ferwerda J. 2002. Photographic tone reproduction for digital images. Paper presented at the Proceedings of the 29th Annual Conference on Computer Graphics and Interactive Techniques; New York (NY): SIGGRAPH ’02.
- Rockcastle S, Amundadottir M, Andersen M. 2017a. Contrast measures for predicting perceptual effects of daylighting in architectural renderings. Light Res Technol. 49(7):882–903.
- Rockcastle S, Andersen M. 2014. Measuring the dynamics of contrast & daylight variability in architecture: a proof-of-concept methodology. Build Environ. 81(November):320–333.
- Rockcastle S, Chamilothori K, Andersen M. 2017b. Using virtual reality to measure daylight-driven interest in rendered architectural scenes. Paper presented at the Proceedings of Building Simulation 2017; San Francisco (CA).
- Russell JA. 1980. A circumplex model of affect. J Pers Soc Psychol. 39(6):1161–1178.
- Sawyer AO, Chamilothori K. 2019. Influence of subjective impressions of a space on brightness satisfaction: an experimental study in virtual reality. Paper presented at the SimAUD 2019 - Symposium on simulation for architecture + urban design; Atlanta (GA).
- Šidák Z. 1967. Rectangular confidence regions for the means of multivariate normal distributions. J Am Stat Assoc. 62(318):626–633.
- Seltman H. 2012. Experimental design and analysis. Pittsburgh (PA): Carnegie Mellon University.
- Smolders KCHJ, de Kort YAW, Cluitmans PJM. 2012. A higher illuminance induces alertness even during office hours: findings on subjective measures, task performance and heart rate measures. Physiol Behav. 107(1):7–16.
- Stamps AEI. 2007. Evaluating spaciousness in static and dynamic media. Des Stud. 28(5):535–557.
- Stamps AEI. 2008. On shape and spaciousness. Environ Behav. 41(4):526–548.
- Stamps AEI. 2010a. Effects of area, height, elongation and color on perceived spaciousness. Environ Behav. 43(2):252–273.
- Stamps AEI. 2010b. Effects of permeability on perceived enclosure and spaciousness. Environ Behav. 42(6):864–886.
- Stamps AEI, Krishnan VV. 2006. Spaciousness and boundary roughness. Environ Behav. 38(6):841–872.
- Statens Bygningstekniske Etat. 2011. Veiledning om tekniske krav til byggverk §13–12. Lys. [In Norwegian. Eng: Guidance on technical requirements for construction work §13–12. Light.] Direktoratet for Byggkvalitet, Oslo, Norway.
- Tiller DK, Rea MS. 1992. Semantic differential scaling: prospects in lighting research. Light Res Technol. 24(1):43–52.
- Ulrich RS, Simons RF, Losito BD, Fiorito E, Miles MA, Zelson M. 1991. Stress recovery during exposure to natural and urban environments. J Environ Psychol. 11(3):201–230.
- Uttley J. 2019. Power analysis, sample size, and assessment of statistical assumptions - improving the evidential value of lighting research. LEUKOS. 15:143–162.
- Veitch JA. 2001. Psychological processes influencing lighting quality. J Illum Eng Soc. 30(1):124–140.
- Veitch JA, Galasiu AD. 2012. The physiological and psychological effects of windows, daylight, and view at home: review and research agenda. Ottawa (ON): National Research Council of Canada, Institute for Research in Construction.
- Veitch JA, Newsham GR. 1998. Lighting quality and energy-efficiency effects on task performance, mood, health, satisfaction, and comfort. J Illum Eng Soc. 27(1):107–129.
- Verbeke G, Molenberghs G. 2001. Linear mixed models for longitudinal data. New York (NY): Springer.
- Vogels I. 2007. Atmosphere metrics. development of a tool to quantify experienced atmosphereIn: Westerink J, Ouwerkerk M, Overbeek TJM, Pasveer WF, editors. Probing experience: from assessment of user emotions and behaviour to development of products. Vol. 8 of Phillips Research Book Series. Dordrecht (The Netherlands): Springer Science & Business Media. p. 246.
- Wang N, Boubekri M. 2010. Investigation of declared seating preference and measured cognitive performance in a sunlit room. J Environ Psychol. 30:226–238.
- Wang N, Boubekri M. 2011. Design recommendations based on cognitive, mood and preference assessments in a sunlit workspace. Light Res Technol. 43(1):55–72.
- Ward GJ. 1994. The RADIANCE lighting simulation and rendering system. Paper presented at the Proceedings of the 21st annual conference on computer graphics and interactive techniques; New York (NY): SIGGRAPH ´94.
- Wu H, Leung S-O. 2017. Can likert scales be treated as interval scales? - A simulation study. J Soc Serv Res. 43(4):527–532.
- Yildirim K, Akalin-Baskaya A, Celebi M. 2007. The effects of window proximity, partition height, and gender on perceptions of open-plan offices. J Environ Psychol. 27(2):154–165.
- Yoon J, Byun E, Chung NS. 2000. Comparison of space perception between a real environment and a virtual environment. Paper presented at the Proceedings of the Human Factors and Ergonomics Society Annual Meeting; Los Angeles (CA). doi:10.1177/154193120004400508.
- Zieliński S, Rumsey F, Bech S. 2008. On some biases encountered in modern audio quality listening tests - a review. J Audio Eng Soc. 56(6):427–451.