
ABSTRACT
A good color description starts with the availability of accurate color-matching functions (CMFs) or cone fundamentals (CF). Recent work indicates a discrepancy between visual metamers and those calculated using the standard CIE CMFs or other CMF sets, especially for narrowband sources. In the current study, 54 observers (varying in age, gender, ethnicity, and eye color) performed a series of achromatic color-matching experiments with a 10° stimulus using eight different narrowband primaries under an immersive, perceptually neutral (4673 K) viewing conditions. The reference stimulus was provided by a 70 cd/m2 gray (4613 K) card illuminated by a spectrally broadband light source. The results confirm that substantial and significant differences between experimental and calculated metamers exist, particularly when a short wavelength primary (404 nm) is included and especially for the CIE 1931 2° CMFs. It is found that the primary set characterized by the peak wavelengths 636 nm, 521 nm, and 447 nm, which are close to those of typical RGB primaries widely used in industry, results in the most stable matching performance across all CMF sets. Finally, in addition to the impact of primary wavelength and CMF set, the potential effect of age, gender, ethnicity, and eye color has also been investigated. The effect of age on the color matches is found to be significant and is due to differences in spectral sensitivity of young and old observers with respect to the blue primary; the impact of observer gender, ethnicity, and eye color, on color-matching accuracy is not significant.
1. Introduction
Color-matching functions (CMFs) are one of the most fundamental aspects of color science and color perception. In basic colorimetry, they are used to specify and quantify the color of a stimulus viewed under a defined set of (fixed) viewing conditions in terms of psychophysical variables such as the (X, Y, Z) tristimulus values, luminance, dominant wavelength, purity, etc. (CIE Citation2011; Wyszecki and Stiles Citation2000).
However, it has become increasingly apparent that there are undeniable discrepancies between visual matches and the matches calculated using the existing CMFs (Asano et al. Citation2016b; Csuti and Schanda Citation2008, Citation2010; David et al. Citation2019; Flecy and Smet Citation2015; Houser and Hu Citation2004; Long and Fairchild Citation2014; Ohno et al. Citation2019; Oicherman et al. Citation2008; Oulton Citation2004a; Ramanath Citation2009; Sarkar Citation2011a; Thornton Citation1997, Citation1998), especially for matches made by narrowband primaries (Asano et al. Citation2016b; David et al. Citation2019; Houser and Hu Citation2004; Ohno et al. Citation2019; Oulton Citation2004a; Sarkar Citation2011a; Thornton Citation1997, Citation1998).
The following subsections give a brief overview of some noteworthy CMF sets and past research on color-matching accuracy including the impact of rod intrusion (Thornton Citation1997; Thornton and Fairman Citation1998) and the failure of Grassmann’s law of additivity (Lozano and Palmer Citation1969; Oicherman Citation2007; Oleari and Pavesi Citation2008; Oulton Citation2004a; Stiles and Burch Citation1959; Stiles and Wyszecki Citation1962; Thornton Citation1992a, Citation1998; Zaidi Citation1986) and observer metamerism (Alfvin and Fairchild Citation1997; Asano Citation2015; Asano et al. Citation2016b; Haddad et al. Citation2009; Jain et al. Citation2010; Long and Fairchild Citation2014; North and Fairchild Citation1993; Rich and Jalijali Citation1995; Sarkar Citation2011b; Shaw and Fairchild Citation2002; Shi et al. Citation2016; Thornton Citation1992a).
1.1. Color-matching functions
CMFs are derived based on color-matching experiments, whereby observers try to match the color of a photopic reference stimulus (test field) by adjusting a match field composed of an additive mixture of three independent primaries. In some cases, a match cannot be made, and light must be added to the test field, resulting in negative values for the color-matching functions. Although any three independent primaries can be used, they are often chosen to be monochromatic; with one red (Long wavelength), one green (Mid wavelength), and one blue (Short wavelength) light. Experimental CMFs, derived with a particular primary set, can be converted by a linear transform to CMFs corresponding to other primaries, such as the CIE X, Y, Z primaries, or to CMFs which represent the L, M, S cone fundamentals.
The determination of CMFs is subject to a number of critical properties of color matching, the most important ones being proportionality and additivity (Grassmann Citation1854; Krantz Citation1975). CMFs differ from observer to observer due to individual physiological differences (Sarkar et al. Citation2011). For practical purposes, an average or standard observer is therefore defined based on empirically derived CMFs of a large number of individual observers. Several CMF sets have been proposed, often to account for differences in the viewing conditions under which they were derived, e.g. 2° versus 10° field-of-view (FOV) match fields.
The oldest CMF set, and also the most widely known and used, is the CIE 1931 2° standard colorimetric observer (CIE Citation2004). This CMF set was derived based on the work of Wright (Wright Citation1929) and Guild (Guild Citation1931), as well as on the CIE 1924 V(λ) photopic luminous efficacy curve. The latter was required, as no information was available on the radiance of the stimuli in the Wright and Guild experiments. However, the short wavelength part of the CIE 1924 V(λ) curve is, remarkably, based on the least sensitive and therefore least plausible data available at the time (Stockman and Sharpe Citation1999). The V(λ) function, which is known to be too insensitive at short wavelengths (CIE Citation1986; Stockman and Sharpe Citation1999) is one of the reasons for the reported predictive errors of the CIE 1931 CMFs, especially for spectrally narrowband “blue”-rich spectra (Csuti and Schanda Citation2008, Citation2010). To better represent average human color vision, Judd (Judd Citation1951) proposed a new set of 2° CMFs, which were later modified by Vos (Vos Citation1978), resulting in the Judd–Vos Modified 2° CMFs (Vos Citation1978). Although often used in vision science, they were never standardized by the CIE. In 1955, Stiles and Burch presented a new set of color-matching data for small field 2° stimuli (Stiles and Burch Citation1955) based on the average of 10 observers, but these CMFs are rarely used. A few years later, in 1959, a large set of centrally viewed 10° CMFs, composed of data for 49 observers, were published (Stiles and Burch Citation1959). Although not often used directly, they do form the basis for the CIE 1964 10° CMFs (CIE Citation1986), for the cone fundamentals proposed by Stockman and Sharpe (Stockman and Sharpe Citation2000) and thus for the physiologically relevant CMFs proposed by the CIE in 2006 (CIE Citation2006). The CIE 1964 10° supplementary standard colorimetric observer (CIE Citation2004) is also based on the 10° CMFs collected by (Speranskaya Citation1959), which are probably rod contaminated.
To remedy some of the issues with the CIE 1931 and CIE 1964 standard observers and to provide CMFs that are more closely related to estimates of cone spectral sensitivities, the CIE proposed the 2006 2° and 10° Physiological Observers (CIEPO06). CIEPO06 is based largely on the work of Stockman (Stockman and Sharpe Citation2000). It also includes a model to calculate CMFs for intermediate FOVs and observers of different ages by taking into account changes in absorption in the macular pigment, lens and other ocular media, and changes in peak densities of the photopigments (CIE Citation2006). Note that using an observer’s age does not necessarily result in CMFs that are representative for that particular observer, due to unsystematic observer variation and because one or more age-independent physiological factors have not been included (Sarkar et al. Citation2009). One study even suggested that the usefulness of CIEPO06, in its current form, to predict the average observer for a given age group may be limited (Sarkar et al. Citation2011).
Based on the CIE physiological observer CIEPO06, an extended individual colorimetric observer model was proposed by Asano et al. (Asano et al. Citation2016a) to simulate the CMFs of individual observers. In addition to observer age and field size, eight additional physiological parameters were included to account for individual differences with an average observer of a given age and for a specified field size. The eight parameters are: difference in lens pigment density, macular pigment density and optical densities, and peak wavelength shifts of the L, M, S cone photopigments. To simulate typical individual observers Asano (Asano et al. Citation2016a) identified the variability of each of the physiological parameters based on an extensive literature study. The model has been implemented in Matlab (Asano et al. Citation2016a) and in the LuxPy python toolbox for lighting and color science (Smet Citation2018). An advantage of the Individual Colorimetric Observer model of Asano is that it allows to estimate the expected observer variability in predicted visual matches by calculating the XYZ covariance matrix as proposed by Nimeroff (Nimeroff et al. Citation1961). It also allows to investigate the impact of observer CMF variability on all sorts of measures, such as the IES color fidelity index values (Murdoch and Fairchild Citation2019).
For very large matching fields (50° FOV), a CMF set was derived by Hu et al. (Hu and Houser Citation2006). The authors reported substantial differences with the 10° CMFs, whereby subjects were less and more sensitive to short and long wavelengths, respectively (Hu and Houser Citation2006).
1.2. Discrepancy between visual and calculated matches
In ideal colorimetry, two visually matching stimuli will have equal XYZ tristimulus values under identical photopic viewing conditions. However, various studies have shown substantial discrepancies between visual and calculated metamers and that they tend to depend on the peak wavelengths of the matching primaries.
For example, Thornton (Thornton Citation1992a) reported significant discrepancies in Maxwell color matches for stimuli with a 10° FOV when using multiple narrowband primaries. He did experiments with three types of primary sets, referred to as PC (prime colors: 452–533-607 nm), AP (anti-prime colors: 497–579-653 nm), and NP (non-prime colors: 477–558-638 nm). Thornton defined prime colors as the wavelengths that act most strongly (i.e. to “which the normal human visual system responds most strongly per watt of power content input to the pupil” (Thornton Citation2000)) in additive mixtures of light, anti-prime as those that are least-sensitive, while non-primes are those that fall in between (Thornton Citation1999). Large chromaticity errors, as calculated in the CIE 1964 10° x10, y10 chromaticity diagram, were found when the primary peak wavelength fell in one of the following wavelength regions: violet (414 nm), blue-green (500 nm), yellow (570 nm) or deep red (677 nm). He also found that for PC matching primaries the computed chromaticity errors were minimized (Thornton Citation1992a). In 1995, Abraham (Ábrahám et al. Citation1995) tested Thornton’s findings over a wider age range using primaries similar to Thornton’s AP set and PC set, and found that there was a chromaticity difference between the mean matches made by old and young observers for the AP primary set, but not for the PC set. Houser (Houser and Hu Citation2004) also explored these earlier findings and investigated individual differences in color matching. They found that the matching primary set had a statistically significant effect on matching results and that the interaction between the primary set and observer age was significant. Hu and Houser (Hu and Houser Citation2006) used primary sets whereby the peak wavelengths of two of the three primaries (453 nm, 533 nm, and 601 nm) were close to one of Thornton’s prime color spectral primaries and whereby the peak wavelength of the remaining primary varied between 413 nm and 689 nm. They found that field size has a large impact on the shape of the derived CMFs, and that neither the CIE 1931 nor the CIE 1964 standard observers can represent large field size CMFs.
A possible cause of the discrepancies between Thornton’s visual matches (Thornton Citation1992a) and the matches calculated using the CIE CMFs is a rod-photoreceptor intrusion, as the luminance of the matching field in Thornton’s 1992 experiment was set at 30–40 cd/m2. Therefore, Thornton (Thornton Citation1997) did another Maxwell matching experiment with the same visual field size (10°) as before, but using a much higher luminance level in the order of 80 cd/m2. He found that under these bright experimental conditions, where no rods participated, the errors on the tristimulus values computed using the CIE 1964 10° standard observer were as large as that in earlier work (Thornton Citation1997, Citation1998).
Another possible reason for the reported discrepancies between visual and calculated matches is a failure of Grassmann’s law of additivity. Grassmann’s law of additivity shows that if light A matches light B, light C matches light D, the addition of light A and C should match the combination of B and D. For an additive mixture of color stimuli, only their tristimulus values should, therefore, be relevant, not their spectral compositions. However, Stiles (Stiles and Burch Citation1959) reported that, in his experiment, the results of one-third of the subjects showed a substantial failure of additivity. Stiles and Wyszecki made field trials for a 10° observer and came to suspect “that Grassmann’s laws of color mixture do not strictly apply” (Stiles and Wyszecki Citation1962). Furthermore, Lozano and Palmer (Lozano and Palmer Citation1969) reported that only 25% of the observers showed almost perfect additivity for all the test colors, while deviations from additivity, especially for the short wavelength tristimulus value, were found for the others. Non-additivity was also reported by Wyszecki and Stiles (Wyszecki and Stiles Citation2000) who measured CMFs by both Maxwell and maximum saturation methods. They found that the deviations between CMFs measured by the two methods are caused by a failure of additivity when wavelengths shorter than 450 nm are involved. Similar results were found by Zaidi (Zaidi Citation1986) who also used the maximum saturation method. Thornton (Thornton Citation1992a, Citation1997; Thornton and Fairman Citation1998) also mentioned that Grassmann’s law of additivity did not hold when they tried to match a test light with a primary set when each primary in this set is replaced by a light mixture of a second set of primaries. Oulton (Oulton Citation2004b) further analyzed the non-additivity in Thornton’s experiments and also found that the failure of additivity is strongly spectrally localized, while there seems to be little effect for broadband spectra. However, Oleari (Oleari and Pavesi Citation2008) did a series of foveal color-matching experiments and confirmed that, at a luminance level lower than 23 cd/m2, Grassmann’s law performs well for color matching using stimuli with a 1.8° FOV. As very few rods and ipRGCs are distributed in this region, no participation of these receptors in the visual mechanism is to be expected under the experimental condition which might be the reason why Grassmann’s law works for color matches in Oleari’s experiments.
Furthermore, differences in the color-matching method adopted in different experiments could result in different matching accuracy. According to Grassmann’s laws of additive color mixing, the maximum-saturation method and the Maxwell method should produce identical measures of the observer’s color-matching functions (Fairchild Citation1989). However, if the validity of the linear laws in general trichromatic color matching is questionable, then no single set of color-matching functions will correctly predict all matches (on average). The Maxwellian matching method – where an observer makes repeated matches to the same white/gray stimulus and which keeps the local adaptation state of the observer constant throughout the experiment – tends to give better predictions for color matches to a reference white, while for matches to highly saturated colors, the maximum saturation method – which has been used to derive the data on which the CMFs are based – might have better performance (Thornton Citation1992b, Citation1992a).
So far, the validity of Grassmann’s law remains an open question. The studies mentioned thus far focus on discrepancies of either the CIE 1931 or 1964 CMFs. However, even for the most recent CIEPO06 CMFs (CIE Citation2006), discrepancies between visual and calculated metamers have been reported (Asano et al. Citation2016b; David et al. Citation2019; Long and Fairchild Citation2014; Ohno et al. Citation2019; Sarkar Citation2011a). For example, Sarkar (Sarkar et al. Citation2011) mentioned that the CIEPO06 model also leads to errors in CMF predictions. Asano (Asano Citation2015) continued Sarkar’s work with LED primaries that, according to simulations, either maximize (with peak wavelengths 592 nm, 521 nm, 400 nm) or minimize (657 nm, 506 nm, 469 nm) observer variability. According to both authors’ findings, the choice of primaries has a big impact on observer variability, especially the violet-blue (400 nm blue primary) and the deep red (657 nm red primary) are regions that generate substantially larger observer variability (Asano Citation2015; Sarkar Citation2011a). Asano also reported larger variability when matching to neutral reference colors (Asano Citation2015).
Furthermore, by combining Asano’s individual observer model with Sarkar’s categorical observer technique, an optimal set of categorical observers can be produced for all spectral power distributions (SPDs) (Asano and Fairchild Citation2020). Asano (Asano and Fairchild Citation2020) found that compared to the use of one single average observer, the predicted matching inaccuracy can generally decrease 66% by using 10 categorical observers, while the required number of categorical observers strongly depends on the SPD structure (with up to 50 categorical observers being required for highly structured spectra). David (David et al. Citation2019) characterized the CIEPO06 model by a series of achromatic matching (target D65) experiments using several blue primaries (440 nm, 450 nm, and 460 nm), and found that the perceived chromaticity strongly depends on the observer’s age and the structure of the SPD. These results are confirmed by (Ohno et al. Citation2019), who compared the predictive performance of the CIE 1931 CMFs with that of the latest CIEPO06 cone fundamental based CMFs (CIE Citation2006).
1.3. Present study
In the present study, color-matching data were gathered for a group of 54 observers (varying in age, gender, ethnicity, and eye color) by using multiple primary sets that differed in peak wavelength, with the aim of investigating the accuracy and observer variability of the CIE 1931 2°, 1964 10°, 2006 2°, and 2006 10° CMF sets. Peak wavelengths of the primaries were based on some of the findings reported earlier, while taking into account their availability in a standard Thouslite LED cube: deep violet 404 nm (but excluding ultraviolet light), prime blue 447 nm (PC), non-prime blue 475 nm (NP), blueish green 502 nm (AP), prime green 521 nm (PC), non-prime red 636 nm (NP), orange 597 nm (nearest primary to 579 nm in AP), and deep red 673 nm (longest wavelength available in deep red region). Each of the primary sets was composed of a reddish, greenish, and bluish primary. Maxwellian color matches were made for a stimulus with a 10° FOV in a bi-partite matching setup, in which observers were asked to match the color appearance of a test field composed of several spectral lights with a gray, spectrally broadband reference field. To minimize the effect of rod intrusion on color-matching accuracy, the luminance of both matching field and background was kept at 70 cd/m2. In the analysis, in addition to the impact of primary wavelengths and CMF set, the possible effects of observer age, gender, ethnicity, and eye color on the average of individual color matches were also investigated.
2. Methods
2.1. Experimental setup
Maxwellian symmetric matching experiments were performed using a specially designed viewing booth that allows to present spectrally tunable stimuli in reflective/object appearance mode and visually immersive viewing conditions. A schematic of the viewing booth is shown in .
Fig. 1. Experimental setup: (a) overall configuration of the viewing box; (b) view from the observer’s position of the inside of the box and the specially designed bipartite 10° circular matching and reference fields composed of a mirror (reflecting light from the LEDcube) and a reference sample (illuminated by a filtered halogen), respectively. The bi-partite field was physically elliptically shaped, with the ellipse shape tuned to the tilt angle and observer position such that it appeared circular. (c) A chin rest was installed in front of the viewing box to fix the observer’s viewing direction.
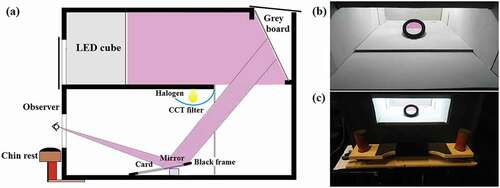
During the experiments, observers had to adjust the color appearance of the top half of a 10° bipartite circular field such that it matched that of the reference bottom half (see ). A 10° field size was chosen to particularly test the CIE 1964 10° and new CIE 26 10° CMFs, because for many practical applications a 10° field-of-view is more appropriate.
The reference field was provided by a gray (spectrally neutral) card illuminated by a broadband halogen filtered by a LEE 201 CCT conversion filter. The reference field chromaticity is slightly above the blackbody locus (Duv = 0.0056) at 4613 K. A broadband reference was explicitly chosen, as in previous studies these types of stimuli were found to be quite stable with regard to observer metamerism (Oulton Citation2004b).
The matching field was composed of a slightly tilted mirror that reflected the light of a gray diffusive board that was uniformly illuminated by three selected channels of a calibrated spectrally tunable light source (a Thouslite LEDcube with 15 10-bit channels, see ). The gray diffuse plate and LEDcube were positioned in the top half of the viewing box which was covered with highly reflective spectrally flat, non-fluorescent material and which served as a mixing chamber to provide uniform illumination on the diffusive cardboard. To minimize the impact on the adaptation field (gray background) and reference field, both illuminated by a filtered halogen lamp, the light reflected from the diffusive cardboard passed through a small aperture in the bottom half of the viewing booth. Pilot studies (Flecy and Smet Citation2015; Li et al. Citation2019a, Citation2019b) showed that this mirror set-up can provide an indistinguishable stimulus with the same luminance and color as an opaque, reflective card illuminated by the filtered halogen (although the act of adjusting the color of one part of the bi-partite field might have broken this illusion).
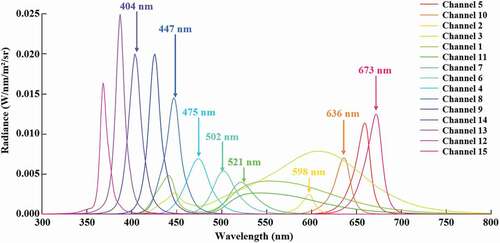
Fig. 2. Spectral radiance of the 15 channels of the Thouslite LEDcube as measured in the match field mirror from the observer position. The channels selected as matching primaries are also indicated.
The luminance of both fields needs to be as high as possible to minimize rod intrusion (Ábrahám et al. Citation1995; Asano Citation2015; Shapiro et al. Citation1994; Thornton Citation1998). Limited by the output of the tunable source, it was set at a value of 70 cd/m2, which is also characteristic for the luminance typically found in building interiors (Hu and Houser Citation2006).
The shape of the match and reference fields was specially designed to take the tilt angle and observer viewing angle into account such that the observer sees a circular 10° bipartite field at a viewing distance of 0.45 m.
To fix the adaptation state of the observer and minimize adaptation to the stimulus, the bipartite field was presented within a uniform gray surround with a correlated color temperature (CCT) of 4673 K and a Duv of 0.0050. The average luminance of the surround was 70 ± 2 cd/m2. The contribution of the changing color of the match field on the adaptation state is considered negligible, taking into account the much larger field size (>150°) of the gray surround (Ma et al. Citation2018). A 2° black frame surrounded the 10° bipartite field to minimize the potential effects of simultaneous contrast and induction (Blackwell and Buchsbaum Citation1988). Note that most other studies (for example, Sarkar’s (Sarkar Citation2011a) and Asano’s (Asano Citation2015) recent work) present their match and reference fields in aperture mode under dark adapted conditions. However, such conditions are less representative of everyday viewing conditions and have been shown to lead to higher observer variability (Smet et al. Citation2014) and a different perception of color (Braun et al. Citation1996; Cuttle Citation2008; Henley and Fairchild Citation2000; Judd Citation1961; Katoh et al. Citation1998; Kuriki Citation2015).
A calibrated Ocean Optics QE65 Pro spectrometer, coupled to a Bentham (TL305) telescopic measuring head, was used to measure the spectral radiance of the match and reference field after the observer completed all matches. The stability of the LEDcube was verified in a series of measurements across a 5 hour period. For all channels, the Δu’v’ chromaticity and relative luminance difference during that period were, respectively, less than 0.001% and 0.02% to the values measured after a 15 minute warm-up. A gray setting of the same chromaticity and luminance as the broadband target remained stable over a 90-minute period (about the maximum time observers needed to accomplish all their matches) to within less than 0.0007 u’v’ units and 0.001 cd/m2 (measurement accuracy).
2.2. Matching primaries
The spectral radiance generated by the channels of the LEDcube, as measured from the observer’s position is plotted in .
Eight channels were chosen as matching primaries: three long wavelengths (“red”), two medium wavelengths (“green”), and three short wavelengths (“blue”) channels. An overview of their peak wavelengths, full-width-half-maxima and maximum radiance (LED channel driven at maximum current) are given in . The primaries were chosen to provide a large gamut size at 70 cd/m2, to have a substantial gap in wavelength space between their peaks and based on Thornton’s work on prime colors (Thornton Citation1992b). Additionally, as future research will focus on observer variability, the selection of primaries was also guided by Asano (Asano Citation2015) and Sarkar’s work (Sarkar Citation2011a) work.
Table 1. Overview of primary properties
A first set of primaries was therefore selected with channel peak wavelengths (447 nm, 521 nm, and 636 nm) closest to Thornton’s PC primaries of the normal human visual system. Another set of primaries (636 nm, 502 nm, 475 nm) was chosen to be similar to Asano’s primary set with minimal variability. Note that the 475 nm primary is also close to the blue primary (477 nm) in Thornton’s work (Thornton Citation1992b) and which is also often used in modern LED-based products. Other primaries were chosen to sample Thornton’s visually inefficient (anti-prime) violet, blue-green, yellow, and deep red wavelength regions and Asano’s critical primaries providing larger variability: 404 nm, 597 nm, and 673 nm (which is the longest wavelength available in deep red region).
These primaries were combined in eight primary sets, each composed of one red, one green, and one blue primary: P1: 636–502-447 nm, P2: 636–502-404 nm, P3: 636–521-447 nm, P4: 636–521-404 nm, P5: 598–521-447 nm, P6: 598–521-404 nm, P7: 673–521-447 nm, P8: 636–521-475 nm. An overview of the peak wavelengths, full-width-half-maxima (FWHM) and maximum radiance (LED channel driven at maximum current) of chosen primaries are given in .
2.3. Experimental procedure
At the start of the experiment session, observers were briefed about the goal of the study and were given verbal instructions on the procedure, during which time they could adapt to the viewing conditions. Observers were asked to make several symmetric matches by adjusting the color of the match field (provided by the reflected light of the LED cube illumination) until it matches that of the gray reference field. To familiarize themselves with the matching procedure, observers would make a trial match prior to the start of the actual experiment. While matching, they could navigate in the CIE 1976 u’v’ chromaticity diagram by using a regular joystick (Logitech Extreme 3D Pro). After finishing a color match, observers were asked to press a button on the joystick to save their final setting. As in most color-matching experiments (Asano Citation2015; Houser and Hu Citation2004; Sarkar Citation2011a), observers were instructed to ignore any potential differences in color of the central region (due to Maxwell’s spot) of the bipartite field.
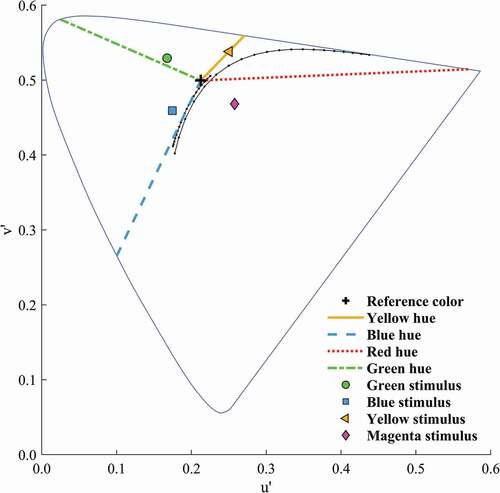
Each primary set was matched four times, starting from a different initial chromaticity. Starting chromaticity coordinates were chosen to be close to the unique hues and close to, but within, the smallest gamut achievable by all primary sets at 70 cd/m2. To further minimize starting bias (Ma et al. Citation2019), the four starting chromaticity coordinates were tilted slightly away from the unique hue lines, in order to have them more evenly distributed along the hue circle centered on the D65 chromaticity (see ). During the experiment, each observer made a total of 33 matches (8 primary sets x 4 starting points + 1 trial). The order of the primary sets and starting points was randomized for each observer. To avoid fatigue, observers could request a break, after which they were required to re-adapt to the background conditions before continuing their matches. Typical experiment duration was approximately 1 hour, but ranged between 30 and 90 minutes.
Fig. 3. Starting points (color-filled markers) chosen based on unique hues, distributed evenly and closed to the hue lines (indicated by the yellow, red, green, and blue lines) and having the same distance to the D65 reference white point (black cross). The long and short black lines are plots of the blackbody and daylight loci, respectively.
2.4. Observers
Fifty-four observers (24 females, 30 males, average age: 33 ± 11 years) with normal color vision, as tested by the Ishihara 24 plate test and the FM 100 hue test, participated in the experiments. Among them, there were 12 observers between 15 and 24 years old (6 males, 6 females), 22 observers between 25 and 34 years old (12 males, 10 females), 12 observers between 35 and 44 years old (6 males, 6 females), and 8 observers older than 45 years (6 males, 2 females). Sixteen of them are from Asian countries (Vietnam, China, and Malaysia, etc.), the others from European countries (Belgium, France, Italy, England, Spain, etc.). The observers were asked to take off their glasses while doing the experiment, to avoid potential bias by any UV-filtering that might occur. Their eye color was also registered after the experiment for further analysis: there were 31 observers with brown eyes, 15 observers with blue eyes, and 8 observers with green eyes.
3. Results and discussion
The 54 observers made a total of 1782 matches during the whole experiment. For each match, the spectral radiance was measured immediately after each experiment session. As each observer made visual matches for each primary set for four different starting stimuli, which were chosen symmetrically to avoid the starting bias, an average visual match was calculated by taking the mean of the four measured match spectra. Results are reported and discussed in the following subsections. In the first subsection, some general findings on the impact of primary set and CMF set on the average match chromaticity and the matching accuracy (difference with the reference chromaticity) are discussed. In the second section, the impact of primary set and CMF set (within-subject factor) – as well as possible other effects, such as observer age, gender, ethnicity, and eye color (between-subject factor) – on the chromaticity values of the visual matches has been statistically verified using a repeated measures MANOVA. Significant main effects and interactions were followed-up by post-hoc contrast tests.
3.1. Impact of primary set and CMF set
The X, Y, Z tristimulus values of the visual matches made by the 54 observers and the matching target (reference field) were calculated using the CIE 1931 2° (CIE Citation2018), CIE 1964 10° (CIE Citation2018), and CIEPO06 2° and CIEPO06 10° (CIE Citation2006) color-matching functions (CMFs) and were converted to CIE 1976 u’v’-like chromaticity coordinates for analysis. Note that the same XYZ-to-u’v’ transform was used for all CMF sets, even though technically this one was only developed for the 1931 CMF set (but see later). Furthermore, remark that from a physiological point of view the use of 2° CMFs is not appropriate for stimuli with a 10° field of view, as 2° CMFs correspond to foveal vision where the cone distribution density and macular pigment optical density (in addition to other factors, such as chromatic aberration, receptive and perceptive field sizes, area summation, etc.) is different from the more eccentric retinal 10° location. However, 2° CMFs were included to highlight the importance of these differences and because, considering these physiological differences, their results can provide useful clues and confirmation as to why some primary sets show such substantial differences and poorer predictive performance for 10° matches. The mean chromaticity and the standard error (SE) ellipses over all observers are plotted in the CIE 1976 u’v’ diagram in for each primary set and for each CMF under consideration. The different CMFs are indicated by different colors. The numerical details of the center chromaticity of the SE ellipses are specified in in Appendix A. The standard error (SE) ellipses were calculated from the standard deviation (SD) ellipses by correcting the (inverse) covariance matrix describing them by a factor of n, which is the number of data points used to calculate the covariance matrix (e.g. the number of observers).
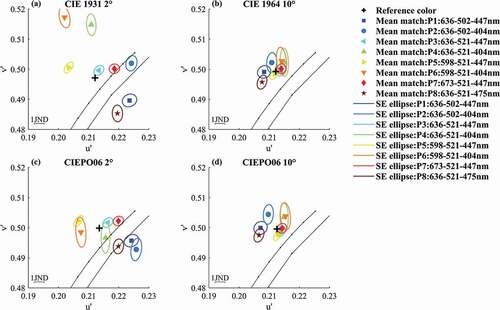
Fig. 4. Mean CIE 1976 u’v’ chromaticity of matches (colored crosses) and their SE ellipses (n = 54 observers) for different primary sets (subplots a–h) and different CMF sets. The observer matches are plotted with lighter color (small markers), shown in the background. The color-filled markers represent the reference (target) chromaticity calculated for the four different CMF sets (Blue: CIE 1931 2° CMFs, Red: CIE 1964 10° CMFs, Purple: CIEPO06 2° CMFs, Green: CIEPO06 10° CMFs). The long and short black lines are plots of the blackbody and daylight loci, respectively.
First of all, it is clear from that the primary set P3 with peak wavelengths at 636 nm, 521 nm, and 447 nm (close to Thornton’s stable PC primaries of 450 nm, 530 nm, and 610 nm) shows mean matches that are much more stable across changes in CMF set than other primary sets, suggesting that these primaries are less sensitive to generating metameric differences when using several CMF sets. Note that the primaries used in this “stable set” are typical of LED RGB-primaries (Csuti and Schanda Citation2008) and are widely used both in research and industry (Asano et al. Citation2016b). Of all wavelengths involved, these are also closest to the monochromatic red (650 nm), green (530 nm), blue (460 nm) used by Wright (Wright Citation1929) and to the peak wavelengths (645.2 nm, 526.3 nm, and 444.4 nm) of the primaries used in the Stiles & Burch (Stiles and Burch Citation1955, Citation1959) experiments. These experiments generated data that was used in the derivation of the CIE 1931 2° and 1964 10° CMFs, respectively, and as such, of the CIEPO06 CMFs too. This offers a plausible explanation for the quite accurate performance of all CMFs for this particular primary set. Another possible reason is that these peak wavelengths correspond closely to the wavelengths for which individual CMFs show the least variance. It is worth noting that recent work on color matching (Sarkar Citation2011b; Sarkar et al. Citation2010, Citation2009) in which similar primaries have been used therefore possibly underestimates the discrepancies when different primaries are being used. Knowing that P3 (and P7) is “stable” for changes in observer CMFs can be very useful when designing technological products involving additive mixing of spectrally narrow-band lights, such as in lighting and all sorts of displays, to minimize the effects of observer metamerism.
Secondly, as can be seen from , most primary sets show quite different distributions of the mean matches across the chromaticity diagram. The differences depend on which primary is switched in a set. For example, switching the 521 nm (near-PC) green primary (P3, P4) to the 502 nm (near-AP) primary (P1, P2) mainly causes a split between the 2° and 10° CMFs along the u’-direction, with the 10° and 2° matches moving to the lower and higher u’ values, respectively (compare with 4a,e). These results confirm those of Thornton (Thornton Citation1992c) that switching from PC to AP primaries causes larger errors in computed chromaticity. On the other hand, switching the near-NP 636 nm red primary (P3) with the near-PC 598 nm primary (P5) and 673 nm primary (P7) does not substantially affect the 10° matches, but causes a shift of the 2° matches to lower and higher u’ values, respectively (compare with 4c,d). Furthermore, a switch of the 447 nm blue primary (P1, P2, P3) with a 404 nm primary (P2, P4, P6) causes a shift of the match chromaticity toward higher v’ values for all CMFs, except for those of the CIEPO06 2°, which show an opposite trend toward lower v’ values (compare with 4e–g). Of all CMFs, the CIE 1931 2° show the largest upward shift. However, a switch of the 447 nm blue primary (P3) with a 475 nm primary (P8) causes a shift of the match chromaticity toward lower v’ values for the CIE 2° CMFs, while those of the CIE 10° CMFs remain quite stable in the v’ direction; in the u’ direction the mean matches tend to shift toward slightly lower values for 10° CMFs, while the 2° CMFs matches shift toward substantially higher values (compare with 4h). Note that the 475 nm peak also has a spectral width that is almost double that of the 447 nm one, which could be an additional contributing factor. In addition, a larger matching inaccuracy can be noticed for primary set P8 compared to P3, which has a blue NP (475 nm) and PC primary (447 nm), respectively.
Finally, it can be seen that the smooth broadband spectrum of the reference field results in very similar chromaticity values for all CMF sets with an average color difference DEu’v’ of 0.0010 ± 0.0006. This indeed suggests that all the data calculated with different CMFs can be safely presented in the same 1976 u’v’ chromaticity diagram without generating any substantial errors due to the “observer metamerism” between the average standard observers represented by those sets. On the other hand, for a given (narrowband) primary set, some of the mean visual matches calculated by different CMF sets are substantially different, as indicated by the large spread of the mean matches (dots) and the non-overlapping SE ellipses in . These figures also indicate a substantial color difference between computed visual matches and the reference (target) chromaticity, despite the observer’s task to make visually indistinguishable matches to the reference field. The mean and standard deviations of the chromaticity differences, DEu’v’, between the matching chromaticity and the reference chromaticity, calculated using the four CMF sets, are presented in .
Table 2. Mean value, standard deviation (SD), median and interquartile range (IQR) of the chromaticity differences DEu’v’ between the matches made by all the observers for all primary sets and the reference chromaticity calculated by the four different CMF sets
Fig. 5. Mean chromaticity coordinates of matches (colored markers) and their SE ellipses (n = 54 observers), chromaticity coordinates of reference card (black cross) computed by different CMF (subplots a–d), and primary sets (the eight colors indicate the eight different primary sets). The long and short black lines are plots of the blackbody and daylight loci, respectively.
According to , none of the CIE CMFs sets is capable of accurately predicting the visual matches made with narrowband primaries to a broadband target. The CIE 1931 2° has the worst predictive performance, followed by the CIEPO06 2°, while the two 10° CMF sets have a similar better performance, which was expected because of the 10° stimulus size. Li et al. (Li et al. Citation2019b) indeed reported more accurate visual match predictions when the CIEPO06 CMF field size corresponds to that of the stimulus. The spread (SD and IQR) for the 2° chromaticity differences is quite a bit larger than for the 10° ones. A two-sided Wilcoxon rank sum test has been used to check the significance of the differences between the DEu’v’ calculated using the four CMF sets. The results showed that the two 2° CMF sets predicted similarly, and so did the two 10° CMF sets. The better predictive performance, but still substantial variability across different primary sets, of the 10° CMF sets can also be clearly noticed in . In the figure, four graphs, one for each CMF set, have been plotted with the SE-ellipses of the visual matches made with each of the primary sets. From these graphs, it is clear that the CIE 1964 and CIE0P06 10° CMF, not only have a very similar accuracy, but also that the matches calculated using these CMFs sets results in very similarly sized and orientated SE-ellipses. It is also clear that the CIE 1964 SE-ellipses appear to be more closely clustered together, albeit only slightly, than those obtained with the CIEOP06 10° CMF set. Comparing the 2° and 10° CMF sets, it is clear that the former show a substantially larger spread in the SE-ellipses for the different primary sets, which is consistent with the field size of the stimulus being 10° and not 2°. Despite the better match prediction of the 10° CMFs, the average color difference between mean matches and the reference chromaticity is still substantial: DEu’v’ = 0.0087 ± 0.0067, which is much larger than one JND (i.e. DEu’v’ = 0.0033) (CIE Citation2014). Comparing the CIE 1931 and CIEPO06 2° CMFs, however, shows that they result in very different matches for many primary sets, but especially for the primary sets containing the 404 nm primary. This is consistent with the reported underestimation of the sensitivities of this CMF set at lower wavelengths (Csuti and Schanda Citation2008, Citation2010; Ezquerro et al. Citation2008).
Finally, it is worth noting that similar results in terms of mean match distributions, stable P3, etc. were reported in (Li et al. Citation2019b) for 9 observers matching a 3° stimulus at 40 cd/m2, suggesting that the results hold over different stimulus field sizes and luminance values.
3.2. Statistical analyses
The impact of several factors on the mean matching chromaticity values across all observers has been investigated using a repeated measures MANOVA (rmMANOVA). To be valid, rmMANOVA requires multivariate normality.
The latter was verified graphically using Quantile-Quantile plots (QQ-plots), rather than numerically using, e.g. Mardia’s test for multivariate skewness and kurtosis (Mardia Citation2014), as numerical tests tend to be too restrictive for large sets (Field et al. Citation2012). QQ-plots with a Chi-squared reference distribution were made of the squared Mahalanobis’ distances (D2) between the individual matches and the mean match for each group or factor in the statistical model (CMF set, primary set, age, gender, ethnicity, and eye color). A Chi-square distribution of the Mahalanobis distances indicates that the underlying multivariate data have a multivariate-normal distribution. Some typical QQ-plots are shown in in Appendix B and multivariate normality could indeed be confirmed.
3.2.1. MANOVA: impact of primary set, CMF set, age, gender, ethnicity, and eye-color
To determine the significance of the impact of the two within-subject categorical factors, “primary set” (8 levels) and “CMF set” (4 levels), and the impact of the four between-subject factors, “age” (2 levels: younger (<28 years)/older (≥28 years)), “gender” (2 levels), “ethnicity” (2 levels: Asian/Caucasian) and “eye-color” (3 levels: blue/brown/green) a rmMANOVA was performed using the R-function “manova.” The additional factors were included in the statistical analysis for reasons reported in the introduction.
Given the earlier findings on how visual matches for different primary sets seem to have different distributions under different CMF sets, an interaction term for the within-subject factors was included in the MANOVA model. As age-induced yellowing of the lens is expected to react differently to primary sets that vary in the short wavelength peak, the interaction between “primary set” and “age” is also included. The two age groups were selected such that each contained an equally large number (27) of test subjects. Their average ages were 24.5 ± 2.0 years and 41.7 ± 9.5 years, respectively. No other interactions were assumed between the various between-subject factors. Finally, an “Error” term grouped on subjects was included in the model to take the repeated measures nature of the data into account. Results of the omnibus rmMANOVA are reported in .
Table 3. Summary of the results of the omnibus repeated measures MANOVA test on the effect of within-subject factors (“prim”: primary set and “cmf”: CMF set), and the effect of the between-subject factors (“age,” “gender,” “ethnicity,” “eye-color”). Degrees of freedom, Pillai’s test statistics, approximate F-value, degrees of freedom for the numerator, degrees of freedom for the denominator, and the p-value for interacting factors (“:”) are reported, respectively
As can be seen in , there was a significant (p < .001) interaction between the “primary set” and “CMF set” factors, confirming the findings reported in the previous section: the chromaticity of the mean visual matches for the various primary sets are significantly differently distributed for at least one of the CMF sets. Note that the main effects for primary set and CMF set were also significant (p < .001). There was also a significant interaction between “primary set” and “age” (p < .001), thereby confirming our expectations about the impact of age-induced yellowing of the lens. No other significant interactions for the within-subject factors were found.
As far as the between-subject factors, no significant effect could be detected for any of the possible contributors discussed in the introduction.
3.2.2. Post-hoc analyses of the significant effects and interactions
Post-hoc bivariate contrast tests were performed to determine which levels of each categorical factor in the significant interaction were significantly different from one another. The significance of bivariate within-subject factor contrasts (“primary set” and “CMF set”) was determined using a repeated measures MANOVA applied between all possible pairs (contrasts) of a factor and this for each level of the remaining within-subject factor in the case of the interaction. Bivariate contrast tests between the “younger” and “older” levels of the between-subject factor age were also performed per CMF set per primary set using a MANOVA. The Bonferroni correction was applied to account for the multiple comparisons in each contrast analysis. The p-values of the bivariate contrast analysis on primary set pairs (for all CMF sets) are reported in in Appendix B. The p-values of the CMF set contrasts (for all primary sets) are reported in in Appendix B. The p-values for the age contrasts are given in in Appendix B. The significance (at the 5% level) of the uncorrected and Bonferroni corrected (to account for the multiple comparisons) p-values is coded by printing them in bold and bold-italic, respectively.
Finally, as a further follow-up, a series of univariate contrast tests were performed for each coordinate (u’, v’) by applying the emmeans function from the R-package emmeans (Lenth et al. Citation2020) to determine which of the two coordinates was the most likely cause for the significant contrasts detected in the bivariate contrast tests. The results are reported in in Appendix B, for the primary set factor grouped per CMF set, the CMF set factor grouped per primary set, and the age factor grouped per CMF set per primary set, respectively. The tables give the p-values for the u’ and for the v’ coordinates, with the 5% significance coded as before. A contrast is considered significant if at least one of the p-values corresponding to the u’ and v’ coordinates is significant (note that this ignores any potential correlation between the two coordinates).
From the results of the bivariate contrast analysis between different primary sets on the mean match points (see in Appendix B), it is found that all CMFs sets show large numbers of significant differences between matches made by various primary sets. More significant contrasts were found for the 2° CMFs than 10° CMFs, especially after a Bonferroni correction, which is in agreement with .
According to the univariate contrast analyses between different primary sets on the mean u’ and mean v’ coordinates (see in Appendix B), the 2° CMFs have larger number of significant (p < .05) contrasts between primary sets than 10° CMFs, in agreement with the bivariate contrast analysis and the larger spread in the matches as can be observed from . For the 2006 10° CMFs, the number of significant contrasts is a bit larger than the 1964 10° CMFs, which indicates that the CIE 1964 10° CMFs are slightly better at estimating visual matches made with the primary sets and under the conditions in this study. It can also be noted that for all CMF sets the u’ coordinate tends to show the largest number of significant contrasts.
The bivariate contrast analysis on the CMF set pairs revealed significant (p < .05) contrasts for all primary sets, even after a Bonferroni correction. In other words, for each primary set, all of the CMF sets were significantly different from one another. Univariate contrast tests on the u’ and v’ means (see in Appendix B) were therefore performed for all pairs. Despite the significant contrasts between all CMFs sets for all primary sets, no significant univariate contrasts between the 1964 10° and 2006 10° CMFs could be detected due to the reduced power of the univariate tests. But the 1931 2° and 2006 2° CMFs show significant differences for v’ coordinates for those primary sets containing a 404 nm primary, as is also supported by . It is consistent with the reported underestimation of the true cone sensitivity in the short wavelength region of the spectrum for this CMF set. As mentioned earlier, P3 and P7 were confirmed to be relatively “stable” primary sets as they had the least amount of significant univariate contrasts between CMF sets, although it should be noted that the bivariate contrasts were significant for all primary sets. Comparing the 2° and 10° CMF sets, the 2° CMFs showed significant differences with both 10° CMFs for most primary sets, especially for the u’ coordinates.
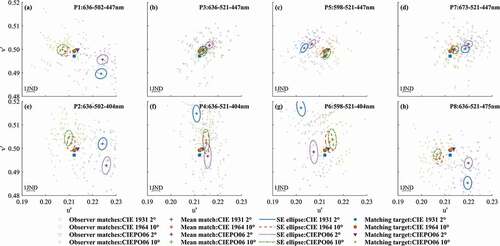
Finally, univariate likelihood ratio tests were performed to determine the impact of age on the u’ and on the v’ match coordinates separately. For each coordinate, the full (containing all significant factors from the omnibus rmMANOVA) and the reduced models (with the age factor omitted) were obtained with a linear mixed effects (lme) model using the R-package lme4 (Bates et al. Citation2015). The full and reduced models were then compared using the anova function from R to obtain the p-values for the coordinates. Results indicate that age only had a significant impact on the v’ coordinate of the matches (p < .001) which is consistent with the direction of the shift expected from age-induced yellowing of the lens (see in Appendix B). The effect of the yellowing of the lens, resulting in a lower sensitivity at (very) short wavelengths and hence the need for adding extra short-wavelength light in the match mixture, can be clearly observed from the SD ellipses in the graphs in . Firstly, the matches made with primary sets with a 404 nm primary (P2, P4, and P6) have substantially shifted toward lower v’ values for older test subjects (–g). Secondly, in comparison with the younger observers, a small shift toward higher v’-values can also be observed for the P8 primary set with the relatively longer 475 nm peak wavelength (). These results confirm the findings from Asano’s matching experiment (Asano et al. Citation2016b), where their 400 nm primary also caused a substantial bluish shift for older people’s matches, while for the primary set containing a 475 nm primary, the matches of older observers shifted slightly to the yellow direction (Asano Citation2015). Thirdly, both groups of observers tend to show quite similar mean matches for the primary sets containing the 447 nm peak wavelength. These observations were confirmed by post-hoc bivariate tests on the age factor for each CMF set and each primary set (see in Appendix B), which only showed significant differences between the mean matches made by the “younger” and “older” groups for the primary sets containing the 404 nm wavelength peaks.
Fig. 6. Mean CIEPO06 10° chromaticity coordinates (colored markers) and their SD ellipses for matches made by younger (blue solid lines), older (red dashed lines) observers and plotted separately for each primary set (graphs a–h). For comparison the SD ellipse of the two groups combined (green dotted line), i.e. the SD ellipses from , are also plotted. The chromaticity coordinates of the reference field are plotted as black crosses. The long and short black lines are plots of the blackbody and daylight loci, respectively.
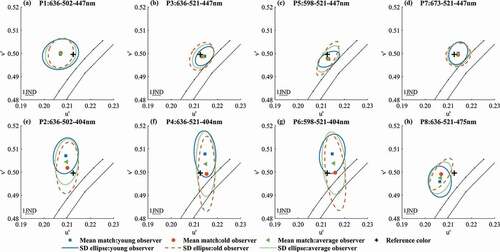
That the shifts along the u’ direction are relatively small and that the major differences in mean matches between the younger and older groups seem to be well correlated with the peak wavelength of the “blue” primary, is strongly indicative that lens yellowing is likely the major contributor to this phenomenon. In a study on categorical observers, Asano et al. (Asano and Fairchild Citation2020) also found that the second most important categorical observer – the first one being the average CIEOP06 observer for a given age and field size – was the one with large deviations in lens pigment density, implying that the latter is indeed a major cause of variation in observer CMFs.
Finally, from , it is clear that P3 and P7, the two most stable (accurate) sets in terms of changes in CMF, are also the most stable ones for the different age groups.
4. Conclusions
This article reported the results of a series of 10° achromatic color-matching experiments performed in a specially designed set-up under an immersive and stable adaptation conditions at 4673 K. A total of 54 observers with varying age, gender, ethnicity, and eye color participated. They were asked to match a spectrally broadband gray reference (4613 K) using narrowband primaries with different peak wavelengths. The luminance of both matching and reference field was kept constant at 70 cd/m2 throughout the experiment. Based on the results, the following conclusions can be made.
Both the quantitative statistical analyses and the more qualitative visual analyses of the match chromaticity values revealed that the selection of a primary set has a statistically significant and important impact in terms of mean match chromaticity. The CMF selected to calculate the chromaticity had also a significant impact on the match chromaticities. Significant interaction between these two within-subject factors was also observed, leading to clearly different distributions of the match chromaticities as illustrated in .
It was found that the two 10° CIE CMFs sets produced very similar mean match chromaticities for the different primary sets, while those of the 2° CMFs differed much more. Of the latter two, the CIE 1931 2° set was found to result in the most different predicted matches, especially when a very short wavelength primary (404 nm) was used during the matching, confirming earlier reports on the short-wavelength errors in CMF set. While there were small to substantial differences in the calculated match chromaticities, depending on the adopted (spectrally narrowband) matching primaries, the chromaticities calculated using the different CMF sets were very similar for the spectrally smooth and broadband reference gray (DEu’v’≈0.0010 ± 0.0006). Furthermore, calculated chromaticities for matches made by mixing the light of the 636 nm, 521 nm, and 447 nm primaries which are typical LED RGB-primaries (Csuti and Schanda Citation2008) seem to be stable across changes in the CMF set used to calculate them. This set has peak wavelengths closest to those adopted in the Wright (Wright Citation1929) and Stiles & Burch (Stiles and Burch Citation1955, Citation1959) matching experiments which generated data that was used in the development of the CIE 1931 2° and the CIE 1964 10° CMFs. The data from Stiles & Burch were also used in the development of Stockman’s cone fundamental model (Stockman and Sharpe Citation1999, Citation2000) on which the CIEPO06 CMFs are based (CIE Citation2006). It is therefore reasonable that this particular primary set can obtain the least discrepancy between visual and computed metamers.
In addition, the results show that, as expected, the 2° CIE CMF sets were not strongly predictive for visual matches made with different narrow-band primaries (DEu’v’ = 0.0131 ± 0.0078), while the 10° CMFs provide quite good predictions (DEu’v’ = 0.0087 ± 0.0067; ~ 2.5 JND) with some room left for improvements.
Moreover, a significant interaction between a 2-level age factor and the primary set factor was found. Post-hoc tests showed that “older” (age ≥28 years) test subjects seemed to make significantly different matches than the younger observers for primary sets containing a 404 nm peak wavelength primary and that the shift was along the v’ direction toward lower values. This is consistent with shifts expected from age-induced yellow of the lens requiring some of the observers to add additional short wavelength light to their match.
However, no significant effect on mean match chromaticity was detected for the between-subject factors “ethnicity,” “gender,” and “eye color” when pooling all other factors.
It is therefore clear that there yet exists potential room for improvement of the CIE colorimetric standard observers to take differences in observer’s color matching and hence color perception into account.
Supplemental Material
Download MS Excel (7 MB)Disclosure statement
The authors have no financial interests to declare.
Supplementary material
Supplemental data for this article can be accessed on the publisher’s website.
Additional information
Funding
Related Research Data
References
- Ábrahám G, Körösi H, Schanda J, Shapiro AG, Wenzel K. 1995. Anomalies in additive colour matches. Color Res Appl. 20(4):235–244.
- Alfvin RL, Fairchild MD. 1997. Observer variability in metameric color matches using color reproduction media. Color Res Appl. 22(3):174–188.
- Asano Y. 2015. Individual colorimetric observers for personalized color imaging. Thesis. Rochester Institute of Technology, Rochester, New York.
- Asano Y, Fairchild MD. 2020. Categorical observers for metamerism. Color Res Appl. 45(4):576–585.
- Asano Y, Fairchild MD, Blondé L. 2016a. Individual colorimetric observer model. PLoS One. 11(2):e0145671.
- Asano Y, Fairchild MD, Blondé L, Morvan P. 2016b. Color matching experiment for highlighting interobserver variability. Color Res Appl. 41(5):530–539.
- Bates D, Mächler M, Bolker BM, Walker SC 2015. Fitting linear mixed-effects models using lme4. J Stat Softw. 67(1). doi:https://doi.org/10.18637/jss.v067.i01
- Blackwell KT, Buchsbaum G. 1988. The effect of spatial and chromatic parameters on chromatic induction. Color Res Appl. 13(3):166–173.
- Braun KM, Fairchild MD, Alessi PJ. 1996. Viewing techniques for cross‐media image comparisons. Color Res Appl. 21(1):6–17.
- CIE. 1986. Colorimetry. 2nd ed. Publication CIE. 15.2-1986. Central Bureau of the CIE, Vienna.
- CIE. 2004. Colorimetry. 3rd ed. Technical Report. Publication CIE. 015-2004. Central Bureau of the CIE, Vienna.
- CIE. 2006. Fundamental chromaticity diagram with physiological axes - part I. CIE 170-1:2006. Central Bureau of the CIE, Vienna.
- CIE. 2011. CIE international lighting vocabulary. CIE. S 017/E:2011. Central Bureau of the CIE, Vienna.
- CIE. 2014. Chromaticity difference specification for light sources. CIE. TN001:2014. Central Bureau of the CIE, Vienna.
- CIE. 2018. Colorimetry. 4th ed. CIE. 015:2018. Central Bureau of the CIE, Vienna. doi:https://doi.org/10.25039/TR.015.2018.
- Csuti P, Schanda J. 2008. Colour matching experiments with RGB-LEDs. Color Res Appl. 33(2):108–112.
- Csuti P, Schanda J. 2010. A better description of metameric experience of LED clusters. Light Eng. 18(1):44–50.
- Cuttle C. 2008. Lighting by Design, 2nd Edition. Oxford: Architectural Press.
- David A, Sahlhoff D, Wisser M. 2019. Human perception of light chromaticity: short-wavelength effects in spectra with low circadian stimulation, and broader implications for general LED sources. Opt. Express 27(22):31553–31566.
- Ezquerro JM, Zoido JM, Perales E, Martínez-Verdú F, Melgosa M. 2008. In: CGIV 2008 / MCS / 08 4th European Conference on Color in Graphics, Imaging, and Vision; 10th International Symposium on Multispectral Color Science: final program and proceedings [Electronic resource]. Springfield, VA: Society for Imaging Science and Technology, 2008.
- Fairchild MD. 1989. A novel method for the determination of color matching functions. Color Res Appl. 14(3):122–130.
- Field A, Miles J, Field Z. 2012. Discovering statistics using R. Sage publications.
- Flecy L, Smet KAG. 2015. RGB kleurmatching met nauwbandige en breedbandige primairen. Thesis. KU Leuven, Campus Gent.
- Grassmann HG. 1854. XXXVII. On the theory of compound colours. The London, Edinburgh, and Dublin Philosophical Magazine and Journal of Science, 7(45):254–264.
- Guild J. 1931. The colorimetric properties of the spectrum. Encycl Earth Sci Ser. 230:149–187.
- Haddad HJ, Jakstat HA, Arnetzl G, Borbely J, Vichi A, Dumfahrt H, Renault P, Corcodel N, Pohlen B, Marada G, et al. 2009. Does gender and experience influence shade matching quality? J Dent. 37(SUPPL.1):40–44. doi:https://doi.org/10.1016/j.jdent.2009.05.012.
- Henley SA, Fairchild MD. 2000. Quantifying mixed adaptation in cross-media color reproduction. In: Color and imaging conference. Scottsdale, Arizona, USA. Vol. 2000, No. 1, pp. 305–310. Society for Imaging Science and Technology.
- Houser KW, Hu X. 2004. Visually matching daylight fluorescent lamplight with two primary sets†. Color Res Appl. 29(6):428–437.
- Hu X, Houser KW. 2006. Large-field color matching functions. Color Res Appl. 31(1):18–29.
- Jain N, Verma P, Mittal S, Mittal S, Singh AK, Munjal S. 2010. Gender based alteration in color perception. Indian J Physiol Pharmacol. 54(4):366–370.
- Judd DB. 1951. Report of U.S. secretariat committee on colorimetry and artificial daylight. Proc 12th Sess CIE. 1951(1):11. https://ci.nii.ac.jp/naid/10016149511/en/
- Judd DB. 1961. A five-attribute system of describing visual appearance. Philadelphia: American Society for Testing Materials.
- Katoh N, Nakabayashi K, Ito M, Ohno S. 1998. Effect of ambient light on color appearance of softcopy images: mixed chromatic adaptation for self-luminous displays. J Electron Imaging. 7(4):794–807.
- Krantz DH. 1975. Color measurement and color theory: I. Representation theorem for Grassmann structures. J Math Psychol. 12(3):283–303.
- Kuriki I. 2015. Effect of material perception on mode of color appearance. J Vis. 15(8):4.
- Lenth R, Singmann H, Love J, Buerkner P, Herve M. 2020. Estimated marginal means, aka least-squares means. R package version 1.4.4. https://github.com/rvlenth/emmeans.
- Li J, Hanselaer P, Smet K. 2019a. Pilot study on color matching accuracy using different primaries. Proceedings of the 29th CIE Session. Washington D.C., USA, June 14 – 22, 2019. p. 1010–1018.
- Li J, Hanselaer P, Smet K. 2019b. The impact of matching primary peak wavelength on color matching accuracy and observer variability. 27th Color and Imaging Conference. Paris, France. Final Program and Proceedings; Society for Imaging Science and Technology. pp. 220–224 (5).
- Long DL, Fairchild MD. 2014. Modeling observer variability and metamerism failure in electronic color displays. JIST. 58(3):304021–3040214. doi:https://doi.org/10.2352/J.ImagingSci.Technol.2014.58.3.030402.
- Lozano RD, Palmer DA. 1969. Large-field color matching and adaptation. J Opt Soc Am. 59(4):463–464.
- Ma S, Hanselaer P, Teunissen K, Smet K. 2018. The influence of adapting field size on degree of chromatic adaptation. CIE 2018 Smart Lighting, Date: 2018/04/24-2018/04/28; Taipei.
- Ma S, Hanselaer P, Teunissen K, Smet KAG. 2019. Impact of the starting point chromaticity on memory color matching accuracy. Opt Express. 27(24):35308.
- Mardia KV. 2014. Multinormality, Mardia’s test of. Wiley statsref stat ref online. https://doi.org/10.1002/9781118445112.stat01657.
- Murdoch MJ, Fairchild MD. 2019. Modelling the effects of inter-observer variation on colour rendition. Lighting Res Technol. 51(1):37–54.
- Nimeroff I, Rosenblatt JR, Dannemiller MC. 1961. Variability of spectral tristimulus values. J Res Natl Bur Stand A Phys Chem. 65A(6):475–483. doi:https://doi.org/10.6028/jres.065A.050.
- North AD, Fairchild MD. 1993. Measuring color-matching functions. Part 11. New data for assessing observer metamerism. Color Res Appl. 18(3):163–170.
- Ohno Y, Kawashima Y, Oh S, Kwak Y. 2019. Visual evaluation of CIE 2015 cone fundamental-based 10° colour matching functions for lighting applications. Proc 29th CIE Sess. doi:https://doi.org/10.25039/x46.2019.OP69
- Oicherman B. 2007. Effects of colorimetric additivity failure and of observer metamerism on cross-media colourmatching. Thesis. The University of Leeds. Leeds, UK.
- Oicherman B, Luo MR, Rigg B, Robertson AR. 2008. Effect of observer metamerism on colour matching of display and surface colours. Color Res Appl. 33(5):346–359.
- Oleari C, Pavesi M. 2008. Grassmann’s laws and individual color-matching functions for non-spectral primaries evaluated by maximum saturation technique in foveal vision. Color Res Appl. 33(4):271–281.
- Oulton DP. 2004a. The properties of multiple CMF determinations using alternative primary sets part II: a data unification methodology. Color Res Appl. 29(6):438–450.
- Oulton DP. 2004b. The properties of multiple CMF determinations using alternative primary sets part I: evidence and modeling. Color Res Appl. 29(4):273–284.
- Ramanath R. 2009. Minimizing observer metamerism in display systems. Color Res Appl. 34(5):391–398.
- Rich DC, Jalijali J. 1995. Effects of observer metamerism in the determination of human color-matching functions. Color Res Appl. 20(1):29–35.
- Sarkar A. 2011a. Identification and assignment of colorimetric observer categories and their applications in color and vision sciences. Université de Nantes. https://tel.archives-ouvertes.fr/tel-00647246.
- Sarkar A. 2011b. Variability in color matching functions. Technical report. CIE. R1-54. Central Bureau of the CIE, Vienna.
- Sarkar A, Autrusseau F, Viénot F, Le Callet P, Blondé L. 2011. From CIE 2006 physiological model to improved age-dependent and average colorimetric observers. J Opt Soc Am A. 28(10):2033.
- Sarkar A, Blondé L, Le Callet P, Autrusseau F, Morvan P, Stauder J. 2010. Toward reducing observer metamerism in industrial applications: colorimetric observer categories and observer classification. In: 18th Color and Imaging Conference. Texas, USA. Vol. 2010. Society for Imaging Science and Technology; p. 307–313.
- Sarkar A, Blondé L, Le Callet P, Autrusseau F, Stauder J, Morvan P. 2009. Study of observer variability on modern display colorimetry: comparison of CIE 2006 model and 10° standard observer. The 11th Congress of the International Colour Association (AIC); Sydney, Australia: AIC.
- Shapiro AG, Pokorny J, Smith VC. 1994. Rod contribution to large‐field color matching. Color Res Appl. 19(4):236–245.
- Shaw M, Fairchild M. 2002. Evaluating the 1931 CIE color-matching functions. Color Res Appl. 27(5):316–329.
- Shi C, Huang M, Liu Y, Li Z, Liu H. 2016. Study on observers’ categories based on color matching experiments. In: China Academic Conference on Printing & Packaging and Media Technology. Singapore: Springer. p. 123–129.
- Smet KAG. 2018. Tutorial: the LuxPy Python toolbox for lighting and color science. LEUKOS. doi:https://doi.org/10.1080/15502724.2018.1518717
- Smet KAG, Deconinck G, Hanselaer P. 2014. Chromaticity of unique white in object mode. Opt Express. 22(21):25830–25841.
- Speranskaya NI. 1959. Determination of spectrum color coordinates for twenty-seven normal observers. Opt Spectrosc. 7:424–428. [accessed 2020 Mar 6]. http://ci.nii.ac.jp/naid/10018424674/en/.
- Stiles WS, Burch JM. 1955. Interim report to the commission internationale de l’Eclairage, Zurich, 1955, on the national physical laboratory’s investigation of colour-matching (1955). Opt Acta. 2(4):168–181.
- Stiles WS, Burch JM. 1959. N.P.L. Colour-matching investigation: final report (1958). Opt Acta Int J Opt. 6(1):1–26.
- Stiles WS, Wyszecki G. 1962. Field trials of color-mixture functions*. J Opt Soc Am. 52(1):58.
- Stockman A, Sharpe LT. 1999. Cone spectral sensitivities and color matching. In: Color Vision: From Genes to Perception., K. Gegenfurtner, and L. Sharper, eds. Cambridge: Cambridge University Press, p. 53–88.
- Stockman A, Sharpe LT. 2000. The spectral sensitivities of the middle- and long-wavelength-sensitive cones derived from measurements in observers of known genotype. Vision Res. 40(13):1711–1737.
- Thornton WA. 1992a. Toward a more accurate and extensible colorimetry. Part III. Discussion (continued). Color Res Appl. 17(4):240–262.
- Thornton WA. 1992b. Toward a more accurate and extensible colorimetry. Part I. Introduction. The visual colorimeter-spectroradiometer. experimental results. Color Res Appl. 17(2):79–122.
- Thornton WA. 1992c. Toward a more accurate and extensible colorimetry. Part II. Discussion. Color Res Appl. 17(3):162–186.
- Thornton WA. 1997. Toward a more accurate and extensible colorimetry. Part IV. Visual experiments with bright fields and both 10° and 1.3° field sizes William. Color Res Appl. 22(3):189–198.
- Thornton WA. 1998. Toward a more accurate and extensible colorimetry. Part VI. Improved weighting functions. Preliminary results. Color Res Appl. 23(4):226–233.
- Thornton WA. 1999. Spectral sensitivities of the normal human visual system, color-matching functions and their principles, and how and why the two sets should coincide. Color Res. Appl. 24:139–156. https://doi.org/https://doi.org/10.1002/(SICI)1520-6378(199904)24:2<139::AID-COL9>3.0.CO;2-O
- Thornton WA. 2000. Suggested optimum primaries and gamut in color imaging. Color Res Appl. 25(2):148–150.
- Thornton WA, Fairman HS. 1998. Toward a more accurate and extensible colorimetry. Part V. Testing visually matching pairs of lights for possible rod participation on the Aguilar-Stiles model. Color Res Appl. 23(2):92–103.
- Vos JJ. 1978. Colorimetric and photometric properties of a 2° fundamental observer. Color Res Appl. 3(3):125–128.
- Wright WD. 1929. A re-determination of the trichromatic coefficients of the spectral colours. TransOpt Soc. 30(4):141–164.
- Wyszecki G, Stiles WS. 2000. Color science: concepts and methods, quantitative data and formulas. 2nd ed. London (UK): John Wiley & Sons, Inc.
- Zaidi Q. 1986. Adaptation and color matching. Vision Res. 26(12):1925–1938.
Appendix A: Parameters of standard deviation ellipses
Table A1. SD ellipse parameters for an average observer for each primary set and CMF set. Center chromaticity, ellipse orientation, area and lengths of the major, and minor ellipse axes are reported in CIE 1976 u’v’ units
Appendix B: Supplementary Statistical analysis
Fig. B1. Q-Q plot of Mahalanobis’ distance (D2) in function of theoretical quantiles of Chi2 for matches made by different primary sets (subplots a-h).
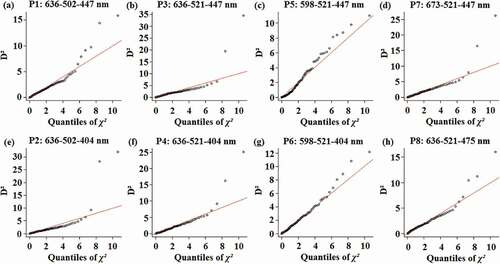
Table B1. Results of the post-hoc bivariate contrast analysis for the four CMF sets using a repeated measures MANOVA applied between all primary set pairs (contrasts). The p-values of each contrast are reported in two sub-tables, one for the 2° CMFs and one for the 10° CMFs; wherein the upper-right half and the lower-left half of the sub-tables correspond to the CIE 1931 and CIEPO06 2° CMFs (upper table), and the CIE 1964 and CIEPO06 10° CMFs (lower sub-table), respectively. The table cells with the contrast p-values for the CIEPO06 CMFs have been shaded gray. When the p-value is significant (<5% significance) it has been printed in bold; when the p-value is still significant after a Bonferroni correction it has been printed in bold-italic. The numbers (1, 2, 3, 4, 5, 6, 7, 8) in the first column and the first row correspond to the primary sets, i.e. P1: 636–502-447 nm, P2: 636–502-404 nm, P3: 636–521-447 nm, P4: 636–521-404 nm, P5: 598–521-447 nm, P6: 598–521-404 nm, P7: 673–521-447 nm, P8: 636–521-475 nm.CMF set: CIE 1931 2°/CIEOP06 2°
CMF set: CIE 1964 10°/CIEOP06 10°
Table B2. Results of the post-hoc bivariate contrast analysis for the eight primary sets using a repeated measures MANOVA applied between all CMF set pairs (contrasts). The p-values of each contrast are reported in four sub-tables, for primary set (P1, P2), (P3, P4), (P5, P6), (P7, P8) respectively; wherein the upper-right half and the lower-left half of the sub-tables correspond to the primary sets with odd numbers (upper table), and the primary sets with even numbers (lower sub-table), respectively. The table cells with the contrast p-values for the primary sets with even numbers have been shaded gray. When the p-value is significant (<5% significance) it has been printed in bold; when the p-value is still significant after a Bonferroni correction it has been printed in bold-italic. The numbers (1, 2, 3, 4) in the first column and the first row correspond to the CMF sets, i.e. CIE 1931 2° CMFs, CIE 1964 10° CMFs, CIEPO06 2° CMFs and CIEPO06 10° CMFs.Primary set (P1, P2): 636–502-447 nm/636-502-404 nm
Primary set (P3, P4): 636–521-447 nm/636-521-404 nm
Primary set (P5, P6): 598–521-447 nm/598-521-404 nm
Primary set (P7, P8): 673–521-447 nm/636-521-475 nm
Table B3. Results of the post-hoc bivariate contrast analysis for the four CMF sets and eight primary sets using a repeated measures MANOVA applied between the younger and older levels of the age factor (contrasts). The p-values of each contrast are reported. When the p-value is significant (<5% significance) it has been printed in bold; when the p-value is still significant after a Bonferroni correction it has been printed in bold-italic. The numbers (1, 2, 3, 4, 5, 6, 7, 8) in the first row correspond to the primary sets, i.e. P1: 636–502-447 nm, P2: 636–502-404 nm, P3: 636–521-447 nm, P4: 636–521-404 nm, P5: 598–521-447 nm, P6: 598–521-404 nm, P7: 673–521-447 nm, P8: 636–521-475 nm
Table B4. Results of the post-hoc univariate contrast analysis for the four CMF sets between all primary set pairs (contrasts) for the u’ and v’ coordinates. The p-values of each contrast for the u’ and v’ coordinate are reported separately with a “/” in between in each cell, and split into two sub-tables, one for the 2° CMFs and one for the 10° CMFs; wherein the upper-right half and the lower-left half of the sub-tables correspond to the CIE 1931 and CIEPO06 2° CMFs (upper table), and the CIE 1964 and CIEPO06 10° CMFs (lower sub-table), respectively. The table cells with the contrast p-values for the CIEPO06 CMFs have been shaded gray. When the p-value is significant (<5% significance) it has been printed in bold; when the p-value is still significant after a Bonferroni correction it has been printed in bold-italic. The numbers (1, 2, 3, 4, 5, 6, 7, 8) in the first column and the first row correspond to the primary sets, i.e. P1: 636–502-447 nm, P2: 636–502-404 nm, P3: 636–521-447 nm, P4: 636–521-404 nm, P5: 598–521-447 nm, P6: 598–521-404 nm, P7: 673–521-447 nm, P8: 636–521-475 nm.CMF set: CIE 1931 2°/CIEOP06 2°
CMF set: CIE 1964 10°/CIEOP06 10°
Table B5. Results of the post-hoc univariate contrast analysis for the eight primary sets using a repeated measures MANOVA applied between all CMF set pairs (contrasts) for the u’ and v’ coordinates. The p-values of each contrast for the u’ and v’ coordinate are reported separately with a “/” in between in each cell, and split into four sub-tables, for primary set (P1, P2), (P3, P4), (P5, P6), (P7, P8), respectively; wherein the upper-right half and the lower-left half of the sub-tables correspond to the primary sets with odd numbers (upper table), and the primary sets with even numbers (lower sub-table), respectively. The table cells with the contrast p-values for the primary sets with even numbers have been shaded gray. When the p-value is significant (<5% significance) it has been printed in bold; when the p-value is still significant after a Bonferroni correction it has been printed in bold-italic.Primary set (P1, P2): 636–502-447 nm/636-502-404 nm
Primary set (P3, P4): 636–521-447 nm/636-521-404 nm
Primary set (P5, P6): 598–521-447 nm/598-521-404 nm
Primary set (P7, P8): 673–521-447 nm/636-521-475 nm
Table B6. Results of the post-hoc univariate contrast analysis for the four CMF sets and eight primary sets using a repeated measures MANOVA applied between the younger and older levels of the age factor (contrasts) for the u’ and v’ coordinates. The p-values of each contrast for the u’ and v’ coordinate are reported separately with a “/” in between in each cell, respectively. When the p-value is significant (<5% significance) it has been printed in bold; when the p-value is still significant after a Bonferroni correction it has been printed in bold-italic. The numbers (1, 2, 3, 4, 5, 6, 7, 8) in the first row correspond to the primary sets, i.e. P1: 636–502-447 nm, P2: 636–502-404 nm, P3: 636–521-447 nm, P4: 636–521-404 nm, P5: 598–521-447 nm, P6: 598–521-404 nm, P7: 673–521-447 nm, P8: 636–521-475 nm