
ABSTRACT
While there is a growing use of complex façade designs in contemporary architecture worldwide and across Europe, little is known about the perceptual effects of these façades and the resulting daylight patterns on occupants, or about how such effects might differ between European latitudes. This study examines the perception of façade and daylight patterns across Europe by replicating a virtual reality (VR) experiment in Norway, Switzerland and Greece, using a mixed experimental design to jointly investigate the influence of different factors on the perception of a daylit interior space. These factors included: façade geometry (within-subject factor with four contemporary façade designs of equal aperture ratio), sky type (clear sky with high or low sun angle, or overcast sky), spatial context (socializing or working), and country (Norway, Switzerland, or Greece). Results showed that, among the manipulated factors, only the façade geometry affected the studied attributes (how pleasant, interesting, exciting, calming, complex, spacious, and bright the space was perceived, and the satisfaction with the amount of view in the space). Regional effects were observed only for reported brightness, with higher evaluations from participants in Greece than in Norway, but are difficult to generalize due to limitations stemming from the use of VR and the conduction of experiments in different seasons (summer and early fall) in the two countries. These findings show that façade design is a crucial feature in our spatial experience, inducing equivalent perceptual effects, such as changes in pleasantness or interest, across Europe, and motivate further research on the perception of brightness.
1. Introduction
One of the central issues in lighting design is the creation of environments that are both visually stimulating and comfortable (Boyce Citation2003; Inanici and Wymelenberg Citation2009; Reinhart et al. Citation2006; Van Den Wymelenberg et al. Citation2010). While most lighting design recommendations and metrics tend to restrict direct sunlight penetration in order to avoid glare or overheating (IESNA Citation2012; Nabil and Mardaljevic Citation2005; Wienold and Christoffersen Citation2006), this trend has been criticized, and recent regulations acknowledge the occupants’ need for sunlight access. In particular, the recent European standard “Daylight in buildings” recommends a minimum duration of annual sunshine exposure for occupied spaces (European Committee for Standardization CEN Citation2019).
Occupants show an overwhelming preference toward natural over artificial lighting, a finding which is consistent across multiple studies over the last five decades (Borisuit et al. Citation2015; Heerwagen and Heerwagen Citation1986; Markus Citation1967; Osterhaus Citation2005; Roche et al. Citation2000; Veitch et al. Citation1993). This consistency seems to indicate that the preference toward natural lighting is not a result of technological limitations of artificial lighting systems at the time of each study, but rather a result of the visual and temporal qualities of daylight and of our preference for “naturalness” in lighting: people have for example been shown to exhibit a preference for daylight or simulated daylight over fluorescent light (Haans Citation2014).
Occupants are also shown to prefer the presence of some direct sunlight in office settings. In a field study assessing the lighting preferences of 400 employees in an office building, 86% of respondents reported that they “liked some sunshine in the office” during the whole year (Markus Citation1967). Similar findings have been found in experimental studies where participants were instructed to manually adjust the blinds to a position that they deemed to be “just disturbing” and “most preferable” regarding discomfort glare from daylight in an office setting (Van Den Wymelenberg et al. Citation2010). Contrary to expectations, 11 out of 12 participants that took part in the study under sunny or partly sunny sky chose to allow direct sunlight into the room when asked to create their preferred condition. While the sample size in Van Den Wymelenberg et al. (Citation2010) was limited, these findings demonstrate the potential of luminance distributions in the scene as drivers for a preferred daylit environment.
Lighting research has repeatedly linked luminance variation with the creation of visual interest in both real (Flynn et al. Citation1973; Hawkes et al. Citation1979; Loe et al. Citation1994; Parpairi et al. Citation2002) and simulated (Rockcastle et al. Citation2017a, Citation2017b; Stokkermans et al. Citation2017) environments. In addition, both the maximum possible sunlight penetration in a space (Leather et al. Citation1998) and the size of sunlight patches (Boubekri et al. Citation1991) have been linked with impressions of relaxation and well-being. Nevertheless, little is known about the human responses to different characteristics of luminance distribution, which has been argued to be a “missing variable” in current lighting research (Boyce Citation2014). Specifically, the size, distribution, and visual dominance of luminance patterns have been identified as potential factors of preference toward lighting (Veitch and Newsham Citation2000).
In the context of daylighting, the luminance distribution is inextricably linked to the building envelope and its openings. The role of the building envelope in the creation of luminance patterns is particularly relevant for contemporary architecture, as there is a growing use of decorative patterns and permeated walls that mediate the entering daylight (Corrodi and Spechtenhauser Citation2008). However, we have limited knowledge on how the façade openings affect the building’s occupants.
In the last years, a number of studies have investigated the impact of façade design on occupants. Experiments in simulated environments have shown significant effects of façade and daylight patterns on subjective impressions, such as reported visual interest, pleasantness, and excitement (Abboushi et al. Citation2019; Chamilothori et al. Citation2019a, Citation2016), as well as on the heart rate of participants (Chamilothori et al. Citation2019a). Studies that employed similar façade variations in real environments, however, show inconsistent results when compared with the outcomes of the equivalent experiments in virtual environments, an outcome that might be caused by the changing lighting conditions (Abboushi and Elzeyadi Citation2018a, Citation2018b; Abboushi et al. Citation2020). At the same time, existing studies do not examine the role of daylight as an independent variable, and thus create an important research gap about the relative effect of daylight conditions and façade geometry on occupant perception.
1.1. Space function and lighting preferences
The majority of existing studies on the perception of façade and daylight patterns have employed stimuli that represent an office environment (Abboushi and Elzeyadi Citation2018a, Citation2018b; Abboushi et al. Citation2020; Chamilothori et al. Citation2016; Omidfar et al. Citation2015; Omidfar Sawyer and Chamilothori Citation2019). However, both the activity of occupants in a space (Osterhaus Citation1993) and their attention to the task when conducting a particular activity (Osterhaus and Bailey Citation1992) have been suggested as important variables that affect the perception and preference toward lighting conditions.
In a series of surveys, Butler and Biner (Citation1987) and Biner et al. (Citation1989) investigated the declared lighting preferences across different rooms, for different activities and social settings in each room (for example, eating in the dining room alone, with a partner, or with a group). The outcomes of these studies showed that the context, including both the (expected) activity and the social setting, affected the declared lighting preferences. Specifically, a wide variation in reported preferences for light levels were found for different activities performed in the same room, such as drinking or conducting business in the office (Butler and Biner Citation1987). The social setting, such as eating with a platonic friend or a romantic partner, was also found to affect reported light preferences, with the latter leading to lower preferred light levels (Butler and Biner Citation1987; Biner et al., Citation1989). Reported brightness preferences for the same activity were found to differ between rooms for some activities (e.g., studying, talking) but not for others (e.g., partying, drinking) (Butler and Biner Citation1987).
Similarly, Wang and Boubekri (Citation2010) found an influence of activity scenario on the declared seating preference in a sunlit space. Surveyed participants were asked to place three types of furniture – a work desk, a meeting table, and a pair of relaxing chairs – on a floor plan to indicate their preferred seating position. While the authors did not report statistical analyses on this data, results showed that sunlight access was not welcome in the context of teamwork, but was preferred in the context of both isolated work and relaxation. In another study conducted in virtual reality, the declared space function was shown to influence the reported interest and excitement in a daylit space (Chamilothori et al. Citation2019a).
It is important to note that while the literature suggests that it is necessary to define a specific context when investigating occupants’ perception and preference toward lighting conditions, existing studies have only used verbal instructions to indicate different scenarios of space use (Biner et al. Citation1989; Butler and Biner Citation1987). This approach raises the question of whether these effects of expected space function would be replicated in a more realistic setting, such as with the use of a visual stimulus depicting different uses of the space.
1.2. Regional differences in the perception of lit environments
In an extensive review on occupant preferences and satisfaction with lighting conditions and control systems, Galasiu and Veitch (Citation2006) underline the lack of knowledge regarding the generalizability of research findings across different settings, and advocate systematic comparisons between latitudes and cultures. Similarly, current methodological practices in lighting research assert that it is necessary to test for potential cultural influences before assuming the generalizability of research findings across cultures (Veitch et al. Citation2019).
Empirical studies on the perception of artificial lighting have found evidence of regional differences in perceived brightness between participants in France and in Japan (Yoshizawa et al. Citation2015), in reported arousal between Korean and Caucasian-American participants living in the USA (Park and Farr Citation2007), and in factors representing the appraisal of lighting between participants in Japan and in Denmark (Okamura et al. Citation2016) and between participants in China and in the Netherlands (Liu et al. Citation2015). Similar outcomes have been suggested for glare perception (Lee and Kim Citation2007), but recent studies show conflicting outcomes. In particular, Pierson et al. (Citation2021) investigated the sensitivity to discomfort glare from daylight between participants in Belgium, Switzerland, Chile, and Japan in extensive field studies and found no statistically significant differences between either geographically similar or diverse populations.
To the authors’ knowledge, with the exception of Pierson et al. (Citation2021), no studies examine differences in participant responses toward lighting conditions within Europe. Regarding cultural differences within the European region, Akaliyski (Citation2017) showed that geographical distance was a significant predictor of cultural distance (defined as the cumulative Euclidian distance in reported social values, beliefs, and attitudes) between countries in Europe, but this effect disappeared when taking into account additional factors such as religion, language, or gross domestic product per capita. As a result, it is challenging to define regions of cultural similarity or divergence within Europe. In this paper, we use the term ‘regional differences’ to refer to differences due to socio-environmental context as defined by Pierson et al. (Citation2021), “the climate and habitat (interior and exterior) to which a person has acclimatized and their behavior and expectations towards these elements,” and focus on different countries in Europe.
1.3. Problem statement
Contemporary architecture shows a shift toward the use of permeated façade elements that mediate the incoming light, creating diverse daylight patterns. However, we have limited knowledge regarding the influence of the characteristics of façade openings and of the corresponding daylight patterns on occupants. Moreover, recent methodological recommendations in lighting research underline the importance of regional differences in human perception, and emphasize the need for empirical studies with different populations to establish the generalizability of research findings (Veitch et al. Citation2019).
While the literature suggests potential regional effects in responses toward lighting between widely diverse populations across different continents, little is known about the regional differences between the range of latitudes that can be found within Europe. Lastly, although considerable research in lighting has been devoted to investigations in working environments, less attention has been paid to different uses of a space, and to how the spatial context might influence the occupant’s expectations and perception of a daylit space.
This study, published in two parts, investigates the presence of regional differences between Norway, Switzerland and Greece in the experience of varying window sizes (Part I; Moscoso et al. Citation2021a) and of façade and daylight patterns (Part II, the current article) in daylit scenes shown using virtual reality.
1.4. Objectives
The present article examines regional differences within Europe in the experience of façade and daylight patterns by replicating the same experiment in Norway, Switzerland, and Greece, corresponding to the northernmost, central, and southernmost regions of Europe. In parallel, this study investigates the effect of sky type and spatial context on the perception of space, and employs virtual reality to ensure control of the presented visual stimuli. The term ‘façade geometry’ will be used to refer to the façade variation, and the term ‘façade and daylight pattern’ will be used to refer to both the façade and the corresponding sunlight patches in the scene.
2. Method
To investigate potential regional effects in the participants’ impressions of façade and daylight patterns within Europe, a common experimental setup and procedure were developed and replicated by two collaborating research groups to conduct experiments across Norway, Switzerland, and Greece using the same equipment and stimuli. The sections below discuss the experimental design, the selection of independent and dependent variables, the equipment used in all countries, the characteristics of participants, the experimental procedure, and lastly the method used for data analysis.
2.1. Experimental design
The experiments in this study followed a mixed design, with the façade geometry chosen as the within-subject factor to minimize the intra-subject variance. Building up on the knowledge gaps that were identified in the introduction, the independent variables consist of the within-subject factor Façade geometry (with four levels of façade designs with varying characteristics, described further in Section 2.2), and the between-subject factors Sky type (with three levels: a clear sky with a high sun angle, a clear sky with a low sun angle, and an overcast sky), Spatial context (with two levels: socializing or working) and lastly Country, the main focus of this study (with three levels: Norway, Switzerland, and Greece). summarizes these factors and their levels.
Table 1. Overview of studied factors and their levels
The present study was part of a broader investigation on regional effects in the perception of daylit spaces across Europe, which explored such effects in the context of window size through another experimental phase. The order of the two experimental phases was randomized and is considered in the data analysis, as discussed in Sections 2.7 and 3.4, to ensure that it did not influence the participant responses. The results of the experimental phase examining regional differences in the perception of window sizes are reported in the Part I of this article (Moscoso et al. Citation2021a).
2.2. Independent variables
The studied variations of the factor Façade geometry are selected from existing studies on the expected perceptual effects of façade design according to architects (Chamilothori et al. Citation2018), where specific façade variations were shown to incite the highest agreement regarding their potential to induce impressions of calmness and excitement. These façade variations, shown in , are based on existing contemporary architecture and were manipulated to have a common perforation ratio of open to total surface area of 40% (±1%). These façade variations will be referred to as Pattern 1, 2, 3, and 4, corresponding to the order they are shown in , from left to right.
Fig. 1. The selected façade geometry variations (top row) and the corresponding examples of contemporary architecture they were based on (bottom row). Façade variations were manipulated to have the same perforation ratio. From left to right: [1] Faena Aleph Residences, Foster + Partners, Buenos Aires, Argentina, 2012; [2] Selcuk Ecza Headquarters, Tabanlıoglu Architects, Istanbul, Turkey, 2013; [3] Kew House, Piercy & Company, Richmond, United Kingdom, 2014; [4] Federation Square, Lab Architecture Studio, Melbourne, Australia, 2002.
![Fig. 1. The selected façade geometry variations (top row) and the corresponding examples of contemporary architecture they were based on (bottom row). Façade variations were manipulated to have the same perforation ratio. From left to right: [1] Faena Aleph Residences, Foster + Partners, Buenos Aires, Argentina, 2012; [2] Selcuk Ecza Headquarters, Tabanlıoglu Architects, Istanbul, Turkey, 2013; [3] Kew House, Piercy & Company, Richmond, United Kingdom, 2014; [4] Federation Square, Lab Architecture Studio, Melbourne, Australia, 2002.](/cms/asset/7b1f0da6-90ba-4ace-b967-9bcf3c3b73ed/ulks_a_1999257_f0001_b.gif)
Previous research has shown that these façade variations led to the highest consensus among architects regarding their ability to render a space the least ex-citing (Pattern 1), most calming (Pattern 2), most exciting (Pattern 3), or least calming (Pattern 4) (, from left to right) from a total of 20 façade designs from contemporary architecture, manipulated to have an equal perforation ratio (Chamilothori et al. Citation2018).
2.2.1. Generation of immersive scenes
A multi-use room at the campus of the École polytechnique fédérale de Lausanne (EPFL) was selected as the base case for the creation of all experimental variations due to its accessibility and to its actual dual use as an area both for working and socializing. This space has a two-level ceiling, an east-facing fully glazed façade across its length, a west-facing window between the two ceiling levels (see ), and a wooden floor, divided by a row of concrete columns.
Fig. 2. Perspective view representing a participant’s viewpoint in virtual reality in scenes with Pattern 1 and 2 for all context and sky type combinations. Note that there is a narrow west-facing window between the two ceiling levels. The difference in brightness of this window between different sky conditions in these images is caused by external reflections and the applied tone-mapping algorithms.
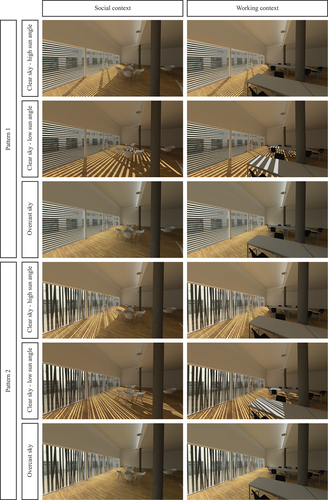
A digital model of this room was recreated in the Rhinoceros modeling software, with a width of 10.88 meters, a length of 21.19 meters, and a height of 3.43 and 5.72 meters at the lowest and the highest point of the ceiling, respectively. This model was then exported to the Radiance lighting simulation engine (Ward Larson Citation1994) using DIVA-for-Rhino (Jakubiec and Reinhart Citation2011), following the workflow from studies recreating daylit scenes in immersive virtual reality using physically-based renderings (Chamilothori et al. Citation2019b).
The main surfaces in the room were measured with a Konica Minolta CM-600d spectrophotometer to determine their reflectance values, and the visual transmittance of the glazing was approximated using vertical illuminance measurements with two LMT POCKET LUX 2 meters in overcast sky conditions, resulting in the Radiance material properties shown in .
Table 2. Radiance material properties for the main surfaces
To further increase the realism of the scene, a wooden floor texture was created from photographs of the floor in the room, ensuring that the average reflectance of the texture on the floor corresponded to the spectrophotometer measurements in the real environment. Similarly, the view out of the window was mapped to the Radiance sky through an HDR photograph taken in overcast conditions to avoid sharp shadows and created through automatic exposure bracketing using a Canon EOS 70D camera and a fisheye SIGMA 4.5 mm F2.8 EX DC HSM lens. The resulting mapping of the photograph to the Radiance sky was calibrated to ensure similar horizontal and vertical illuminance to the Radiance output without mapping.
For the factor Façade geometry, each of the four façade variations from Chamilothori et al. (Citation2018) was modeled in Rhinoceros and applied to the façade of the room, following the 40% (±1) perforation ratio of the original two-dimensional drawings. Where necessary, the resulting façade geometry variations were modified by reflecting the pattern along the Y axis or rotating the original or reflected pattern by 180° to avoid any visible seam or repetition in the pattern across the length of the façade.
Different levels of Sky type were created using gensky. Specifically, two variations of clear sky conditions were created using the coordinates of the Geneva area for the same date and different times of day, 10:36 AM and 9:00 AM, with the gensky parameters “03 15 10.6 +s -a 46 -o -6 -m -15” and “03 15 9 +s -a 46 –o -6 –m -15,” respectively. These settings allowed the generation of two sky types with a solar altitude of 33.5° and of 20.5°, respectively. The solar altitude of 33.5° was selected with the specific aim to create a boundary of direct sun that did not fall on the furniture, and the solar altitude of 20.5° was selected to allow direct sun in the depth of the room. To differentiate between these two conditions, they are referred to as “clear sky with high sun angle” and “clear sky with low sun angle,” respectively. In order to allow comparison between direct and diffuse daylight conditions, an overcast sky was also created using the setting “-c” in gensky.
Lastly, to represent the two levels of the factor Spatial context, two sets of furniture were placed on the Rhinoceros model. In particular, furniture of a lounge, with couches and low chairs was used to represent the social context, and furniture of an office, with desks, office chairs, and computers, was used to represent the working context.
Each combination of Façade geometry, Sky type, and Spatial context was exported to Radiance and rendered using high accuracy parameters, shown in . In order to create fully stereoscopic immersive scenes, renderings were created with a full 360° over-under stereo equirectangular projection using the Radiance script view360stereo.cal (Stock Citation2017), specifying a resolution of 12,960 by 12,960 pixels and a viewpoint placed closed to the center of the space. Moreover, to account for differences in the participant height, which was shown to be problematic in previous studies by the authors, four different viewpoint heights were generated based on anthropometric data (Huston Citation2013). These viewpoints, shown in , corresponded to different eye heights, and were shown to participants within a range of equivalent standing heights.
Table 3. Radiance simulation parameters
Table 4. Categories of stature, eye height, and corresponding participant height
The combination of four façade variations, three sky types, two spatial context scenarios, and four viewpoint heights resulted in a total of 96 scenes. Anti-aliasing was performed in each of the resulting HDR renderings by reducing its resolution to one third. These renderings were then tone-mapped with the Reinhard02 static tone-mapping operator (Reinhard et al. Citation2002), which has been shown to accurately reproduce the perceptual impressions of a real space in interactive 360° scenes (Murdoch et al. Citation2015).
The resulting tone-mapped images were cropped to create two images with a final resolution of 4320 by 2160 pixels, gamma-corrected with a factor of 2.0, and transformed to PNG files, each corresponding to the view from one eye. The gamma correction factor was derived from luminance measurements centered at the lens of the headset across a series of projected uniform grayscale scenes spanning 8 RGB levels ranging from fully white (RBG 255, 255, 255) to fully black (RGB 0,0,0), but later replication of these measurements (after the completion of the experiments) showed a different outcome with an ideal gamma correction factor of 2.3. Further measurements confirmed the latter gamma correction factor as the correct one, and thus the scenes shown in the experiments were gamma-corrected with a slightly lower factor than the required one.
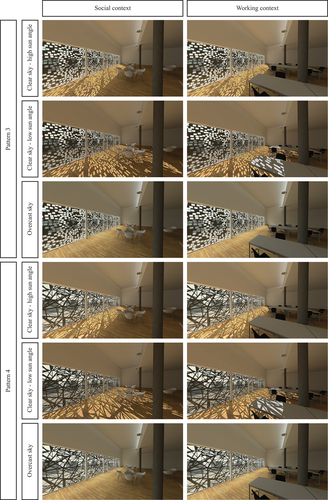
Lastly, the resulting pairs of images were imported to the gaming engine Unity, where they were applied as textures to two identical concentric spheres, specifying a gamma color space and an Unlit two-sided material, unaffected by light sources. By placing a virtual camera from the Unity Oculus Utilities in the center of these two spheres, the view direction in the scene was controlled through head movements in the VR headset. Each of these spheres was then projected to the corresponding eye in Unity, allowing the creation of a fully stereoscopic scene from a participant’s viewpoint. The resulting scenes were exported in individual executable files, each containing the façade variations to be seen by one participant. A series of perspective views representing a participant’s viewpoint in the different presented scenes can be seen in .
Fig. 3. Perspective view representing a participant’s viewpoint in virtual reality in scenes with Pattern 3 and 4 for all context and sky type combinations.
In order to ensure that the façade manipulation does not introduce changes in scene illuminance and thus add a confounding factor, the vertical illuminance at the center of the lens was measured with a LMT POCKET LUX 2 illuminance meter for all projected scenes, using the second lowest eye height. The façade variations were found to differ with a maximum factor of 1.05 within the same sky type and spatial context, below the threshold of 1.50 for a noticeable variation in illuminance (Comité Européen de Normalisation (CEN) Citation2011).
The same comparison was conducted for the color difference ∆E*ab (CEN Citation2007) between scenes, using the average RGB values of the equirectangular renderings and transforming them to the L*a*b color space. The maximum ∆E*ab between façade variations within the same combination of sky type and spatial context was found to be 0.90, below the threshold of 2.3 for noticeable color differences (Mahy et al. Citation1994). Similarly, within the same sky type, the maximum ∆E*ab was equal to 2.22, indicating no noticeable color differences between either spatial context or façade geometry variations.
2.3. Dependent variables
The present study employed dependent variables that regard both affective appraisals (i.e., how exciting or interesting the space is perceived, hereby named “perceptual impressions”) and room appraisals (i.e., how bright or spacious the space is perceived, hereby named “visual appearance”), following existing studies on the perception of daylit scenes (Cauwerts Citation2013; Rockcastle and Andersen Citation2014; Rockcastle et al. Citation2017b).
Specifically, the perceptual impressions of the space concern how pleasant, interesting, exciting, or calming the space is perceived, attributes which have been widely used to examine the effects of both daylit spaces (Cauwerts Citation2013; Chinazzo et al. Citation2021; Rockcastle et al. Citation2017a, Citation2017b) and of façade and daylight patterns (Abboushi et al. Citation2019; Chamilothori et al. Citation2019a) on occupants and have also been shown to be perceptually accurate in virtual reality (Abd-Alhamid et al. Citation2019; Chamilothori Citation2019; Chamilothori et al. Citation2019b; Higuera-Trujillo et al. Citation2017; Rockcastle et al. Citation2021).
Regarding the visual appearance of the scene, we examined the level of perceived complexity, an attribute which has been directly linked to the perceptual effects of façade design (Abboushi et al. Citation2019; Chamilothori et al. Citation2019a, Citation2016; Omidfar et al. Citation2015) and has also been demonstrated to be adequately represented in immersive virtual reality (Abd-Alhamid et al. Citation2019; Chamilothori Citation2019; Chamilothori et al. Citation2019b). Lastly, we examine the perceived brightness, spaciousness, and level of satisfaction with the amount of view in the space, attributes which have been shown to be affected by the design of openings in a space (Franz et al. Citation2005; Matusiak Citation2006; Ozdemir Citation2010; Stamps Citation2010).
While these last three attributes have also been successfully reproduced in immersive virtual reality (Abd-Alhamid et al. Citation2019; Chamilothori Citation2019), it is important to note that the perception of brightness has inherent limitations in immersive virtual reality, due to the currently available static tone-mapping operators, which cannot recreate the view-dependent adaptive behavior of the human eye. Thus, results regarding evaluations of brightness in virtual reality should generalized with caution, and additional studies are necessary to establish the extent of validity of brightness perception in immersive virtual environments.
All attributes were evaluated in a random order using an 11-point scale from 0 to 10, with 0 corresponding to “Not at all” and 10 corresponding to “Very,” as shown in . This scale range was chosen due to its ease of use and approximation of an interval scale (Wu and Leung Citation2017), as well as to offer the possibility of a neutral response. Moreover, the studied attributes were projected to the environment rather than the observer, an approach which is suggested to lead to a more stable variable (Küller Citation1991; Vogels Citation2008). As explained further in section 2.6, the questions were asked verbally, and the participant’s verbal rating was recorded for each question.
Table 5. Verbal questionnaire used in the study
2.4. Equipment
Two Oculus Rift CV1 VR headsets were used to present the stimuli (one in Norway, and one in Switzerland and in Greece). This VR headset has a 1080 × 1200 OLED display with a 110° diagonal field of view and a refresh rate of 90 Hz. To ensure the similarity of the devices used in the different countries, vertical illuminance and screen luminance measurements were performed, using identical procedures, a fully dark room, and the same scenes projected on each headset.
The vertical illuminance of the scenes corresponding to the second lowest eye height was measured at the center of the lens with a LMT POCKET LUX 2 lux meter for one of the headsets and a Hagner EC1 lux meter for the other. For this comparison, the testing dataset consisted of all combinations of sky type and spatial context for one façade geometry variation. The measurements of vertical illuminance between two VR headsets were found to differ with a maximum factor of 1.11, below the threshold of 1.50 for a just noticeable change in illuminance (Comité Européen de Normalisation (CEN) Citation2011) and corresponding to an absolute difference of 3.4 lux (Supplementary Materials Table S1). Moreover, the maximum luminance of the two devices was measured at the level of the lens for a fully white scene with a Konica Minolta CM-600d spectrophotometer (headset used in Switzerland and Greece) and a Minolta LS-100 luminance meter (headset used in Norway) and showed identical results, with a measured maximum luminance of 80 cd/m2 for the two headsets.
2.5. Participants
Participants were recruited through mailing lists, posters, and social media, and were asked to fulfil the following eligibility criteria: normal or corrected-to-normal vision, a minimum duration of 18 months of stay in the respective country, and English proficiency of C1 or higher, and age between 18 and 50 years. The minimum duration of stay in the country where the experiment took place was used to ensure cultural adaptation, according to the threshold for satisfactory adjustment to a foreign country (Lysgaand Citation1955). Lastly, due to the use of a head-mounted display, the eligibility criteria included an upper age threshold of 50 years to minimize the occurrence of presbyopia (Brückner Citation1967).
A total of 415 participants took part in the study, and 9 were removed from the dataset as it was found after the experimental session that they did not fulfil the eligibility criteria. The resulting sample size of 406 participants consisted of 150 participants in Norway, 118 in Switzerland, and 138 in Greece, as shown in .
Table 6. Demographic characteristics of participants in each country of study
summarizes the demographic characteristics of participants in each country. The gender distribution is shown to be similar across the three countries (57%, 51%, and 54% male participants in Norway, Switzerland, and Greece, respectively). Similarly, as the mean participant age (24.8 years in Norway, 27.4 years in Switzerland and 24.2 in Greece) in all countries is within age limits used to represent the same age bracket in lighting studies (19–30 years old, Kuijsters et al. Citation2012, 18–30 years old; Schweitzer et al. Citation2016), we consider the age distribution across the three countries to be sufficiently similar. Additional analyses on differences in participant age between countries are presented in Section 3.4.
Participants in each country were randomly allocated to one out of six possible groups, corresponding to all possible combinations of the between-subject factors Sky type and Spatial context. The resulting distribution of participants in each condition is shown in below.
Table 7. Distribution of sample size per country, spatial context, and sky type
The experimental studies were approved for Norway by the Norwegian Social Science Data Services, for Switzerland by the EPFL Human Research Ethics Committee (applications 008-2016 and 025-2017), and for Greece by the School of Architecture at the Technical University of Crete, and complied with the tenets of the Declaration of Helsinki. In all countries, participation was voluntary, followed written informed consent, and was compensated with a movie gift card in Norway and with monetary compensation in Switzerland and Greece.
2.6. Experimental protocol
Experiments in Norway, Switzerland, and Greece were conducted in September, June and May 2018, respectively. In all three countries, experiments took place in an office room during daytime, ensuring commonly found indoor environmental conditions and minimal noise. Air temperature measurements showed similar conditions between the three countries (Norway: µ = 21°C; Switzerland: µ = 25°C; Greece: µ = 24.4°C).
Experimental sessions were conducted individually for each participant and lasted approximately 30 minutes. In each session, participants were informed about the general purpose of the experimental study and, if they consented to take part in the experiment, they were introduced to the equipment and were given written definitions of the studied attributes (Supplementary Materials S1). Next, they were asked to fill in a demographic questionnaire with information such as their age, gender, and duration of stay in the corresponding country, and were asked to provide their height verbally in order to be presented with the corresponding view height in VR. After this step, they were shown how to use and adjust the VR headset in a training scene, and were instructed to remain standing in the same spot and explore the scene while standing by moving their head or turning in place.
Participants were randomly allocated to start with one of the two experimental phases, and after completing that, they continued with the second one after a small break. In both cases, before exposure to the first stimulus of each experimental phase, a uniformly colored scene with the average RGB value of all stimuli to be shown in that experimental session was projected in VR for 15 seconds to allow color and brightness adaptation in VR. Following this step, participants were asked to remain silent and explore the scene for 30 seconds, and were then presented with the immersive scene. When shown the first scene, they were asked to imagine they would be socializing or working, depending on the presented spatial context. After 30 seconds of scene exploration, participants were asked to respond to the verbal questionnaire with questions asked in random order. The procedure of the silent exploration period followed by the verbal questionnaire was followed for all stimuli. Stimuli were presented in random order.
2.7. Data analysis
Due to the use of a mixed within-between experimental design, with repeated measures for the factor Façade geometry, analyses were conducted using a Linear Mixed Model (LMM), which can take into account the correlated structure of the data (CEN Citation2018). To this end, the identification number of each participant was specified as a random factor, and the Country, Façade geometry, Sky type, and Context were specified as fixed effects. In order to address potential confounding factors, the gender of the participants, the order of the experimental phase, and the first façade geometry that was shown to each participant were added as covariates. The interaction Façade geometry*Country was added in the model to examine potential interaction effects, and was removed from the model whenever it was not significant.Footnote1 Separate LMM analyses were conducted for each dependent variable, and a Bonferroni-corrected significance level α’ = 0.05/56 = 0.00089 was used to account for the multiple analyses in 8 models with 7 terms in each.
Assumptions of homoscedasticity and linearity were checked for each LMM through visual inspection of the fitted values plotted against the residuals. Quantile-quantile plots and histograms of the residuals for each LMM were used to check the normality of the residuals. These assumptions were respected, with the exception of the model for perceived spaciousness, where residuals deviated from normality. This deviation was considered acceptable as the skewness (−0.21) and kurtosis (4.63) of the residuals were below the suggested thresholds of an absolute skewness of 2 and an absolute kurtosis of 7 (Kim Citation2013) and of an absolute skewness of 3 and an absolute kurtosis of 10 (Kline Citation2015). Collinearity was examined through Variance Inflation Factors (VIF) which were calculated for all variables in each LMM. The maximum VIF was found to be 1.25, below the conservative threshold of 3 (Zuur et al. Citation2010).
LMM analyses were conducted with the statistical software R (R Core Team Citation2018) and the packages lme4 (Bates et al. Citation2015, 4) and lmerTest (Kuznetsova et al. Citation2017). Marginal and conditional R2 are reported for each LMM, estimated using the R function r.squaredGLMM (Nakagawa et al. Citation2017). The statistical significance of the terms in each model was tested with type III Wald F tests with degrees of freedom estimated using the Kenward-Roger method of the car R package (Fox and Weisberg Citation2011). The Kenward-Roger method was chosen for its robustness and suitability for data with a large (N > 45) sample sizes, low skewness, and high kurtosis (Arnau et al. Citation2013), as is the present data with a sample size of 406 and a maximum skewness and kurtosis of −0.38 and 2.91, respectively, for reported spaciousness. Post-hoc pairwise contrasts were conducted with the R package emmeans (Lenth Citation2019) for significant main effects, applying the Šidák adjustment for multiple comparisons (Šidák Citation1967).
3. Results
This section reports the analysis of the significance of the terms in each LMM model, and the results of the relevant post-hoc pairwise comparison in the case of a significant main effect. The interaction term Façade geometry*Country failed to meet our adjusted significance threshold (all ps>0.002), and thus was removed from subsequent analyses.
An overview of the results of the LMM analyses for the main factors of interest Country, Façade geometry, Spatial context and Sky type is shown in . For clarity, the following sections will discuss the results grouped by predictor, examining regional effects, effects of factors manipulated in the experiment, and lastly potential confounding factors.
Table 8. Results of the LMM analysis for the main factors of interest Country, Façade geometry, Spatial context, and Sky type on all dependent variables
presents the marginal and conditional R2 of the LMM for each studied attribute. Results show that the proportion of explained variance is much greater for the conditional R2, where the random effects are taken into account. Following the thresholds in the literature (Ferguson Citation2009), the conditional R2 for the models shown in can be interpreted as moderate to strong, with up to 61.3% of the variance explained in the case of reported brightness.
Table 9. Marginal and conditional R2 of the LMM for each studied attribute
3.1. Regional effects
A significant effect of the factor Country was found for the reported brightness in the space (F(2,391.94) = 10.72, p < .0001). The effect of Country approached significance for the evaluations of how exciting the space was perceived, but failed to meet our set threshold (F(2, 391.88) = 5.46, p = .0046), and no effect was found for the other studied attributes (all ps > 0.067). presents the estimated marginal means, standard errors, and 95% CI per country and per studied attribute.
Table 10. Estimated marginal means (EMM), standard errors (SE), and 95% confidence intervals (CI) per attribute and country
Post-hoc contrast comparisons between countries for the reported brightness, shown in , showed a significant difference between participants in Norway and Greece (Δ = 0.80, p < .0001), with the participants in Norway rating the scenes more negatively (EMMNorway = 5.56, SENorway = 0.13) than those in Greece (EMMGreece = 6.63, SEGreece = 0.12). No significant differences were found between responses in Greece and Switzerland or Switzerland and Norway (all ps > 0.06).
Fig. 4. Estimated marginal means, standard deviations, and pairwise comparisons of reported brightness across countries. Asterisks represent statistical significance in the pairwise comparisons. The notation **** indicates p < .0001.
The use of the same stimuli and equipment in all countries, as discussed in Sections 2.3 and 2.4, demonstrates that the significant difference in evaluations of brightness between participants in Greece and Norway is indeed a regional effect, with an estimated increase of 7% in reported brightness for the former. Nevertheless, these results should be interpreted with caution due to the limited dynamic range and the static tone-mapping of the immersive VR scenes, discussed in Section 2.3, which restrict the generalizability of this outcome.
3.2. Effects of factors manipulated in the experimental scenes
This section presents the results regarding the factors that were manipulated in the experimental scenes using the same LMM models (including the factor Country), this time examining the effects of the stimuli across countries.
The LMM analysis showed a consistent significant effect of the factor Façade geometry for all dependent variables. Regarding the perceptual attributes of the space, the façade geometry significantly influenced how pleasant (F(3,1215.93) = 29.20, p < .00001), calming (F(3,1215.95) = 46.98, p < .00001), interesting (F(3,1215.88) = 98.01, p < .00001), and exciting (F(3,215.89) = 86.96, p < .00001) the scene was evaluated. In the same vein, the façade geometry significantly influenced how bright (F(3,1215.82) = 74.26, p < .00001), complex (F(3,1215.9) = 175.91, p < .00001), and spacious (F(3,1215.81) = 21.12, p < .00001) the scene was perceived, as well as the level of satisfaction with the amount of view in the space (F(3, 1215.89) = 188.35, p < .00001).
The factor Spatial context approached significance for the evaluations of how pleasant (F(1,403.6) = 6.87, p = .009) and calming (F(1,402.71) = 6.09, p = .01) the space was perceived, but failed to meet our adjusted significance threshold (all other ps > 0.08). Moreover, no significant effects were found for the factor Sky type (all ps > 0.08), showing that the Façade geometry was the main factor influencing the participants’ responses. Descriptive statistics (estimated marginal means, standard errors, and 95% CI) for the dependent variables across variations in Spatial context and Sky type can be found in Table S2 and S3 in the Supplementary Materials.
3.3. Pairwise comparisons between façade variations
Following the consistent significant effect of façade geometry on all studied attributes, this section examines the perceptual effects of individual façade geometry variations and presents the post-hoc pairwise comparisons between these variations. summarizes the estimated marginal means, standard errors, and 95% CI.
Table 11. Estimated marginal means (EMM), standard errors (SE), and 95% confidence intervals (CI) per attribute and façade geometry variation, color-coded from the lowest (white) to the highest (dark gray) mean. Results are averaged over the levels of the other factors in the LMM
As mentioned earlier, we will refer to these variations as Pattern 1, 2, 3, and 4. The descriptive statistics in show that specific patterns led to distinct changes in the perception of the same scene, with Pattern 1 leading to the lowest mean evaluations in terms of how interesting, exciting, and complex the space is perceived, and Pattern 4 leading to the highest mean evaluations for the same attributes. Pattern 3 led to lower mean evaluations in how pleasant, calming, spacious, and bright the space was perceived, as well as to the lowest mean satisfaction with the amount of view in the space. These trends are in alignment with the results of the pairwise comparisons, shown in .
Fig. 5. Estimated marginal means and standard error per country and per façade geometry variation for the attributes pleasant, interesting, exciting, and calming. Pairwise comparisons are shown between façade variations (averaged across levels of country, sky type, and context). Asterisks represent statistical significance in the pairwise comparisons: *** indicates p < .001 and **** indicates p < .0001.
Fig. 6. Estimated marginal means and standard error per country and per façade geometry variation for the attributes complex, bright, spacious, and satisfaction with the amount of view in the space. Pairwise comparisons are shown between façade variations (averaged across levels of country, sky type, and context). Asterisks represent statistical significance in the pairwise comparisons: *** indicates p < .001 and **** indicates p < .0001.
To further explore the effect of façade variation on participant responses, we will examine the pairwise comparisons between façade variations and the difference Δ between the estimated marginal means of different attributes. As illustrated in , Pattern 3 led to a significant decrease in how pleasant the space was perceived compared to Patterns 1, 2, and 4, with a maximum estimated decrease equal to 10.9% in our 11-point scale (Δ = −1.20, SE = 0.08, p < .0001) when compared to Pattern 2. At the same time, Pattern 2 led to the space being perceived as the most pleasant, with significantly higher evaluations compared to Pattern 1, 3, and 4.
Similarly, Pattern 2 led to the highest ratings of how calming the space was perceived, with a significant difference compared to Patterns 3 and 4, but not to Pattern 1. Specifically, Pattern 2 led to a maximum estimated increase of 10% in our 11-point scale when compared to Pattern 3 (Δ = 1.10, SE = 0.11, p < .0001) and to Pattern 4 (Δ = 1.07, SE = 0.11, p < .0001). Pattern 1 also led to a significant increase in how calming the space was perceived compared to these two façade variations, with a maximum estimated increase of 7.3% in evaluations when compared to Pattern 3 (Δ = 0.80, SE = 0.11, p < .0001) and of 7% when compared to Pattern 4 (Δ = 0.77, SE = 0.11, p < .0001).
The findings regarding how interesting and exciting the space was perceived are very similar between them and agree with the observations of the descriptive statistics in . Pattern 1 led to the lowest evaluations and Pattern 4 led to the highest evaluations for these two attributes, with significant differences both between them and between all other façade variations. In particular, Pattern 1 led to a maximum decrease of 15.4% in reported interest (Δ = 1.69, SE = 0.10, p < .0001) and of 14.8% in reported excitement (Δ = 1.63, SE = 0.10, p < .0001) when compared to Pattern 4.
With regard to complexity¸ as illustrated in , all façade variations were shown to be significantly different between them, with the exception of Patterns 3 and 4. The direction of the effect showed that Pattern 1 was evaluated as significantly less complex than Pattern 2 (Δ = 1.05, SE = 0.10, p < .0001), which was in turn rated as significantly less complex than Pattern 3 (Δ = 0.94, SE = 0.10, p < .0001) and Pattern 4 (Δ = 1.16, SE = 0.10, p < .0001). The maximum change in reported complexity was found between Patterns 1 and 4, with a difference of 20% in reported complexity (Δ = 2.20, SE = 0.10, p < .0001) between these two variations.
Lastly, the significant effect of façade geometry on reported brightness, spaciousness, and satisfaction with the amount of view in the space is shown to be mainly driven by Pattern 3. In particular, Pattern 3 led to a significant decrease in all three attributes compared to the other façade variations, with a maximum decrease of 9.4% in perceived brightness (Δ = 1.03, SE = 0.08, p < .0001) and 4.7% in perceived spaciousness (Δ = 0.52, SE = 0.07, p < .0001) when compared to Pattern 2. The largest effect was found for the level of satisfaction with the amount of view in the space, with Pattern 3 leading to a maximum 22.6% decrease in participant evaluations (Δ = 2.49, SE = 0.11, p < .0001) when compared to Pattern 4. For this attribute, a significant difference was found also between Patterns 1 and 4, with the latter leading to a 4.7% increase (Δ = 0.52, SE = 0.11, p = .0001) in the reported satisfaction with the amount of view.
3.4. Effects of possible confounding factors
The analysis of the covariates showed no significant effect for the first pattern that was shown (all ps > 0.0025) or the gender of the participants (all ps > 0.013) for our Bonferroni-corrected significance threshold. The order of the experimental phase (whether the experimental phase with varying façade variations or with varying window sizes, as described in Section 2.1, were conducted first) had a significant effect on the evaluations of how complex the space was perceived (F(1,405) = 12.02, p = .0006, all other ps > 0.012), with participants exposed first to the experimental phase with window variations rating the complexity of the façade variations in the subsequent experimental phase more positively (EMMwindowfirst = 5.35, SEwindowfirst = 0.11, EMMfaçadefirst = 4.82, SEfaçadefirst = 0.11).
Although the results from the experimental phase with window variations showed a significant effect of window size on perceived complexity (Moscoso et al. Citation2021a, Citation2021b), that effect was smaller than the one observed for the façade variations, with a maximum difference of Δ = 0.59 between window sizes compared to that of Δ = 2.20 found between façade variations. It is thus possible that participants who took part first in the experimental phase with varying window sizes used these stimuli as an anchor, which affected their subsequent responses. To test the validity of complexity-related findings, the LMM analysis for perceived complexity was repeated using only the responses of participants exposed first to the experimental phase with façade variations (thus with no order bias). The outcomes of this smaller sample showed identical results with the main analysis both for the main effects and the pairwise comparisons between façade variations.
Another point worth noting is the high percentage (70%) of participants in Switzerland whose country of origin was not their country of residence, which might have unwanted cultural influences for the present study despite the minimum threshold of 18 months of cultural adaptation. In order to examine potential effects from this difference between participants, LMM analyses were conducted for each spatial attribute only for the participants in Switzerland, using the same factors as the main analysis (façade geometry, sky type, spatial context, and the control variables gender, order of experimental phase, first pattern shown) and country of origin (with two levels, Switzerland or other). Three participants who reported having spent time in Switzerland equal to their actual age were assigned to Switzerland as “country of origin.” The analysis showed no significant influence of country of origin for ratings of pleasantness, interest, excitement, complexity, and satisfaction with the amount of view (all ps > 0.33). Although the outcomes for Country of origin on the ratings of calmness (F(1,115.46) = 5.12, p = .026), brightness (F = (1,121.5) = 5.02, p = .026) and spaciousness (F(1,121.5) = 5.59, p = .020) are below the conventional threshold for significance level (p = .05), they fail to meet our Bonferroni-corrected significance level for multiple analyses (0.05/8 = 0.00625), and thus are not considered critical for the interpretation of the main results of this study.
To further examine effects of nationality, Country of origin was added as an additional fixed factor with two levels (country of origin being same or different than the country of study) in the LMM of the main analyses for participants in all three countries. The results showed no significant effect of Country of origin on the evaluations of pleasantness, interest, excitement, complexity, spaciousness, or satisfaction with the amount of view (all ps > 0.14) and a significant effect on evaluations of brightness (F(1, 429.07) = 4.77, p = .02) and calmness (F(1, 410.07) = 7.73, p = .006), which however did not meet our Bonferroni-corrected significance threshold. Participants whose country of origin was different than the country of study rated the scene as more calm (EMM = 5.66, SE = 0.25) and more bright (EMM = 6.29, SE = 0.24) than participants who were born in the country of study (calmness: EMM = 5.13, SE = 0.22; brightness: EMM = 5.89, SE = 0.22). For the attributes of calmness and brightness, the interaction between Country and Country of Origin was added in the LMM as a fixed factor and was not significant (all ps > 0.52). Given the high percentage of different nationalities within participants in Switzerland, but not in Greece or Norway, this effect of country of origin does not influence the difference in perceived brightness between Greece and Norway found in the present study, but nevertheless warrants further research.
Lastly, a Kruskal-Wallis analysis of variance was used to compare the participant age between the three countries, since the data was not normally distributed. Results showed a significant effect of Country on Age (χ2(2) = 13.77, p = .001). Post-hoc pairwise comparisons with a Wilcoxon Rank Sum test showed a significant difference in participant age between Switzerland and Greece (W = 9953, p = .0013) and Switzerland and Norway (W = 10,815, p = .001), but not between Norway and Greece (W = 9972.5, p = .591), which can thus not explain the difference in perceived brightness between participants in Norway and in Greece.
4. Discussion
4.1. Limitations
This experimental study, repeated in Norway, Switzerland, and Greece using virtual reality, is the first to examine regional differences in the perception of façade and daylight patterns from the northernmost to the southernmost part of Europe, while also investigating the effect of sky type and spatial context on the experience of space. As such, this work brings unique insights on the similarities and differences in the perception of daylit spaces across these European latitudes. Nevertheless, the use of virtual reality, which was deemed necessary in this study to ensure full control of the experimental stimuli across countries, imposes several limitations which should be acknowledged.
A central limitation from the use of virtual reality is the restricted luminance range of the device. This shortcoming means that it is not possible to induce visual discomfort in our experimental scenes, and as a result, the presented stimuli are inherently comfortable, which might not be the case in high luminance conditions (Osterhaus Citation2009). Another critical point is the tone-mapping of the 360° immersive scenes, which was conducted with currently available tone-mapping operators which are unable to adapt the compression dynamically depending on the view direction. As discussed in Section 2.3, this approach can create important discrepancies from the brightness perception of real scenes, particularly in conditions with widely varying luminances in different view directions. While this limitation does not directly impact the outcomes on brightness perception in this study, where we focus on relative differences in the perception of the same scene across variations in façade geometry or across countries, it severely restricts the generalizability of findings. Further studies are necessary to test the robustness of brightness perception and the range of lighting conditions that can be adequately represented in virtual reality.
The results of the present study showed no significant influence of sky type on the perception of space, indicating that the effect of the façade geometry overshadowed that of the sky type. Although the Linear Mixed Model analysis directly addresses the presence of repeated measures, the use of the façade geometry as a within-subject factor inherently places emphasis on this variable, which was the only changing element of the scenes seen by each participant. In addition, the surface of the furniture covered with direct sun in the variation with clear sky and low sun angle was rather limited. This choice of experimental condition was done intentionally to avoid an association of the direct sunlight on the desk with disability glare situations, which are out of the scope of this study and could be prevented by individual shading measures on each desk. However, a stronger manipulation, for example with direct sun covering all the furniture present in the space, might lead to different outcomes. Additional studies employing the sky type as a within-subject factor are necessary to investigate this finding further and to compare the relative effect of façade geometry and of sky type on the perception of occupants.
An additional methodological limitation is the restricted exposure time to the studied scenes, where participants were exposed in the virtual environment for a minimum of 30 seconds, and remained immersed in the scene for a maximum of few minutes, until they completed the verbal questionnaire. The exact viewing time was measured in Greece and Switzerland, and the average viewing time (including the initial 30 second exposure and the remaining exposure time that was dictated by the participants) was found to be around two minutes (in both countries: mean = 131.3 s, SD = 51.4 s; in Greece: mean = 137.4 s, SD = 53.3 s; in Switzerland: mean = 124.9 s, SD = 38.6 s). While this duration of exposure is common for the collection of immediate subjective responses to a daylit environment (Abboushi et al. Citation2019; Cauwerts Citation2013), it limits the generalizability of the findings to cases of longer exposure. As such, the experimental findings of this study can be applied to conditions with equivalent duration of exposure time. Additional studies are necessary to examine the applicability of these findings over longer periods of time, although negative effects using a VR headset for a very long time have to be considered then as well.
Along with the exposure time, the methodological choices for the characteristics of the studied experimental stimuli impose another set of boundary conditions on the generalizability of the research findings of this study. The perforation ratio, depth, and material of the façade were kept constant to ensure the validity of the conclusions that can be drawn. Consequently, experimental findings are expected to hold true for conditions with similar characteristics, and further studies are needed to test and expand their applicability over a wider range of attributes. Similarly, the studied functions of the space (working or socializing) were represented by changes in the depicted furniture as well as verbal instructions. While this approach is closer to real world conditions compared to using only verbal instructions as in previous studies (Butler and Biner Citation1989; Chamilothori et al. Citation2016; Wang and Boubekri Citation2010), further research is needed to test the effects of participants actually conducting different activities.
The subject of sociocultural effects on the perception of façade and daylight variations also warrants further research. An important limitation in the present study was that the three experiments were conducted in different seasons (late spring, early summer, and early fall in Greece, Switzerland, and Norway, respectively). In addition, while in the present study we consider the collected participant responses to be representative of the socio-economic context of Norway, Switzerland, and Greece, further research is necessary to examine whether the present findings are replicated both within and between countries in Europe.
Although significant differences were found only for the perception of brightness between participants in Greece and Norway, such effects might be more common or more pronounced between populations with wider cultural and geographical differences. Moreover, the experiments in this study were conducted with participants from western, educated, industrialized, rich and democratic societies, a common limitation of research on human psychology and behavior (Henrich et al. Citation2010). Additional demographic characteristics, such as age, social class, or education level can be used to further test the generalizability of research findings across different populations.
4.2. Overview of main findings
By replicating the same experiment in Norway, Switzerland, and Greece, using virtual reality, the present study examined the regional differences in the perception of façade and daylight patterns, while also investigating the influence of sky type and spatial context on participant responses.
Findings showed no significant differences between the responses of participants in Greece and Switzerland or Norway and Switzerland, and a significant difference between Greece and Norway only in the evaluation of brightness in the scene, with participants in Greece rating the scenes as brighter compared to participants in Norway. This finding should be generalized with caution due to possible seasonal influences from the conduction of experiments in late spring (Greece) and early fall (Norway) and to the limited dynamic range of the VR headset. Nevertheless, this outcome suggests a potential regional effect – solely for perceived brightness – between these extreme latitudes within Europe.
The outcomes of the experimental phase with varying window sizes in the present study, published in Part I of this article, are in alignment with the present findings: a significant effect of Country was found for the evaluation of pleasantness, calmness, excitement, and brightness (Moscoso et al. Citation2021a). In the present study, in addition to the significant effect of Country on brightness, the factor Country approached significance (but did not meet our corrected threshold) for excitement, but not for pleasantness or calmness. Both the present findings and those in Moscoso et al. (Citation2021a) show that for all spatial attributes where responses from participants in Greece and Norway differ, the former are higher than the latter, suggesting a consistent regional effect. It is worth noting that in Part I of this article, significant differences were also found in the responses between participants in Greece and Switzerland, once again with higher ratings for participants in Greece (Moscoso et al. Citation2021a). The direction of the effect might also be explained by the season, as previous studies controlling for meteorological factors have shown significant differences in mood levels between both spring and fall and between summer and fall, with prevalence of negative mood in the fall (Huibers et al. Citation2010). Further studies are necessary to examine whether the effect observed in the present study is explained by season or by regional influences.
The results of the present study demonstrate that the perceptual impressions – such as how pleasant, interesting, calming, or exciting a space is perceived – of façade and daylight patterns are similar between northern, central, and southern Europe, using Norway, Switzerland, and Greece as case studies. This is a particularly promising outcome for applications of the findings of this study in the building sector, suggesting that the studied façade variations are perceived similarly – with the possible exception of perceived brightness – within these latitudes in Europe. The consistency in participant responses in these three countries are also very encouraging for a wider application of design and lighting guidelines, such as the recent European standard “Daylight in buildings” (European Committee for Standardization CEN Citation2019). In addition, the outcomes of this study suggest that the presence of direct sun patches in the space does not lead to negative evaluations of the space, at least when it clearly has no negative impact on visual comfort or on visual performance, as is the case in the presented VR scenes. This finding is in line with the recommendations of EN17037 regarding minimum sunlight exposure (European Committee for Standardization CEN Citation2019).
Results showed a consistent significant effect of façade geometry on all studied attributes. No significant effect of the sky type or the spatial context experienced by each participant was found, indicating that the façade geometry was the main factor influencing the participants’ evaluations. This outcome is particularly relevant for applications in architecture, as it reveals that the perceptual effects of façade geometry can be anticipated across lighting conditions and uses of a space, rendering the façade geometry an important driver of the occupants’ spatial experience throughout the year.
The comparison of the studied façade geometry variations showed that Pattern 1, the variation with horizontal stripes, led to the space being evaluated as the least complex, interesting, and exciting, while Pattern 4, which was evaluated as the most complex, led to the highest reported interest and excitement, in line with previous studies on the effect of façade geometry on occupant perception (Abboushi et al. Citation2019; Chamilothori et al. Citation2019a, Citation2016). These results demonstrate that irregularity and complexity in the façade design can be a desirable feature, particularly for applications where there is no conflict between the attention to a task and the surrounding environment, such as in a social context. While further research is needed to examine the generalizability of these findings across façade variations with different characteristics, the outcomes of the present study challenge the current state of prevalent façade and shading system designs, bringing into question the suitability of repetitive horizontal elements for applications where impressions of visual interest are of importance.
Lastly, the façade geometry significantly influenced the reported brightness, spaciousness, and the level of satisfaction with the amount of view in the space, and a single façade variation – with small and irregularly distributed rectangular openings – was found to be the main driver of this result. This outcome suggests that both the size and the composition of façade openings are important factors contributing to the occupants’ experience of space, and motivate further research with a wider range of façade characteristics to uncover additional links between façade design and occupant perception.
5. Conclusion
This study presented a mixed-design experiment in virtual reality where a total of 406 participants in Norway, Switzerland, and Greece evaluated their impressions of a daylit interior space across a series of façade geometry variations of a constant aperture ratio under different combinations of sky type and spatial context. The aim of this experiment was to investigate regional differences in the participants’ impressions of the façade and corresponding daylight patterns, while examining the influence of sky type and spatial context on these impressions. Immersive 360° scenes generated from physically-based renderings were used to maintain experimental control. Participants were asked to rate both emotional (how pleasant, interesting, exciting, and calming the space was perceived) and visual (how complex, bright, and spacious they found the space, and how satisfied they were with the amount of view in the space) attributes of the scene in a verbal questionnaire.
Results showed an influence of country only in the case of perceived brightness, where a significant difference was found between the responses of participants in Greece and Norway, with participants in Greece evaluating the scenes as brighter than those in Norway. While this outcome is particularly interesting and warrants further research, it should be generalized with caution due to the restricted luminance range and static tone-mapping of the displayed immersive scenes, which can limit the representation of brightness in VR, as well as potential seasonal effects due to the timing of the experiments. From the factors that were varied in the experimental scenes, the façade geometry had a consistent influence on the perception of space, while the spatial context and sky type that each participant was exposed to did not show a significant effect. The studied façade geometry variations affected all studied spatial attributes, inducing changes up to 15% in the perceptual impressions (such as the reported interest and excitement) and up to 22% in the scalable attributes (such as the level of satisfaction with the amount of view) of the presented scene. Although restricted to a virtual reality setting, the findings of the present study are particularly promising for applications in architectural practice and façade industry, as they delineate the façade as a critical design element with significant effects on the occupants’ experience of space, consistent across variations in the lighting conditions and use of space, as well as across countries in northern, central, and southern Europe.
Supplemental Material
Download PDF (132.1 KB)Acknowledgments
The study was a collaboration between the Light and Colour Centre at NTNU in Trondheim and the Laboratory of Integrated Performance in Design at EPFL in Switzerland. The authors would like to express their gratitude to the experiment participants and to the reviewers for their valuable feedback. Lastly, the authors would like to thank Prof. Konstantinos-Alketas Oungrinis and the Transformable and Intelligent Environments Lab at the Technical University of Crete for their support in the conduction of the experiments in Greece.
Disclosure statement
No potential conflict of interest was reported by the authors.
Supplementary material
Supplemental data for this article can be accessed on the publisher’s website.
Additional information
Funding
Notes
1. The specification of the final models was as follows: IndependentVariable ~ FacadeGeometry + SkyType + SpatialContext + Gender + FirstPatternShown + ExperimentalPhaseOrder + (1|Participant).
References
- Abboushi B, Elzeyadi I 2018a. Do visually interesting sunlight patterns impact occupants’ perceived glare? IES Research Symposium 2018. Atlanta, GA, USA. p. 11.
- Abboushi B, Elzeyadi I 2018b. The relationship between sunlight pattern geometry and visual comfort in daylit offices. Proceedings of the ARCC Conference. Philadelphia: ARCC. p. 9.
- Abboushi B, Elzeyadi I, Taylor R, Sereno M. 2019. Fractals in architecture: the visual interest, preference, and mood response to projected fractal light patterns in interior spaces. J Environ Psychol. 61:57–70.
- Abboushi B, Elzeyadi I, Wymelenberg KVD, Taylor R, Sereno M, Jacobsen G. 2020. Assessing the visual comfort, visual interest of sunlight patterns, and view quality under different window conditions in an open-plan office. LEUKOS. 17(4): 321–337.
- Abd-Alhamid F, Kent M, Bennett C, Calautit J, Wu Y. 2019. Developing an innovative method for visual perception evaluation in a physical-based virtual environment. Build Environ. 162:106278.
- Akaliyski P. 2017. Sources of Societal Value Similarities across Europe: Evidence from Dyadic Models. Comp Sociol. 16(4):447–470. doi:https://doi.org/10.1163/15691330-12341432.
- Arnau J, Bendayan R, Blanca MJ, Bono R. 2013. The effect of skewness and kurtosis on the robustness of linear mixed models. Behav Res Methods. 45(3):873–879.
- Bates D, Mächler M, Bolker B, Walker S. 2015. Fitting linear mixed-effects models using lme4. J Stat Softw. 67(1):1–48.
- Biner PM, Butler DL, Fischer AR, Westergren AJ. 1989. An arousal optimization model of lighting level preferences: an interaction of social situation and task demands. Environ Behav. 21(1):3–16.
- Borisuit A, Linhart F, Scartezzini J-L, Münch MM. 2015. Effects of realistic office daylighting and electric lighting conditions on visual comfort, alertness and mood. Light Res Technol. 47(2):192–209.
- Boubekri M, Hull RB, Boyer LL. 1991. Impact of window size and sunlight penetration on office workers‘ mood and satisfaction. Environ Behav. 23(4):474–493.
- Boyce PR. 2003. Human factors in lighting. London (UK): Taylor & Francis.
- Boyce PR. 2014. Editorial: light distribution – a missing variable. Light Res Technol. 46(6):617.
- Brückner R. 1967. Longitudinal research on the eye (Basal studies, 1955–1965). Gerontol Clin (Basel). 9(2):87–95.
- Butler DL, Biner PM. 1987. Preferred lighting levels variability among settings, behaviors, and individuals. Environ Behav. 19(6):695–721.
- Butler DL, Biner PM. 1989. Effects of setting on window preferences and factors associated with those preferences. Environ Behav. 21(1):17–31.
- Cauwerts C 2013. Influence of presentation modes on visual perceptions of daylit spaces [Doctoral issertation]. Louvain-la-Neuve (Belgium): Université catholique de Louvain.
- CEN. 2007. 11664-4:2008: colorimetry – part 4: CIE 1976 L*a*b* Colour space Tech. Rep. Brussels (Belgium). doi:https://doi.org/10.109/4PDIS-91-4-0467B.
- CEN. 2018. Daylight in buildings. In: European standard NSEN 17037:2018. Brussels (Belgium): European Committee for Standardization.
- Chamilothori K 2019. Perceptual effects of daylight patterns in architecture [Dissertation]. Lausanne (Switzerland): Ecole polytechnique fédérale de Lausanne. https://infoscience.epfl.ch/record/270116
- Chamilothori K, Chinazzo G, Rodrigues J, Dan-Glauser ES, Wienold J, Andersen M. 2019a. Subjective and physiological responses to façade and sunlight pattern geometry in virtual reality. Build Environ. 150:144–155.
- Chamilothori K, Wienold J, Andersen M 2016. Daylight patterns as a means to influence the spatial ambiance: a preliminary study. Proceedings of the 3rd International Congress on Ambiances. Volos, Greece.
- Chamilothori K, Wienold J, Andersen M. 2018. Façade design and our experience of space: the joint impact of architecture and daylight on human perception and physiological responses. Proceedings of the Light Symposium 2018 Conference. Stockholm, Sweden.
- Chamilothori K, Wienold J, Andersen M. 2019b. Adequacy of immersive virtual reality for the perception of daylit spaces: comparison of real and virtual environments. LEUKOS. 15(2–3):203–226.
- Chinazzo G, Chamilothori K, Wienold J, Andersen M. 2021. Temperature–color interaction: subjective indoor environmental perception and physiological responses in virtual reality. Hum Factors . 63(3):474–502.
- Comité Européen de Normalisation (CEN). 2011. Light and lighting – lighting of work places – part 1: indoor work places (EN 12464-1-2011). Paris (France): CEN.
- Corrodi M, Spechtenhauser K. 2008. Illuminating: natural light in residential architecture. Basel (Boston, Berlin): Birkhäuser.
- European Committee for Standardization CEN. 2019. EN17037:2019 daylight in buildings.
- Ferguson CJ. 2009. An effect size primer: a guide for clinicians and researchers. Prof Psychol Res Pract. 40(5):532–538.
- Flynn JE, Spencer TJ, Martyniuk O, Hendrick C. 1973. Interim study of procedures for investigating the effect of light on impression and behavior. J Illum Eng Soc. 3(1):87–94.
- Fox J, Weisberg S. 2011. An R companion to applied regression. 2nd edn. Thousand Oaks (CA): Sage.
- Franz G, Von der Heyde M, Bülthoff HH. 2005. An empirical approach to the experience of architectural space in virtual reality—exploring relations between features and affective appraisals of rectangular indoor spaces. Autom Constr. 14(2):165–172.
- Galasiu AD, Veitch JA. 2006. Occupant preferences and satisfaction with the luminous environment and control systems in daylit offices: a literature review. Energy Build. 38(7):728–742.
- Haans A. 2014. The natural preference in people’s appraisal of light. J Environ Psychol. 39:51–61.
- Hawkes RJ, Loe DL, Rowlands E. 1979. A note towards the understanding of lighting quality. J Illum Eng Soc. 8(2):111–120.
- Heerwagen JH, Heerwagen DR. 1986. Lighting and psychological comfort. Light Des Appl. 16(4):47–51.
- Henrich J, Heine SJ, Norenzayan A. 2010. The weirdest people in the world? Behav Brain Sci. 33(2–3):61–83.
- Higuera-Trujillo JL, López-Tarruella Maldonado J, Llinares Millán C. 2017. Psychological and physiological human responses to simulated and real environments: a comparison between photographs, 360° panoramas, and virtual reality. Appl Ergon. 65:398–409.
- Huibers MJH, de Graaf LE, Peeters FPML, Arntz A. 2010. Does the weather make us sad? Meteorological determinants of mood and depression in the general population. Psychiatry Res. 180(2–3):143–146.
- Huston RL. 2013. Fundamentals of Biomechanics. Boca Raton (FL): CRC Press.
- IESNA. 2012. IES LM-83-12 IES Spatial Daylight Autonomy (sDA) and Annual Sunlight Exposure (ASE). IESNA Lighting Measurement Report No.: IES LM-83-12. New York (NY, USA): Illuminating Engineering Society of North America (IESNA).
- Inanici M, Wymelenberg KVD 2009. A study of luminance distribution patterns and occupant preference in daylit offices. Proceedings of PLEA 2009. Quebec City, Canada. http://www.idlboise.com/pdf/papers/Luminance_Preference_03062009_WEB.pdf
- Jakubiec JA, Reinhart CF 2011. DIVA 2.0: integrating daylight and thermal simulations using Rhinoceros 3D, Daysim and EnergyPlus. Proc Build Simul 2011. Syndey (Australia). [accessed 2013 May 31]. http://www.ibpsa.org/proceedings/BS2011/P_1701.pdf
- Kim H-Y. 2013. Statistical notes for clinical researchers: assessing normal distribution (2) using skewness and kurtosis. Restor Dent Endod. 38(1):52–54.
- Kline RB. 2015. Principles and practice of structural equation modeling. 4th edn. New York (NY): Guilford Publications.
- Kuijsters A, Redi J, de Ruyter B, Seuntiëns P, Heynderickx I 2012. Effects of ageing on atmosphere perception. In: Proceedings of Experiencing Light 2012. Eindhoven, The Netherlands. p. 1–5.
- Küller R. 1991. Environmental assessment from a neuropsychological perspective. In Gärling T, Evans G, editors, Environment, cognition and action: An integrated approach. New York (NY): Oxford University Press. p. 111–147.
- Kuznetsova A, Brockhoff P, Christensen R. 2017. lmerTest package: tests in linear mixed effects models. J Stat Softw. 82(13):1–26.
- Leather P, Pyrgas M, Beale D, Lawrence C. 1998. Windows in the workplace sunlight, view, and occupational stress. Environ Behav. 30(6):739–762.
- Lee JS, Kim BS. 2007. Development of the nomo-graph for evaluation on discomfort glare of windows. Sol Energy. 81(6):799–808.
- Lenth R. 2019. emmeans: Estimated Marginal Means, aka Least-Squares Means. R package version 1.7.0.
- Liu XY, Luo MR, Li H. 2015. A study of atmosphere perceptions in a living room. Light Res Technol. 47(5):581–594.
- Loe DL, Mansfield KP, Rowlands E. 1994. Appearance of lit environment and its relevance in lighting design: experimental study. Light Res Technol. 26(3):3.
- Lysgaand S. 1955. Adjustment in a foreign society: norwegian Fulbright grantees visiting the United States. Int Soc Sci Bull. 7:45–51.
- Mahy M, Eycken LV, Oosterlinck A. 1994. Evaluation of uniform color spaces developed after the adoption of CIELAB and CIELUV. Color Res Appl. 19(2):105–121.
- Markus TA. 1967. The significance of sunshine and view for office workers. Proceedings of the CIE Intersessional Conference. Rotterdam, The Netherlands.
- Matusiak BS. 2006. The impact of window form on the size impression of the room—full-scale studies. Archit Sci Rev. 49(1):43–51.
- McCulloch CE, Searle SR. 2001. Generalized, Linear, and Mixed Models. New York (NY): Wiley-Interscience
- Moscoso C, Chamilothori K, Wienold J, Andersen M, Matusiak B. 2021a. Regional differences in the perception of daylit scenes across europe using virtual reality. Part I: effects of window size. LEUKOS 1–22. doi:https://doi.org/10.1080/15502724.2020.1854779.
- Moscoso C, Chamilothori K, Wienold J, Andersen M, Matusiak B. 2021b. Window size effects on subjective impressions of daylit spaces: indoor studies at high latitudes using virtual reality. LEUKOS. 17(3):242–264.
- Murdoch MJ, Stokkermans MGM, Lambooij M. 2015. Towards perceptual accuracy in 3D visualizations of illuminated indoor environments. J Solid State Light. 2(1):159–165.
- Nabil A, Mardaljevic J. 2005. Useful daylight illuminance: a new paradigm for assessing daylight in buildings. Light Res Technol. 37(1):41–57.
- Nakagawa S, Johnson PCD, Schielzeth H. 2017. The coefficient of determination R2 and intra-class correlation coefficient from generalized linear mixed-effects models revisited and expanded. J R Soc Interface. 14(134):134.
- Okamura A, Odaka N, Suzuki H, Kirkegaard PH, Osterhaus W 2016. Impression evaluation of paper folding lamp shade by japanese students and comparison with results by danish students. Proceedings of the 17th International Conference on Geometry and Graphics. Beijing (China). p. 7.
- Omidfar A, Niermann M, Groat LN 2015. The use of environmental aesthetics in subjective evaluation of daylight quality in office buildings. Proceedings of IES Annual Conference. Indianapolis (IN).
- Omidfar Sawyer A, Chamilothori K 2019. Influence of subjective impressions of a space on brightness satisfaction: an experimental study in virtual reality. Proceedings of the Symposium on Simulation for Architecture and Urban Design 2019. Atlanta, GA, USA. p. 57-64.
- Osterhaus W 2009. Design guidelines for glare-free daylit work environments. In: Proceedings of Lux Europa 2009. Istanbul, Turkey. p. 8.
- Osterhaus WKE 1993. Office lighting: a review of 80 years of standards and recommendations. Conference Record of the 1993 IEEE Industry Applications Conference Twenty-Eighth IAS Annual Meeting. Vol. 3. Toronto, ON, Canada: IEEE. p. 2365–2374. [accessed 2019 May 22]. http://ieeexplore.ieee.org/document/299211/
- Osterhaus WKE. 2005. Discomfort glare assessment and prevention for daylight applications in office environments. Sol Energy. 79(2):140–158.
- Osterhaus WKE, Bailey IL 1992. Large area glare sources and their effect on discomfort and visual performance at computer workstations. Proceedings of the 1992 IEEE Industry Applications Society Annual Meeting. Houston, TX, USA. p. 1825–1829. //A1992BY79K00264.
- Ozdemir A. 2010. The effect of window views’ openness and naturalness on the perception of rooms’ spaciousness and brightness: a visual preference study. Sci Res Essays. 5(16):13.
- Park N-K, Farr CA. 2007. The effects of lighting on consumers’ emotions and behavioral intentions in a retail environment: a cross-cultural comparison. J Inter Des. 33(1):17–32.
- Parpairi K, Baker NV, Steemers KA, Compagnon R. 2002. The luminance differences index: a new indicator of user preferences in daylit spaces. Light Res Technol. 34(1):53–66.
- Pierson C, Piderit B, Iwata T, Bodart M, Wienold J. 2021. Is there a difference in how people from different socio-environmental contexts perceive discomfort due to glare from daylight? Light Res Technol. 1477153520983530. doi:https://doi.org/10.1177/1477153520983530
- R Core Team. 2018. R: a language and environment for statistical computing. Vienna (Austria): R Foundation for Statistical Computing.
- Reinhard E, Stark M, Shirley P, Ferwerda J 2002. Photographic tone reproduction for digital images. Proceedings of the 29th Annual Conference on Computer Graphics and Interactive Techniques. New York, NY, USA: ACM. (SIGGRAPH ’02). p. 267–276.
- Reinhart CF, Mardaljevic J, Rogers Z. 2006. Dynamic daylight performance metrics for sustainable building design. LEUKOS. 3(1):7–31.
- Roche L, Dewey E, Littlefair P. 2000. Occupant reactions to daylight in offices. Int J Light Res Technol. 32(3):119–126.
- Rockcastle S, Danell M, Calabrese E, Sollom-Brotherton G, Mahic A, Van Den Wymelenberg K, Davis R. 2021. Comparing perceptions of a dimmable LED lighting system between a real space and a virtual reality display. Light Res Technol. 1477153521990039. doi:https://doi.org/10.1177/1477153521990039
- Rockcastle SF, Amundadottir M, Andersen M. 2017a. Contrast measures for predicting perceptual effects of daylight in architectural renderings. Light Res Technol. 49(7):882–903.
- Rockcastle SF, Andersen M. 2014. Measuring the dynamics of contrast & daylight variability in architecture: a proof-of-concept methodology. Build Environ. 81:320–333.
- Rockcastle SF, Chamilothori K, Andersen M 2017b. Using virtual reality to measure daylight-driven interest in rendered architectural scenes. Proceedings of Building Simulation 2017. San Francisco, CA, USA.
- Schweitzer S, Schinagl C, Djuras G, Frühwirth M, Hoschopf H, Wagner F, Schulz B, Nemitz W, Grote V, Reidl S, Pritz, P, Moser, M, Wenzl, FP . 2016. Investigation of gender- and age-related preferences of men and women regarding lighting conditions for activation and relaxation. Proc. SPIE 9954, Fifteenth International Conference on Solid State Lighting and LED-based Illumination Systems. San Diego (CA). p. 99540L. doi:https://doi.org/10.1117/12.2237897.
- Šidák Z. 1967. Rectangular confidence regions for the means of multivariate normal distributions. J Am Stat Assoc. 62(318):626–633.
- Stamps AE. 2010. Effects of permeability on perceived enclosure and spaciousness. Environ Behav. 42(6):864–886.
- Stock MJ. 2017. view360stereo.cal: Definitions for full 360 over-under stereo equirectangular projection. Radiance script version 1.3.
- Stokkermans M, Vogels I, de Kort Y, Heynderickx I. 2017. Relation between the perceived atmosphere of a lit environment and perceptual attributes of light. Light Res Technol. 1477153517722384. doi:https://doi.org/10.1177/1477153517722384
- Van Den Wymelenberg K, Inanici M, Johnson P. 2010. The effect of luminance distribution patterns on occupant preference in a daylit office environment. LEUKOS. 7(2):103–122.
- Veitch JA, Fotios SA, Houser KW. 2019. Judging the scientific quality of applied lighting research. LEUKOS. 15(2–3):97–114.
- Veitch JA, Hine DW, Gifford R. 1993. End users’ knowledge, beliefs, and preferences for lighting. J Inter Des. 19(2):15–26.
- Veitch JA, Newsham GR. 2000. Preferred luminous conditions in open-plan offices: research and practice recommendations. Light Res Technol. 32(4):199–212.
- Vogels I. 2008. Atmosphere metrics - development of a tool to quantify experienced atmosphere. In: Westerink JHDM, Ouwerkerk M, Overbeek TJM, Pasveer WF, de Ruyter B, editors. Probing experience: from assessment of user emotions and behaviour to development of products. Dordrecht, The Netherlands: Springer. p. 25–41.
- Wang N, Boubekri M. 2010. Investigation of declared seating preference and measured cognitive performance in a sunlit room. J Environ Psychol. 30(2):226–238.
- Ward Larson G 1994. The RADIANCE lighting simulation and rendering system. In: Proceedings of the 21st annual conference on Computer graphics and interactive techniques. New York, NY, USA: ACM. (SIGGRAPH ’94). p. 459–472. doi: https://doi.org/10.1145/192161.192286.
- Wienold J, Christoffersen J. 2006. Evaluation methods and development of a new glare prediction model for daylight environments with the use of CCD cameras. Energy Build. 38(7):743–757.
- Wu H, Leung S-O. 2017. Can likert scales be treated as interval scales?—a simulation study. J Soc Serv Res. 43(4):527–532.
- Yoshizawa N, Aya K, Kato M, Yamaguchi H, Hara N, Miki Y, Dumortier D, Jost S, Iborra Bernard M 2015. A comparison study on spatial brightness evaluation between different cultural groups. Proceedings CIE Session 2015. Vol. 1. Manchester (UK).
- Zuur AF, Ieno EN, Elphick CS. 2010. A protocol for data exploration to avoid common statistical problems. Methods Ecol Evol. 1(1):3–14.