
ABSTRACT
LEDs simplify the personalization of lighting. However, research on the effects of personalizable lighting is in its infancy. The present study investigates the impact of personalizable workplace lighting on subjective parameters, cognition, and physiological stress while performing cognitive tests. In a cross-over design, 22 participants were randomly assigned to standard workplace lighting and lighting with adjustable illuminance and color temperature for two hours on two separate days. Subjective outcome measures were sleepiness, affect, and asthenopic complaints. We further assessed vigilance and three cognitive domains (task switching, working memory, and information processing) and derived heart rate variability parameters from an electrocardiogram. Some beneficial effects of personalizable lighting on cognitive performance were observed, although the overall results remain inconclusive. Standard and personalizable lighting did not differ in subjective ratings and physiological stress responses. Exploratory analysis of personalizable lighting revealed significant variation in self-selected workplace illuminances and limited variation in self-selected correlated color temperatures. Despite the preference for increased workplace illuminance under personalizable lighting, no visual impairment was observed compared to standard lighting. Personalizable workplace lighting is a promising new design feature to support individual visual and nonvisual lighting needs in daylight-deprived environments.
1. Introduction
Lighting design standards (e.g., EN 12464–1; European Committee for Standardization Citation2021) require an average horizontal illuminance of at least 500 lx in the visual task area of office workplaces. Other standards, such as the WELL Building StandardTM (International WELL Building Institute Citation2023), place additional emphasis on nonvisual (circadian) effects in the workplace and further require a melanopic equivalent daylight illuminance (melanopic EDI) of at least 136 lx (Tier 1) to 250 lx (Tier 2) at eye level. A recently published expert consensus paper by Brown et al. (Citation2022) also recommends a melanopic EDI of 250 lx throughout the daytime, preferentially by providing daylight at workplaces.
Visual task lighting in office environments typically combines artificial lighting from ceiling-mounted luminaires (Dikel et al. Citation2018) with daylighting by placing workstations nearby windows. Consequently, daylight harvesting reduces the need for artificial lighting and thus saves energy while still maintaining the minimum task illuminance required in offices as measured by desk illuminance sensors (Kent et al. Citation2022).
While ceiling-mounted lighting designs are able to provide variable indoor lighting by utilizing specifically configured lighting control systems, these lighting designs usually do not allow to adjust the light intensity and correlated color temperature (CCT) for a single workplace but only for larger office areas. However, research indicates that adjustable single workplace lighting may be essential to fulfill individual light preferences (Boyce et al. Citation2006b; Despenic et al. Citation2017; Escuyer and Fontoynont Citation2001; Fotios and Cheal Citation2010). Research has further shown that preferred light settings vary widely and depend on the available range of lighting parameters, with a bias toward the mid-point of this range (Fotios and Cheal Citation2010; Logadóttir et al. Citation2011, Citation2013). In addition, preferred illuminances vary across visual tasks (Boyce et al. Citation2000, Citation2006b) and during the day (Newsham et al. Citation2008).
The discovery of intrinsically photosensitive ganglion cells (ipRGCs) in the human retina led to intensive research on nonvisual light effects. This research has focused on physiological, alertness-related, and cognitive light effects (Cajochen Citation2007). In particular, exposure to short-wavelength light and short-wavelength enriched polychromatic white light so far showed mixed results on alertness, working memory, and information processing speed during the day (Lok et al. Citation2018; Phipps-Nelson et al. Citation2009; Smolders et al. Citation2012) and at night (Souman et al. Citation2018). Similar mixed effects have been found in studies with bright polychromatic white light (Lok et al. Citation2018; Phipps-Nelson et al. Citation2003).
Recently, several systematic reviews summarized potential nonvisual light effects, particularly during the day (Lok et al. Citation2018; Pachito et al. Citation2018; Souman et al. Citation2018; Stefani and Cajochen Citation2021). In more detail, these reviews reported daytime bright light effects on subjective alertness, for instance the reviews by Lok et al. (Citation2018) and Souman et al. (Citation2018). Lok and colleagues found that 14 of the 18 studies they examined reported a significant effect of increased illuminance on daytime subjective alertness. Similarly, Souman and colleagues found 21 out of 32 studies reporting a significant effect of increased illuminance on subjective alertness during the day. However, so far only a small number of studies have investigated light effects on performance measures of alertness (e.g., reaction time tasks). These studies used a variety of measures (Phipps-Nelson et al. Citation2003; Smolders and de Kort Citation2014; Huiberts et al. Citation2016; Maierova et al. Citation2016; Münch et al. Citation2016; Borragán et al. Citation2017; Te Kulve et al. Citation2017; see also the review by Lok et al. Citation2018) and reported results were mixed: in the systematic review by Lok et al. (Citation2018), only 5 out of 10 studies reported a significant effect of bright light on alertness tasks and in the review by Souman et al. (Citation2018), only 2 out of 13 studies reported a significant effect of increased illuminance on performance measures of alertness during daytime.
Research has shown that the autonomic nervous system (ANS) responds to light exposure via the ipRGCs (Cajochen Citation2007). In previous studies, light exposure either increased sympathetic and decreased parasympathetic activity (Choi et al. Citation2011; Kohl et al. Citation2020; Rüger et al. Citation2006; Smolders et al. Citation2012; Tsunoda et al. Citation2001) or exerted complementary effects (Canazei et al. Citation2014, Citation2017; Kohl et al. Citation2020; Litscher et al. Citation2013; Uttley et al. Citation2013). A systematic review by Lok et al. (Citation2018) summarized these inconclusive findings with regards to daytime bright light effects on the ANS. The authors concluded that the included studies employed heterogeneous study designs and recorded various outcome parameters for ANS activity, such as heart rate, various heart rate variability parameters, and the tonic skin conductance level which both aggravates the summary of study results (Lok et al. Citation2018).
Within the framework of this study, personalizable lighting is defined as single workplace lighting that can manually be adjusted in its color temperature and illuminance. To date, personalizable lighting has often been studied in terms of optimizing energy use and user satisfaction (Boyce et al. Citation2006b; Chraibi et al. Citation2016, Citation2017; Malavazos et al. Citation2015; Uttley et al. Citation2013). In these studies, subjects could either select a preset light condition (Boyce et al. Citation2006b) or adjust the illuminance and/or CCT (Chraibi et al. Citation2016, Citation2017; Malavazos et al. Citation2015; Uttley et al. Citation2013). However, the adjustment ranges and anchor points (i.e., starting points of the adjustment task) varied considerably between these studies (e.g., Uttley et al. used two scales from 40–500 lx or 40–700 lx, while Chraibi et al. used a scale from 294–749 lx). The findings of these studies broadly suggest that personalizable lighting has the potential to decrease energy usage, while simultaneously preserving or even enhancing user satisfaction. This observation could be attributed to the fact that personal lighting levels typically fall short of the prescribed standards (e.g., 500 lx according to EN 12464–1; European Committee for Standardization Citation2021). Consequently, there is a reduced demand for electricity to illuminate spaces, resulting in significant energy savings.
To date, only a small number of studies has investigated nonvisual effects of personalized lighting. These studies have already demonstrated the positive effects of individually adjustable workplace desk illuminance on satisfaction with lighting quantity and quality, mood, motivation, vigilance, and productivity (Boyce et al. Citation2006a; Despenic et al. Citation2017; O’Brien and Gunay Citation2014; Veitch et al. Citation2008). Comparing studies with personalizable lighting or self-selected lighting is challenging because each study uses different available ranges of illuminance and CCT as well as different control systems. It is crucial to consider the available range in studies with personalized lighting, as the strong influence of the available range (range bias) on the selection made is already well documented in the literature (Fotios and Cheal Citation2010; Logadóttir et al. Citation2011, Citation2013; Kent et al. Citation2019). Compared to the present study, the study by Maierova et al. (Citation2016) is the most similar in that it investigated nonvisual effects (including working memory and alertness) of self-selected lighting with variable illuminance and CCT (i.e., the selectable illuminances at eye level ranged from 5 lx to 1400 lx and the three selectable CCTs were 2700K, 3000K, and 4000K, respectively). In the study by Maierova and colleagues, self-selected lighting improved mood and working memory performance compared to dim lighting.
In the present study, the selectable illuminance and correlated color temperature range were extensive (up to 6000 lx horizontally at the desk and between 2200 K and 5300 K) compared to other studies (e.g., Boyce et al. Citation2006b; Maierova et al. Citation2016). Previous studies have also shown that the available illuminance range strongly influences workplace lighting preferences: the higher the selectable illuminance, the higher the chosen illuminance (Fotios and Cheal Citation2010; Logadóttir et al. Citation2011). Thus, we expected subjects to select workplace lighting that generates both visual comfort and high vertical illumination, which potentially could trigger acute alerting effects akin to those observed in bright light intervention studies (Lok et al. Citation2018; Souman et al. Citation2018). Logadóttir et al. (Citation2013) found that self-selected workplace light color is also influenced by the available range of CCTs, while Fotios (Citation2017) noted that CCT variation between 2500 K and 6500 K does not affect visual comfort. Based on these inconclusive study results, we had no specific hypothesis regarding self-selected CCT in our study.
The present study not only investigates light effects on alertness but also higher cognitive functions (i.e., sustained attention, information processing speed, and cognitive flexibility) during and immediately after exposure to self-selected workplace lighting. We expected improved vigilance and consequently also better cognitive functioning under personalizable lighting. Regarding the ANS activity, we further hypothesized altered parasympathetic activity under the personalizable light setting. In addition, we expected reduced subjective sleepiness and improved mood but no effect on asthenopic complaints under self-selected workplace lighting.
2. Materials and methods
2.1. Study protocol
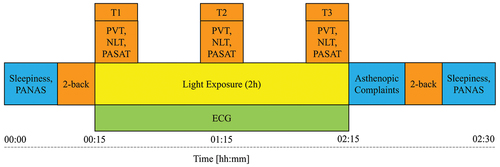
The study implemented a repeated measures design. Participants were exposed to standard workplace lighting according to EN 12464–1 (500 lx horizontally at 5300 K; European Committee for Standardization Citation2021) and an individually adjustable light setting for two hours each on separate days in a randomized, counterbalanced order. Study days were within a week of each other (with at least one day off between the two study days), and data collection took place at the same local time for each subject between 08:00 a.m. and 07:00 p.m. We offered four different time slots (08:00 a.m. to 10:30 a.m.; 10:50 a.m. to 01:20 p.m.; 01:40 p.m. to 04:10 p.m.; 04:30 p.m. to 07:00 p.m.). Participants were free to choose their time slot, but were not allowed to switch the time slot once the study started. The study room was illuminated with ambient light (free-standing luminaires) immediately before and after the light exposure. The main goal of the present study was to quantify acute light effects on vigilance and different higher cognitive functions. Therefore, the cognitive tasks were performed immediately after the start of the exposure (T1), after one hour (T2), and at the end of the light exposure (T3). In addition, an electrocardiogram allowed us to derive HRV parameters during the tests and resting periods.
To keep the cognitive load for the study participants reasonable and to avoid practice effects when performing cognitive tasks repeatedly within a short period (Münch et al. Citation2012), working memory was quantified only immediately before and after light exposure. In addition, subjective sleepiness and affect ratings were also assessed only before and after light exposure. Finally, participants rated asthenopic complaints once at the end of light exposure.
Data collection took place during the winter period between November 2020 and March 2021 in Innsbruck (Austria). The length of the day varied between approx. 10 hours (early November), approx. 8.5 hours (late December) approx. 9.5 hours (late January), approx. 11 hours (late February) and approx. 12.5 hours (late March). The total number of hours of sunshine was 142 hours in November, 69 hours in December, 100 hours in January, 162 hours in February and 186 hours in March. The study protocol was approved by the Ethics Review Board of the University of Innsbruck (No. 32/2020). All participants signed written informed consent prior to participation and received financial compensation or course credit. A graphical overview of the study protocol is shown in .
Fig. 1. Diagram of the study protocol. Blue color indicates questionnaires, orange color indicates cognitive tests. Green indicates physiological measures. Tasks were completed in the order in which they are listed. PVT = psychomotor vigilance task - measures vigilance; NLT = number letter task – measures cognitive flexibility; PASAT = paced auditory serial addition task – measures attention and information processing speed; 2-back = working memory task – measures working memory capacity; PANAS = positive and negative affect scale – measures mood state; T1 = first measurement; T2 = second measurement; T3 = third measurement.
2.2. Participants
Students at the University of Innsbruck (Austria), recruited through posts on various social media channels, first completed an online screening questionnaire. Subjects with suicidal ideation (assessed with the BDI-II questionnaire; Kühner et al. Citation2007), depression and frequent headaches (assessed with the PHQ-D questionnaire; Löwe et al. Citation2002), diagnosed sleep disorders, psychiatric disorders, eye diseases, seasonal affective disorder (assessed with the PIDS-SA questionnaire; Terman and Williams Citation1993) and increased photosensitivity (assessed with a single yes/no item: “Do you suffer from increased sensitivity to light; e.g., typically leaving the house on sunny days with sunglasses?”) were excluded. We further excluded subjects taking performance-enhancing medication, sleep medication, and medication that increases photosensitivity and subjects who changed medication two weeks before the study. Additionally, we measured the subjects’ corrected midpoint of sleep (Ghotbi et al. Citation2020) and excluded individuals with extremely early or late sleep periods (i.e., if the corrected midpoint of sleep was earlier than 2:30 a.m. or later than 6:30 a.m.). Since college students frequently suffer from irregular sleep patterns, the acceptable range for this study was defined slightly wider than usual (Forquer et al. Citation2008; Ghotbi et al. Citation2020).
The study sample comprised 22 subjects (18 female, 4 male) with a mean age of 21 ± 2 years (range: 19–27 years). By including 22 study participants, applying a two-factor repeated measures ANOVA, and selecting a power of 0.8, we were able to detect small to medium light effects (Cohen’s f = 0.23 to 0.26) as described in the review of Souman et al. (Citation2018).
Further information on the sample and screening questionnaire can be found in the Supplementary Materials (Tables S1 and S2).
2.3. Measures
2.3.1. Subjective measures
Study participants rated subjective sleepiness on a self-developed 5-point Likert scale with labels inspired by the Karolinska Sleepiness Scale, KSS (Akerstedt and Gillberg Citation1990; Akerstedt et al. Citation2014). Since the KSS includes an extreme item response range (e.g., “fighting sleep” or “extremely alert”), we removed the two highest and lowest response options. The remaining response items were: 1 = very awake, 2 = fairly awake, 3 = normal awake, 4 = fairly sleepy, 5 = very sleepy. To avoid confusion with the KSS, we refer to it as the “sleepiness scale.”
The German version of the Positive and Negative Affect Schedule (PANAS) assesses affect (Breyer and Bluemke Citation2016; Crawford and Henry Citation2004). In several previous studies, the PANAS has been used to measure the affect state in light intervention studies (Knez Citation1995; Plitnick et al. Citation2010; Viola et al. Citation2008). The scale consists of 20 adjectives (ten positive and ten negative affective states). Participants rate each item on a 5-point Likert scale (1 = not at all, 2 = a little, 3 = moderately, 4 = quite a bit, 5 = extremely). Cronbach’s alpha for the Positive and Negative Affect scale were .906 and .891, respectively.
Subjects rated adverse light effects at the end of the light exposure using the following ten self-formulated items for asthenopic complaints: eye strain, headache, watery eyes, itchy eyes, burning eyes, blurred vision, pain in or around the eyes, glare, dizziness, and nausea. The rating scale was a 6-point Likert scale (1 = not noticeable, 2 = hardly noticeable, 3 = somewhat noticeable, 4 = clearly noticeable, 5 = strongly noticeable, 6 = very strongly noticeable). A total score for asthenopic complaints was derived by summing up the ratings of the ten items (range: 10–60). Cronbach’s alpha was .820.
2.3.2. Cognitive performance tasks
The cognitive test battery included the Psychomotor Vigilance Task (PVT), which measures vigilance (Thomann et al. Citation2014). Participants viewed a black screen on which a red stopwatch counter appeared after two seconds. As soon as the counter appeared, participants had to press the space bar as quickly as possible. The software then displayed the reaction time on the screen, and after a randomized interstimulus interval (2–10 s), the next trial started. In our study, the PVT took approximately 6–7 minutes in total (including instructions and feedback screen). The duration of the actual test was fixed, which was 1-minute habituation phase followed by 5-minute test phase. Only the data from the test phase were included in the analysis. The outcome parameters of the PVT are reaction speed (inverse of the reaction time) and the number of lapses (reaction times > 500 ms).
Light effects on working memory capacity were quantified using a 2-back task with visual and auditory stimuli (Jaeggi et al. Citation2010), which has been used in lighting research (Chellappa et al. Citation2011; Huiberts et al. Citation2015; Münch et al. Citation2012; Phipps-Nelson et al. Citation2003, Citation2009; Smolders et al. Citation2012; Stefani et al. Citation2020). Participants see blue squares at eight random locations on a black computer screen or hear eight letters in random order via headphones. Participants must press a response key if a visual or auditory stimulus matches the stimulus two trials earlier (blue square in the same location or same spoken letter), if no stimulus matches, no response is required. The visual and auditory stimuli were presented simultaneously with separate response keys for the visual and auditory tasks. After ten practice trials, the test begins. Each stimulus is presented for 500 ms, after which participants have 2500 milliseconds to respond. A hit is a correct response, and a false alarm is a response to a non-target stimulus. Based on the number of hits (H) and false alarms (FA) for the visual and auditory stimuli, an overall mean score is derived across the two perceptual domains (i.e., the proportion of hits minus false alarms averaged across both tasks and the entire test duration). In our study, the 2-back task consisted of 120 trials (60 visual and 60 auditory stimuli, respectively) and took 9 minutes to complete. This multimodal 2-back task was used to ensure that subjects focused the screen while performing the visual task, while the auditory task was used as a pure measure of subjects’ attention. The individual scores in the two tasks (calculated as d’ (d-prime) values) as well as descriptive statistics on the reaction times in the two tasks were also evaluated separately and can be found in the Supplementary Materials. Only the total score is reported in the main text.
Executive functions were assessed with the Number Letter Task (NLT) and the Paced Auditory Serial Addition Task (PASAT). The NLT implements a task-switching paradigm that was first introduced by Miyake et al. (Citation2000). Participants see a 2 × 2 matrix on a black computer screen and a letter-number pair in one matrix cell (e.g., U2). The letter-number pair moves clockwise through the four matrix cells, changing in each cell. Two different tasks (i.e., a letter task and a number task) needed to be performed depending on the location of the pair in the matrix. In the letter task, participants must press the space bar when the presented letter is a consonant. In the number task, participants must press the space bar when an odd number is shown. The letter task must be performed in the top two cells of the matrix, and the number task must be performed in the bottom two cells of the matrix. The first trial after each task change is called a switch trial. In this study, the percentage of correct answers and the reaction speed for correct answers were calculated separately for the switch and non-switch trials and used as outcome variables. The inter-trial interval after a correct response was 150 ms, and after an incorrect response, 1500 ms. Participants first trained and ran through 64 letter tasks and 64 number tasks. The test duration was 7–8 minutes.
The PASAT is an auditory test that measures the integrative capacity for sustained attention and information processing (Gronwall Citation1977; Strauss et al. Citation2006). The participant hears a sequence of single-digit numbers and must continuously add up the last two numbers. The participant must select the correct answer by clicking on the appropriate number from a list of possible answers on the computer screen. The intervals between the spoken numbers decrease as the test progresses, increasing the difficulty of the task. The interval between spoken numbers is 4000 ms for 11 practice trials, 2400 ms for level 1, 2000 ms for level 2, 1600 ms for level 3, and 1200 ms for level 4. We derived the number of correct responses and the reaction speed (inverse of reaction time) for correct answers for each of the four difficulty levels. There were 60 trials for each of the four difficulty levels (240 trials in total). The total test time was 10 minutes.
The PVT, 2-back task, NLT, and PASAT were administered using the Inquisit software (www.millisecond.com) and presented on a 32” monitor (Philips Momentum 326M6VJRMB) with a black background. The luminance of the monitor was 70 cd/m2.
2.3.3. Physiological measurements
We continuously recorded single-channel electrocardiograms (ECGs) during light exposure. ECGs were recorded at a sampling rate of 1000 Hz using the Bittium Faros 180 device (Bittium Corporation, Oulu, Finland). Raw ECG data were transferred to Cardioscope Analytics software (Smart Medical, Gloucestershire, UK), and heart rate and the heart rate variability parameter pNN50% of differences between successive beat-to-beat intervals that exceed 50 ms), indicative of PNS activity, were derived.
2.4. Workplace luminaire and ambient light settings
The workplace luminaire used in this study is a prototype developed by Bartenbach GmbH (Aldrans, Austria). It has 72 warm-white (2200 K) and 72 cold-white (5300 K) LEDs (Lumileds Luxeon Z-ES; 144 LEDs in total) with a total wattage of 288 W and an average efficacy of 101 lm/W. The LED light sources were covered from direct view and the back wall and desk could be illuminated separately. This allowed the participants to adjust the workplace lighting, i.e., illuminance and correlated color temperature (CCT), separately for the back wall and the desk. Illuminance and CCT could be controlled independently (e.g., increasing illuminance without changing CCT). The adjustable range of illuminances and CCTs was presented separately, with both scales showing low values on the left side and higher values on the right side of the scale (see ). At the beginning of the adjustment task, both scales were set to the center.
Fig. 2. Screenshot of the desktop user interface to personalize workplace lighting.
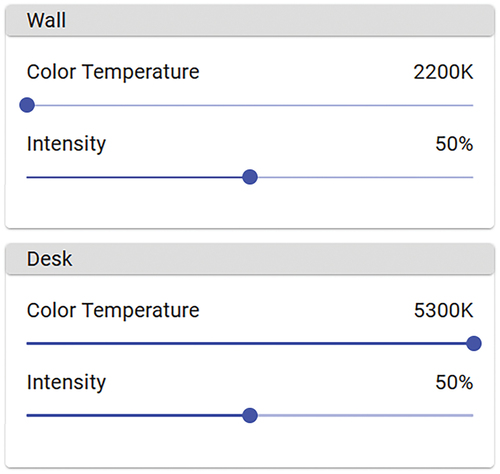
In the present study, CCT and illuminance were adjustable between 2200 K and 5300 K and 60 lx and 6000 lx, respectively. Participants could adjust the illuminance in 1% increments (corresponding to a 60 lx change in horizontal illuminance) and the CCT in thirty-one 100 K increments (numbered from 1 to 32 between 2200 K to 5300 K).
First, the experimenter demonstrated the range of available CCTs and illuminances, separately for desk and wall lighting, and gave a brief instruction on how to adjust the user interface shown on the screen. This was done to anchor the response range to the available stimulus range (Kent and Fotios Citation2021) and to make it easier for study participants to visualize the available setting options. The participants were then instructed to select their personal workplace lighting in terms of optimizing visual comfort (i.e., to perform office work on the monitor and at the desk at one’s subjective most preferable level while minimizing visual discomfort) as there is some evidence that visual comfort may mediate the effect of light on alertness (Veitch et al. Citation2008, Citation2011).
During the adjustment task, the user interface () was visible on the monitor and a piece of paper with instructions was placed on the table. The participants were fully focused on selecting their preferred settings and had no other task at the time. The starting point for selecting the light setting was at the 50% level for the desk and back wall illuminance (which corresponds to 3000 lx) and step 17 for the CCT (which corresponds to 3800 K). The adjustment task was completed in less than 5 minutes by the participants. The selected lighting settings were then maintained for the entire duration of the study and could not be changed at any time. Standard workplace lighting (control condition) was set at 500 lx at the desk and back wall and due to a technical error at 5300 K instead of 4000 K (). Descriptive lighting data for the control condition are presented in .
Fig. 3. Workplace lighting situation during the control condition (5300 K).
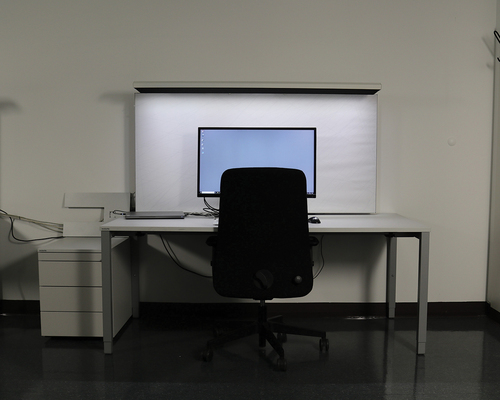
Table 1. Light settings under personalized lighting and the control condition. α-opic measurements were taken at eye level. CCT = correlated color Temperature; EDI = equivalent daylight illuminance.
The web platform luox (Spitschan et al. Citation2021) was used to derive the melanopic EDIs for the control condition and Personalized Lighting. In the control condition, subjects were exposed to 86 melanopic EDI, whereas under Personalized Lighting, subjects were exposed between 182 lx and 754 melanopic EDI. We did not perform photometric measurements for each subject in the control condition but performed photometric measurements from different heights as part of the preparations for the study. These measurements showed that the measured values for different eye heights, viewing directions, and distances varied by no more than 5%.
Blinds prevented daylight from entering the study room. Free-standing luminaires provided ambient lighting before and after the 2-hour light exposure (4000 K; 57 lx at desk level and 11 lx at eye level). During the 2-hour light exposure, all workplace luminaires were switched on and set to the same level to provide adequate room lighting. Due to COVID-19 restrictions, only one participant was allowed to stay in the study room at a time. We controlled for possible differences in light effects between the time slots (e.g., morning vs. afternoon), but found no significant differences. Ambient air temperature was not monitored during the study, but was measured in a small pilot study before the study started (temperatures ranged from 22 to 24°C).
2.5. Statistics
Data are presented as mean and standard deviation (SD) unless otherwise stated. Graphs show the mean and 95% confidence interval (CI). For data not violating the requirements for statistical testing, two-way repeated measures analyses of variance (ANOVA) were computed with pairwise post-hoc comparisons using the Bonferroni-Holm-correction. Data violating the test requirements (i.e., subjective sleepiness, negative affect, PVT false starts, NLT correct answers, PASAT reaction speed, and correct answers) were analyzed with non-parametric procedures, i.e., the Friedman test and Wilcoxon test. Bonferroni-adjusted α levels were used for all non-parametric tests.
In some cases (<5%), cognitive performance data were lost due to technical problems or incorrect user interaction; these missing data were replaced using predictive mean matching based on the mean for the group at each time point. Cardiscope Analytics Pro (SMART Medical, Gloucestershire, United Kingdom) was used to derive average heart rate and pNN50 from the ECG recordings. These two parameters were derived separately for the test periods of each cognitive test as well as for the two rest periods between the three test blocks. All data with an ECG quality index less than 95% (determined by Cardiscope Analytics Pro) were defined as missing data (approximately 4%) and substituted by group means. All analyses were performed with a significance level of α = .05 (two-sided) using SPSS Version 27 and JASP 0.16.4 (JASP Team Citation2022).
3. Results
3.1. Exploratory analysis of individual light settings
Descriptive data on individual lighting settings (Personalized Lighting) and control condition measurements are presented in . In general, subjects selected warm-white light colors for workplace lighting (on average 3259 K for backwall lighting and 3418 K for desk lighting; see ). The mean self-selected illuminances for backwall and desk lighting were 1562 lx and 2603 lx, respectively. Thus, backwall lighting was three times higher under Personalized Lighting compared to the control condition (500 lx). When considering desk lighting, the self-selected illuminance was even by a factor of five higher than in the control condition. Notably, this resulted in a higher melanopic EDI for all participants under Personalized Lighting compared to the control condition (see ).
Fig. 4. Melanopic EDIs (equivalent daylight illuminance) for each participant under personalized lighting. The dashed line indicates the melanopic EDI of the control condition (= 86 lx). The triangle in the violin plot signifies the mean EDI under personalized lighting.
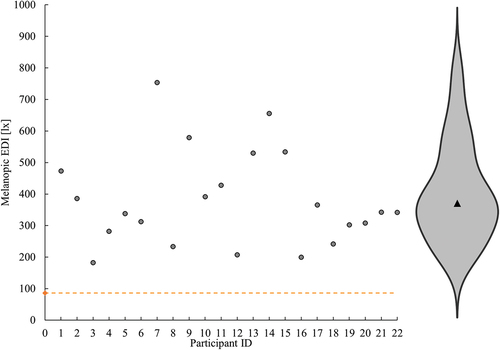
Fig. 5. Scatter plot for self-selected CCTs (correlated color temperature). The dotted line indicates equal CCTs at the desk and the wall.
3.2. Changes in subjective ratings and working memory after 2-hour light exposure
Descriptive statistics in subjective sleepiness, affect (PANAS) and working memory immediately before the light exposure started (Pre) and after the 2-hour light exposure (Post) are presented in .
Table 2. Sleepiness, affect, and working memory. Data are mean ± standard deviation; PANAS = positive and negative affect Schedule; pre = before light exposure; post = after light exposure.
3.2.1. Sleepiness
The Wilcoxon tests with Bonferroni-adjusted α levels (α = 0.025) showed no change in subjective sleepiness under Personalized Lighting (z = −2.15, p = .032, r = 0.459) or the control condition (z = −1.32, p = .186, r = 0.282). No significant differences between the two light interventions could be found at neither measurement time (Pre: z = −1.54, p = .124, r = 0.328; Post: z = −0.10, p = .948, r = 0.021).
3.2.2. Affect
A two-way repeated measure ANOVA for the PANAS positive affect scale neither revealed a significant interaction effect (F(1, 21) = 0.73, p = .402, ηp2 = 0.034) nor main effect of the light intervention (F(1, 21) = 0.01, p = .913, ηp2 = 0.001). However, the main effect of measurement time reached significance (F(1, 21) = 10.61, p = .004, ηp2 = 0.336), with significantly lower positive affect ratings after the 2-hour light exposure (see ).
Fig. 6. Changes in the PANAS (positive and negative affect schedule) positive affect ratings over time. Pre = before light exposure; post = after light exposure.
No significant differences could be observed for the PANAS negative affect dimension in the Pre-Post comparisons, neither in the control condition (z = −0.64, p = .524, r = 0.136) nor under Personalized Lighting (z = −0.45, p = .653, r = 0.096). Moreover, we found no difference between the light interventions at the beginning of the light exposure (z = −0.88, p = .378, r = 0.188) and after the 2-hour light exposure (z = −1.36, p = .175, r = 0.290).
3.2.3. Working memory
No significant changes over time could be found in the total score for the 2-back task, neither in the control condition (z = −1.00 p = .316, r = 0.213) nor under Personalized Lighting (z = −1.03, p = .303, r = 0.220). Participants further had similar working memory capacity under both light interventions at the beginning (z = −0.80, p = .423, r = 0.171) and after 2-hour light exposure (z = −0.94, p = .349, r = 0.200).
3.3. Acute cognitive light effects
Descriptive statistics of vigilance (PVT), task switching (NLT), and sustained attention and information processing (PASAT), measured three times during the 2-hour light exposure, are presented in .
Table 3. Vigilance, task switching, sustained attention, and information processing performance during light exposure. Reaction speed is 1/reaction time. T1 = first measurement; T2 = second measurement; T3 = third measurement; SD = standard deviation; IQR = interquartile range. PVT = psychomotor vigilance Test; NLT = number letter Task; PASAT = paced auditory serial addition task.
3.3.1. Vigilance (PVT)
A two-way ANOVA revealed no significant effect for PVT reaction speed: interaction: F(2, 42) = 2.64, p = .083, ηp2 = 0.112; main factor light intervention: F(21, 1) = 0.09, p = .771, ηp2 = 0.004; main factor measurement time: F(2, 42) = 0.68, p = .511, ηp2 = 0.031.
Friedman tests also did not find a significant effect of measurement time on the number of lapses in the PVT for the control condition (χ2(2) = 0.15, p = .926, W = 0.003) and Personalized Lighting (χ2(2) = 2.10, p = .350, W = 0.048). Moreover, pairwise comparisons between the two light interventions were not significant (Bonferroni-adjusted α = .017) at the three measurement periods: (T1): z = −1.04, p = .299, r = 0.222; (T2): z = −0.76, p = .449, r = 0.162; (T3): z = −0.58, p = .565, r = 0.123.
3.3.2. Task switching (NLT)
No significant interaction effects in reaction speed were discovered in non-switch trials (F(2, 42) = 0.50, p = .610, ηp2 = 0.023) and switch trials (F(2, 42) = 0.01), p = .995, ηp2 < 0.001). The main effect of light intervention was also not significant in non-switch and switch trials (non-switch: F(1, 21) = 0.08, p = .778, ηp2 = 0.004; switch: F(1, 21) = 0.05, p = .827, ηp2 = 0.002). In contrast, we observed a significant main effect of measurement time for both trials (non-switch: F(2, 42) = 11.49, p < .001, ηp2 = 0.354; switch: F(2, 42) = 15, p < .001, ηp2 = 0.417; see ). In non-switch trials, reaction speed increased significantly from T1 to T2 (p = .008; d = 0.200) and from T1 to T3 (p < .001; d = 0.313), but not from T2 to T3 (p = .095; d = 0.113). In switch trials, reaction speed also increased significantly from T1 to T2 (p < .001; d = 0.323) and from T1 to T3 (p < .001; d = 0.299) but stayed at the same level from T2 to T3 (p = .710; d = 0.025).
Fig. 7. Reaction speed in the number letter task (NLT) for non-switch trials (left) and switch trials (right). T1 = first measurement; T2 = second measurement; T3 = third measurement.
Friedman tests were run to investigate time effects within each light intervention for the proportion of correct answers in the NLT, separately for non-switch and switch trials. Moreover, Wilcoxon tests were run to check for differences between the two light interventions at each of the three measurement points. We could not find a significant main effect of measurement time in the proportion of correct answers within each light intervention: non-switch trials (control condition: (χ2(2) = 1.97, p = .373, W = 0.045); Personalized Lighting: (χ2(2) = 4.41, p = .111, W = 0.100)); switch trials (control condition: χ2(2) = 1.26, p = .534, W = 0.029; Personalized Lighting: χ2(2) = 0.30, p = .860, W = 0.007). However, we observed a significant (Bonferroni-adjusted α = .017) measurement-time-specific difference between the light interventions in non-switch trials at T1 (z = −2.85, p = .004, r = 0.608), but not at T2 (z = −1.34, p = .166, r = 0.286) or T3 (z = −0.41, p = .683, r = 0.087), with Personalized Lighting showing a higher proportion of correct answers than the control condition at T1. In contrast, in switch trials, the difference did not reach significance at T1 (z = −1.91, p = .057, r = 0.407), T2 (z = −0.22, p = .824, r = 0.047) and T3 (z = −0.57, p = .569, r = 0.122); see ).
3.3.3. Sustained attention and information processing (PASAT)
The reaction speed for correct answers and the number of correct responses were analyzed separately for the four difficulty levels of the PASAT. No significant interaction effects in reaction speed were found in any difficulty level (Level 1: F(1.477, 42) = 0.452, p = .582, ηp2 = 0.021); Level 2: F(1.441, 42) = 1.056, p = .339, ηp2 = 0.048; Level 3: F(2, 42) = 2.480, p = .096, ηp2 = 0.106; Level 4: F(2, 40) = 0.787, p = .462, ηp2 = 0.038). The main effect of light intervention was also not significant (Level 1: F(1, 21) = 0.367, p = .551, ηp2 = 0.017); Level 2: F(1, 21) = 1.628, p = .216, ηp2 = 0.072; Level 3: F(1, 21) = 2.504, p = .129, ηp2 = 0.107; Level 4: F(1, 20) = 2.033, p = .169, ηp2 = 0.092). The main effect of measurement time was significant in level 2 (F(2, 42) = 4.545, p = .016, ηp2 = 0.178) with significant differences between T1 and T2 (p = .047; d = 0.270) and T1 and T3 (p = .022; d = 0.323). Moreover, the main effect was not significant in level 1 (F(1.492, 31.334) = 3.237, p = .066, ηp2 = 0.134), level 3 (F(1.522, 31.970) = 0.503, p = .559, ηp2 = 0.023), and level 4 (F(2, 40) = 3.239, p = .050, ηp2 = 0.139). Friedman and Wilcoxon tests were further run on the number of correct answers in the PASAT data. We found a significant main effect of measurement time in the control condition on the number of correct answers in level 2 (χ2(2) = 13.24, p = .001, W = 0.301) with higher correct answers in T3 compared to T1 (p = .006; Bonferroni-adjusted α = .017), but not in T2 compared to T1 (p = .094) or T3 compared to T2 (p = .325). No significant differences between the two light interventions could be found in any difficulty level (see Supplementary Materials Table S3).
For better legibility, all significant results are summarized in .
Table 4. Summary of significant results. a = partial Eta squared; b = Wilcoxon’s r; c = Kendall’s W; no significant results were observed in subjective sleepiness and negative affect (PANAS) ratings, working memory (2-back task) and vigilance (PVT). PANAS = positive and negative affect Schedule; NLT = number letter Task; PASAT = paced auditory serial addition task.
3.4. Asthenopic complaints
The overall score of asthenopic complaints, potentially ranging from 10 to 60, was very low under both lighting conditions (control condition: median = 15.50; Personalized Lighting: median = 15.50). A Wilcoxon test revealed no significant differences between the two light interventions (z = −0.51, p = .612, r = 0.109).
3.5. Physiological responses
Descriptive statistics on heart rate (HR) and pNN50 are presented in .
Table 5. Descriptive statistics on heart rate (HR) and pNN50. Pre = measurement before light exposure; post = measurement after light exposure; T1 = first measurement; T2 = second measurement; T3 = third measurement. PVT = psychomotor vigilance Task; NLT = number letter Task; PASAT = paced auditory serial addition task.
No significant interaction effect or main effect of light intervention was found for average heart rate or pNN50 during the cognitive tests and during the breaks (see Supplementary Materials Table S4). However, we observed a significant main effect of measurement time during all cognitive tests as well as during the breaks with decreasing heart rate over time. A significant main effect of measurement time during all measurement periods was also found with increasing pNN50 over time (see ).
Table 6. ANOVA test statistics including post-hoc tests for the main effect of measurement time on heart rate (HR) and pNN50. T1 = first measurement; T2 = second measurement; T3 = third measurement. Only two measurements exist for the 2-back and breaks, no post-hoc tests were calculated for these data. ‘negative‘ indicates a decrease of heart rate, “positive” indicates an increase in pNN50.
4. Discussion
The present study investigated acute effects of self-selected workplace lighting on subjective ratings, cognitive performance, and physiological stress response. The study participants chose bright workplace light settings (mean illuminance at eye level: 924 lx; mean melanopic EDI: 381 lx).
Subjective sleepiness was not rated differently between the two light conditions at either measurement time, although the effect size of the difference in Personalized Lighting was moderate to high but did not reach significance due to the Bonferroni-correction of the α level (which is known to be conservative). Follow-up studies should pay particular attention to this result as several earlier studies reported reduced subjective sleepiness during daytime bright light exposure (Huiberts et al. Citation2015; Leichtfried et al. Citation2015; Lok et al. Citation2018; Rüger et al. Citation2006; Smolders et al. Citation2012), although a recent meta-analysis does not confirm these results (Mu et al. Citation2022). Subgroup analysis in the meta-analysis showed only a significant effect of CCT, not of illuminance on subjective alertness. A possible explanation for missing bright light effects on subjective sleepiness is that the participants were performing cognitive tests (PVT, 2-back task, NLT, and PASAT) for more than half of the light exposure duration. Particularly the PASAT has previously been used to elicit mental fatigue in patients (Tartaglia et al. Citation2008) and is regarded as stressful (Holdwick and Wingenfeld Citation1999). Consequently, an increased workload may offset possible light effects. Borragán et al. (Citation2017) found similar results in their study, suggesting that bright light exposure cannot counteract the negative effects of a high cognitive load on sleepiness. Although there is also evidence that light effects are stronger in sleep-deprived or mentally fatigued participants (Phipps-Nelson et al. Citation2003; Smolders and de Kort Citation2014), in these studies the participants were already in this state (i.e., sleep-deprived or mentally fatigued) before the light exposure started. Smolders and de Kort (Citation2014) found a significant effect of bright light exposure on sleepiness only in mentally fatigued participants, but not when they were rested. In contrast, participants in the present study may have started the light exposure in a rested state, but then became increasingly fatigued over the course of the light exposure, which may have prevented any beneficial light effect on subjective sleepiness. It should be noted, however, that the participants also did not show increased sleepiness after the light exposure. This may be due to the fact that this study used a reduced scale rather than the original KSS scale.
Positive affect ratings decreased under both light conditions. While we did not expect this result, it is in line with other studies not investigating on the impact of light (e.g., Holdwick and Wingenfeld Citation1999) showing impaired mood after performing cognitive tests repeatedly. Moreover, we could not observe changes in negative affect ratings over time. It should be noted here that affect ratings were recorded only immediately before and after the two-hour light intervention, but not during the intervention. In a study by Leichtfried et al. (Citation2015), subjective mood improved after 30 minutes of bright light exposure. Thus, short-term changes in mood are possible but were not investigated in the present study.
In the present study, no evidence was found for positive effects of personalizable lighting on objective measures of alertness (PVT). This result is in line with results from other studies utilizing bright light exposure (Huiberts et al. Citation2016; Maierova et al. Citation2016; Stefani et al. Citation2020). In contrast, a recently published meta-analysis (Mu et al. Citation2022) showed improved PVT performance by light. Subgroup analyses, however, showed no significant effect of illuminance but only an effect of CCT on PVT performance. Thus, more research is necessary to clarify the impact of daytime bright light exposure on alertness.
Personalizable workplace lighting also did not affect working memory as measured by the 2-back task. In a previous study by Stefani et al. (Citation2020), which compared static lighting with lighting with varying CCTs and illuminances across the day, also no light effects on working memory were found. In the study by Stefani and colleagues, however, differences in terms of melanopic illuminances were small between the light conditions. Moreover, Huiberts et al. (Citation2015) found significantly impaired 2-back working memory performance under bright light exposure in the afternoon. In addition, bright light reduced performance on a similarly difficult backward digit span task (another working memory test), while a positive impact of afternoon bright light exposure was observed in the easier forward digit span task. These results suggest that task difficulty may moderate the effect of bright light on working memory performance. Interestingly, the same authors found the opposite results in a later study: bright light exposure significantly improved performance in difficult backward digit span trials, but did not affect performance in the easier trials (Huiberts et al. Citation2016). The authors attribute these apparently contradictory results to differences in the study design of the two studies. In addition to this, Maierova et al. (Citation2016) found that evening chronotypes performed better in a 2-back task under bright light than under dim light exposure, but in the more difficult 3-back task, evening chronotypes and morning chronotypes performed better under bright light exposure and self-selected lighting than under dim light exposure. It should be noted here, however, that the differences between the lighting conditions in this study were quite extreme (bright light exposure: 1000 lx at eye level; dim light exposure: below 5 lx at eye level). The difference in the light conditions was much smaller in our study, which may have played a crucial role in reporting no differences between the two light interventions.
For task switching (NLT) and sustained attention and information processing (PASAT), we observed a tendency for better performance under personalizable lighting. In the NLT, there was evidence of a short-term effect on the proportion of correct responses in non-switching trials in the Personalized Lighting condition, with a higher proportion of correct responses. This effect was present only in T1 (i.e., immediately after the start of the light intervention) and disappeared afterward (in T2 and T3). Previous studies also reported mixed results regarding the effects of bright light exposure on executive control measures (Lok et al. Citation2018), with some studies reporting positive effects (Huiberts et al. Citation2015, Citation2016) and some reporting negative effects (Leichtfried et al. Citation2015; Smolders and de Kort Citation2014); however, none of these studies utilized the NLT.
The PASAT shows a similar picture, with no significant differences between the light interventions, but a tendency toward a higher proportion of correct answers and an increasing reaction speed, especially under the personalizable light settings. These effects were most pronounced at a medium task difficulty level (i.e., level 2). Floor and ceiling effects may account for the missing light effects for the other difficulty levels: level 1 was very easy (i.e., 53 to 56 out of 60 trials were correct), so there was little room for improvement through an increased light exposure. On the other hand, level 4 was very challenging (some participants did not get a single answer right), so light effects may not be strong enough to improve cognitive performance. Levels 2 and 3 are in the “sweet spot,” where improvement is still possible and not too hard. An increase under both interventions over time was expected since practice effects are well documented for the PASAT (Tombaugh Citation2006).
Personalizable workplace lighting did not alter parasympathetic activity in our study. Nevertheless, there was a time effect in both experimental conditions with increasing parasympathetic activity throughout the light exposure. This result indicates that repeated presentation of cognitive tests let to habituation (i.e., better performance across test repetitions) which was also evident at the physiological level (i.e., decreased physiological stress), which is in line with existing literature finding increasing parasympathetic activation with increasing duration of cognitive training (Lin et al. Citation2017).
Exploratory analysis of individual light settings showed a high variation in chosen workplace illuminances and somewhat limited variation in chosen workplace correlated color temperatures. Based on previous literature regarding the stimulus range bias, this result was expected (Fotios and Cheal Citation2010; Logadóttir et al. Citation2011, Citation2013), although it must be noted that the available CCT range was substantially smaller than the illuminance range (CCT range: 2200 K up to 5300 K; illuminance range: 60 lx to 6000 lx). One possible reason for the self-selected warm-white light colors may be the lack of daylight as a reference. Thus, it can be assumed that without daylight study participants solely oriented themselves toward the middle of the scale when selecting their CCT. It is noteworthy, that the subjects selected the light intensity well above current lighting standards. Despite the high illuminance, no asthenopic complaints were reported, as the luminaire homogenously lit the desk and back wall, and no direct view into the light sources of the luminaire was possible. Moreover, we expected high visual comfort ratings (i.e., the absence of asthenopic complaints) due to the fact that workplace lighting was self-selected and should guarantee visual comfort at the workstation. A previous study also found higher visual comfort in self-selected lighting compared to pre-set lighting conditions (Maierova et al. Citation2016). It should be noted here, that asthenopic complaints were only assessed after the end of the light exposure, thus limiting the generalizability of this study result.
Several limitations of this study need to be addressed. First, several confounding environmental and personal factors may influence the results (e.g., time spent outdoors, sleep-wake timing, and photic history may vary highly between participants and throughout study participation). In particular, sleep in the nights prior to study participation should be monitored via questionnaires or actimetry, as most of the measured parameters are influenced by good, bad, or insufficient sleep. Moreover, the ambient temperature in the laboratory was not monitored, however, studies have shown that room temperature may have an impact on the preferred indoor light color (e.g., Te Kulve et al. Citation2018). Second, some methodological factors need to be acknowledged. The PVT used in this study slightly differs from more commonly used versions of the PVT in other studies. Additionally, three out of four cognitive performance tasks (NLT, PVT, and PASAT) were only administered during light exposure. Baseline values measured before light exposure would have been helpful in clearly identifying possible light effects. The same applies to the ECG measurement. In contrast, subjective sleepiness was assessed only immediately before and after the light exposure. It may have been more accurate to also measure sleepiness during the light exposure. However, due to the already high workload, we did not repeat the ratings on sleepiness and affect during light exposure. Third, the timing of light exposure varied between participants, with four possible time slots throughout the day. Fourth, the sample size may be too small to detect small effects of the light intervention. Fifth, the sample only included students in a specific age range and is therefore not representative for the general working population. Sixth, large variances in light settings in Personalized Lighting may wash out any possible nonvisual effects. Hence, adding a single bright light control condition may also be beneficial for future studies. Similarly, due to a technical error, the control condition had a different CCT (5300 K) than the starting point for setting CCT in the personalizable lighting condition (3800 K). As a result, participants could only self-select a similar or lower CCT in the personalized lighting condition compared to the control condition; however, as the two lighting conditions were studied on separate days in a randomized, counterbalanced order, we do not expect this error to have a substantial impact on the selected values. Nevertheless, as half of the subjects underwent the control condition on the first day and therefore had a different reference value (5300 K instead of the planned 4000 K) on the second day, it is possible that this changed the participants’ preferences regarding their personalized lighting condition. It should also be noted that this study used a limited definition of personalized lighting, as the lighting was only adjusted individually once and then kept constant for two hours. In real-world applications, personalized lighting should mean that adjustments can be made at any time to accommodate changes in visual tasks, mood or personal preferences. Seventh, it would have been informative to record subjective lighting appraisals of the self-selected lighting settings to check how pronounced the perceived difference between the control condition and the personalized lighting condition is during actual use. The stability of individual preferences (re-test reliability) would also be an interesting subject of investigation. Also, possible reasons for the selected settings could be identified with subjective assessments. Eighth, practice effects were found in the NLT and PASAT performance data. We also did not measure the mental demands of the tests (e.g., with the NASA TLX). Ninth, we primarily used visual tasks to assess cognitive performance. While studies on nonvisual light effects typically utilized auditory tasks, we decided to use visual tasks for reasons of higher external validity and to guarantee that the participants keep their eyes open and focus the screen while performing the task. Tenth, the monitor itself acts as an additional light source, confounding potential ambient light effects. However, in our study, this was controlled by cognitive tests shown on a black screen background. Lastly, in terms of applicability, the use of large desk-mounted luminaires (as used in this study) may not be suitable for every office environment. Although the initial cost of such a personalized lighting system is considerably higher than the cost of a standard system, this additional cost may be offset by the greater adaptability and energy efficiency. Furthermore, these initial extra costs can also be offset by increased user satisfaction and possibly increased productivity. However, the exact amount of the energy savings will depend on the actual user behavior and the settings chosen. Nevertheless, there are simpler and less expensive options as a compromise solution such as using portable desk lamps to still allow users a degree of control over the lighting condition at their own office workstation, albeit with a lower range of possible illuminance levels.
5. Conclusion
In summary, our study clearly demonstrates a wide range of preferred self-selected illuminances for workstation lighting in offices. Most importantly, no detrimental effects were observed due to the higher illuminance levels of the individual light settings. The present study also provides preliminary evidence of short-term beneficial effects of personalized lighting on task switching, which warrants further research in this direction. However, the overall pattern of results remains inconclusive, as no significant effects of personalized lighting on working memory, vigilance, or sustained attention were observed.
Many people spend most of their time indoors. Personalizable lighting could therefore become a new preventive factor in daylight-deprived lifestyles.
Supplemental Material
Download MS Word (229.5 KB)Acknowledgments
We would like to thank Helmuth Ebner and Martin Renner for their help in data collection.
Disclosure statement
The workplace luminaire used is a research prototype developed by the research and development department of Bartenbach GmbH (Aldrans, Austria). The prototype is not available on the market.
Supplementary material
Supplemental data for this article can be accessed online at https://doi.org/10.1080/15502724.2023.2292960.
Additional information
Funding
References
- Akerstedt T, Anund A, Axelsson J, Kecklund G. 2014. Subjective sleepiness is a sensitive indicator of insufficient sleep and impaired waking function. J Sleep Res. 23(3):240–252. doi:10.1111/jsr.12158. Cited in PubMed; PMID: 24750198.
- Akerstedt T, Gillberg M. 1990. Subjective and objective sleepiness in the active individual. Int J Neurosci. 52(1–2):29–37. doi:10.3109/00207459008994241. Cited in PubMed; PMID: 2265922.
- Borragán G, Deliens G, Peigneux P, Leproult R. 2017. Bright light exposure does not prevent the deterioration of alertness induced by sustained high cognitive load demands. J Environ Psychol. 51:95–103.
- Boyce PR, Eklund NH, Simpson SN. 2000. Individual lighting control: task performance, mood, and Illuminance. J Illum Eng Soc. 29(1):131–142.
- Boyce PR, Veitch JA, Newsham GR, Jones CC, Heerwagen J, Myer M, Hunter CM. 2006a. Lighting quality and office work: two field simulation experiments. Lighting Res Technol. 38(3):191–223. doi:10.1191/1365782806lrt161oa.
- Boyce PR, Veitch JA, Newsham GR, Jones CC, Heerwagen J, Myer M, Hunter CM. 2006b. Occupant use of switching and dimming controls in offices. Lighting Res Technol. 38(4):358–376. doi:10.1177/1477153506070994.
- Breyer B, Bluemke M 2016. Deutsche Version der Positive and Negative Affect Schedule PANAS (GESIS Panel) [German Version of the Positive and Negative Affect Schedule PANAS (GESIS Panel)].
- Brown TM, Brainard GC, Cajochen C, Czeisler CA, Hanifin JP, Lockley SW, Lucas RJ, Münch M, O’Hagan JB, Peirson SN, et al. 2022. Recommendations for daytime, evening, and nighttime indoor light exposure to best support physiology, sleep, and wakefulness in healthy adults. PLoS Biol. 20(3):e3001571. Epub 2022 Mar 17. doi:10.1371/journal.pbio.3001571. Cited in PubMed; PMID: 35298459.
- Cajochen C. 2007. Alerting effects of light. Sleep Med Rev. 11(6):453–464. Epub 2007 Nov 1. doi:10.1016/j.smrv.2007.07.009. Cited in PubMed; PMID: 17936041.
- Canazei M, Dehoff P, Staggl S, Pohl W. 2014. Effects of dynamic ambient lighting on female permanent morning shift workers. Lighting Res Technol. 46(2):140–156. doi:10.1177/1477153513475914.
- Canazei M, Pohl W, Bauernhofer K, Papousek I, Lackner HK, Bliem HR, Marksteiner J, Weiss EM. 2017. Psychophysiological effects of a single, Short, and moderately bright room light exposure on mildly depressed geriatric inpatients: a pilot study. Gerontology. 63(4):308–317. Epub 2017 Jan 20. doi:10.1159/000455231. Cited in PubMed; PMID: 28103597.
- Chellappa SL, Steiner R, Blattner P, Oelhafen P, Götz T, Cajochen C. 2011. Non-visual effects of light on melatonin, alertness and cognitive performance: can blue-enriched light keep us alert? PLoS ONE. 6(1):e16429. Epub 2011 Jan 26. doi:10.1371/journal.pone.0016429. Cited in PubMed; PMID: 21298068.
- Choi C-J, Kim K-S, Kim C-M, Kim S-H, Choi W-S. 2011. Reactivity of heart rate variability after exposure to colored lights in healthy adults with symptoms of anxiety and depression. Int J Psychophysiol. 79(2):83–88. Epub 2010 Oct 1. doi:10.1016/j.ijpsycho.2010.09.011. Cited in PubMed; PMID: 20888377.
- Chraibi S, Crommentuijn L, van Loenen E, Rosemann A. 2017. Influence of wall luminance and uniformity on preferred task illuminance. Build Environ. 117:24–35.
- Chraibi S, Lashina T, Shrubsole P, Aries M, van Loenen E, Rosemann A. 2016. Satisfying light conditions: a field study on perception of consensus light in Dutch open office environments. Build Environ. 105:116–127.
- Crawford JR, Henry JD. 2004. The positive and negative affect schedule (PANAS): construct validity, measurement properties and normative data in a large non-clinical sample. Br J Clin Psychol. 43(Pt 3):245–265. doi:10.1348/0144665031752934. Cited in PubMed; PMID: 15333231.
- Despenic M, Chraibi S, Lashina T, Rosemann A. 2017. Lighting preference profiles of users in an open office environment. Build Environ. 116:89–107.
- Dikel EE, Veitch JA, Mancini S, Xue HH, Valdés JJ. 2018. Lighting-on-demand: balancing occupant needs and energy savings. LEUKOS. 14(1):3–11. doi:10.1080/15502724.2017.1373597.
- Escuyer S, Fontoynont M. 2001. Lighting controls: a field study of office workers’ reactions. Lighting Res Technol. 33(2):77–94. doi:10.1177/136578280103300202.
- European Committee for Standardization. 2021. Light and lighting – lighting of work places - part 1: indoor work places: EN 12464-1:2021.
- Forquer LM, Camden AE, Gabriau KM, Johnson CM. 2008. Sleep patterns of college students at a public university. J Am Coll Health. 56(5):563–565. doi:10.3200/JACH.56.5.563-565. Cited in PubMed; PMID: 18400669.
- Fotios SA. 2017. A revised Kruithof graph based on empirical data. LEUKOS. 13(1):3–17. doi:10.1080/15502724.2016.1159137.
- Fotios SA, Cheal C. 2010. Stimulus range bias explains the outcome of preferred-illuminance adjustments. Lighting Res Technol. 42(4):433–447. doi:10.1177/1477153509356018.
- Ghotbi N, Pilz LK, Winnebeck EC, Vetter C, Zerbini G, Lenssen D, Frighetto G, Salamanca M, Costa R, Montagnese S, et al. 2020. The µMCTQ: an ultra-short version of the Munich chronotype questionnaire. J Biol Rhythms. 35(1):98–110. doi:10.1177/0748730419886986. Cited in PubMed; PMID: 31791166.
- Gronwall DM. 1977. Paced auditory serial-addition task: a measure of recovery from concussion. Percept Mot Skills. 44(2):367–373. doi:10.2466/pms.1977.44.2.367. Cited in PubMed; PMID: 866038.
- Holdwick DJ, Wingenfeld SA. 1999. The subjective experience of PASAT testing. Does the PASAT induce negative mood? Arch Clin Neuropsych. 14(3):273–284. doi:10.1093/arclin/14.3.273. Cited in PubMed; PMID: 14590596.
- Huiberts LM, Smolders KCHJ, de Kort YAW. 2015. Shining light on memory: effects of bright light on working memory performance. Behav Brain Res. 294:234–245. Epub 2015 Jul 26. doi:10.1016/j.bbr.2015.07.045. Cited in PubMed; PMID: 26215575.
- Huiberts LM, Smolders KCHJ, de Kort YAW. 2016. Non-image forming effects of illuminance level: exploring parallel effects on physiological arousal and task performance. Physiol Behav. 164(Pt A):129–139. Epub 2016 May 21. doi:10.1016/j.physbeh.2016.05.035. Cited in PubMed; PMID: 27221368.
- International WELL Building Institute. 2023. WELL building standard v2: L03 circadian lighting design. [accessed 2023 Jun 16]. https://v2.wellcertified.com/en/wellv2/light/feature/3.
- Jaeggi SM, Studer-Luethi B, Buschkuehl M, Su Y-F, Jonides J, Perrig WJ. 2010. The relationship between n-back performance and matrix reasoning — implications for training and transfer. Intelligence. 38(6):625–635. doi:10.1016/j.intell.2010.09.001.
- JASP Team. 2022. JASP. 0.16.4. https://jasp-stats.org/.
- Kent MG, Fotios SA. 2021. The effect of a pre-trial range demonstration on subjective evaluations using category rating of discomfort due to glare. LEUKOS. 17(1):43–58.
- Kent MG, Fotios SA, Cheung T. 2019. Stimulus range bias leads to different settings when using luminance adjustment to evaluate discomfort due to glare. Build Environ. 153:281–287. doi:10.1016/j.buildenv.2018.12.061.
- Kent MG, Huynh NK, Schiavon S, Selkowitz S. 2022. Using support vector machine to detect desk illuminance sensor blockage for closed-loop daylight harvesting. Energy Build. 274:112443. doi:10.1016/j.enbuild.2022.112443.
- Knez I. 1995. Effects of indoor lighting on mood and cognition. J Environ Psychol. 15(1):39–51.
- Kohl S, Schmitt M, Bauer U, Canazei M, Pohl W, Pachinger O, Stühlinger M. 2020. Effects of red and blue light on the cardiac autonomic nervous system. J Integr Cardiol Open Access. 1–7. doi:10.31487/j.JICOA.2020.04.06
- Kühner C, Bürger C, Keller F, Hautzinger M. 2007. Reliabilität und Validität des revidierten Beck-Depressionsinventars (BDI-II). Befunde aus deutschsprachigen Stichproben [Reliability and validity of the revised beck depression inventory (BDI-II). Results from German samples]. Nervenarzt. 78(6):651–656. doi:10.1007/s00115-006-2098-7. Cited in PubMed; PMID: 16832698.
- Leichtfried V, Mair-Raggautz M, Schaeffer V, Hammerer-Lercher A, Mair G, Bartenbach C, Canazei M, Schobersberger W. 2015. Intense illumination in the morning hours improved mood and alertness but not mental performance. Appl Ergon. 46 Pt A:54–59. Epub 2014 Aug 5. doi:10.1016/j.apergo.2014.07.001. Cited in PubMed; PMID: 25106786.
- Lin F, Heffner KL, Ren P, Tadin D. 2017. A role of the parasympathetic nervous system in cognitive training. Curr Alzheimer Res. 14(7):784–789. doi:10.2174/1567205014666170203095128. Cited in PubMed; PMID: 28164771.
- Litscher D, Wang L, Gaischek I, Litscher G. 2013. The influence of new colored light stimulation methods on heart rate variability, temperature, and well-being: results of a pilot study in humans. Evidence-Based Complementary Altern Med. 2013:674183. Epub 2013 Nov 28. doi:10.1155/2013/674183. Cited in PubMed; PMID: 24369481.
- Logadóttir Á, Christoffersen J, Fotios SA. 2011. Investigating the use of an adjustment task to set the preferred illuminance in a workplace environment. Lighting Res Technol. 43(4):403–422. doi:10.1177/1477153511400971.
- Logadóttir Á, Fotios SA, Christoffersen J, Hansen SS, Corell DD, Dam-Hansen C. 2013. Investigating the use of an adjustment task to set preferred colour of ambient illumination. Color Res Appl. 38(1):46–57.
- Lok R, Smolders KCHJ, Beersma DGM, de Kort YAW. 2018. Light, alertness, and alerting effects of white light: a literature overview. J Biol Rhythms. 33(6):589–601. Epub 2018 Sep 7. doi:10.1177/0748730418796443. Cited in PubMed; PMID: 30191746.
- Löwe B, Spitzer RL, Zipfel S, Herzog W. 2002. Gesundheitsfragebogen für Patienten (PHQ-D): Komplettversion und Kurzform. 2. Auflage ed. Karlsruhe: Pfizer.
- Maierova L, Borisuit A, Scartezzini J-L, Jaeggi SM, Schmidt C, Münch M. 2016. Diurnal variations of hormonal secretion, alertness and cognition in extreme chronotypes under different lighting conditions. Sci Rep. 6:33591. Epub 2016 Sep 20. doi:10.1038/srep33591. Cited in PubMed; PMID: 27646174.
- Malavazos C, Papanikolaou A, Tsatsakis K, Hatzoplaki E. 2015. Combined visual comfort and energy efficiency through true personalization of automated lighting control. IEEE International Conference on Smart Cities and Green ICT Systems (SMARTGREENS), Lisbon, Portugal.
- Miyake A, Friedman NP, Emerson MJ, Witzki AH, Howerter A, Wager TD. 2000. The unity and diversity of executive functions and their contributions to complex “Frontal lobe” tasks: a latent variable analysis. Cogn Psychol. 41(1):49–100. doi:10.1006/cogp.1999.0734. Cited in PubMed; PMID: 10945922.
- Mu Y-M, Huang X-D, Zhu S, Hu Z-F, So K-F, Ren C-R, Tao Q. 2022. Alerting effects of light in healthy individuals: a systematic review and meta-analysis. Neural Regen Res. 17(9):1929–1936. doi:10.4103/1673-5374.335141. Cited in PubMed; PMID: 35142669.
- Münch M, Linhart F, Borisuit A, Jaeggi SM, Scartezzini J-L. 2012. Effects of prior light exposure on early evening performance, subjective sleepiness, and hormonal secretion. Behav Neurosci. 126(1):196–203. doi:10.1037/a0026702. Cited in PubMed; PMID: 22201280.
- Münch M, Nowozin C, Regente J, Bes F, de Zeeuw J, Hädel S, Wahnschaffe A, Kunz D. 2016. Blue-enriched morning light as a countermeasure to light at the wrong time: effects on cognition, sleepiness, sleep, and circadian phase. Neuropsychobiology. 74(4):207–218. Epub 2017 Jun 22. doi:10.1159/000477093. Cited in PubMed; PMID: 28637029.
- Newsham GR, Aries M, Mancini S, Faye G. 2008. Individual control of electric lighting in a daylit space. Lighting Res Technol. 40(1):25–41. doi:10.1177/1477153507081560.
- O’Brien W, Gunay HB. 2014. The contextual factors contributing to occupants’ adaptive comfort behaviors in offices – a review and proposed modeling framework. Build Environ. 77:77–87. doi:10.1016/j.buildenv.2014.03.024.
- Pachito DV, Eckeli AL, Desouky AS, Corbett MA, Partonen T, Rajaratnam SMW, Riera R. 2018. Workplace lighting for improving alertness and mood in daytime workers. Cochrane Database Syst Rev. 3(3):CD012243. Epub 2018 Mar 2. doi:10.1002/14651858.CD012243.pub2. Cited in PubMed; PMID: 29498416.
- Phipps-Nelson J, Redman JR, Dijk D-J, Rajaratnam SMW. 2003. Daytime exposure to bright light, as compared to dim light, decreases sleepiness and improves psychomotor vigilance performance. Sleep. 26(6):695–700. doi:10.1093/sleep/26.6.695. Cited in PubMed; PMID: 14572122.
- Phipps-Nelson J, Redman JR, Schlangen LJM, Rajaratnam SMW. 2009. Blue light exposure reduces objective measures of sleepiness during prolonged nighttime performance testing. Chronobiol Int. 26(5):891–912. doi:10.1080/07420520903044364. Cited in PubMed; PMID: 19637049.
- Plitnick B, Figueiro MG, Wood B, Rea MS. 2010. The effects of red and blue light on alertness and mood at night. Lighting Res Technol. 42(4):449–458. doi:10.1177/1477153509360887.
- Rüger M, Gordijn MCM, Beersma DGM, de Vries B, Daan S. 2006. Time-of-day-dependent effects of bright light exposure on human psychophysiology: comparison of daytime and nighttime exposure. Am J Physiol-Reg I. 290(5):R1413–20. Epub 2005 Dec 22. doi:10.1152/ajpregu.00121.2005. Cited in PubMed; PMID: 16373441.
- Smolders KCHJ, de Kort YAW. 2014. Bright light and mental fatigue: effects on alertness, vitality, performance and physiological arousal. J Environ Psychol. 39:77–91.
- Smolders KCHJ, de Kort YAW, Cluitmans PJM. 2012. A higher illuminance induces alertness even during office hours: findings on subjective measures, task performance and heart rate measures. Physiol Behav. 107(1):7–16. Epub 2012 May 4. doi:10.1016/j.physbeh.2012.04.028. Cited in PubMed; PMID: 22564492.
- Souman JL, Tinga AM, Te Pas SF, van Ee R, Vlaskamp BNS. 2018. Acute alerting effects of light: a systematic literature review. Behav Brain Res. 337:228–239. Epub 2017 Sep 12. doi:10.1016/j.bbr.2017.09.016. Cited in PubMed; PMID: 28912014.
- Spitschan M, Mead J, Roos C, Lowis C, Griffiths B, Mucur P, Herf M, Nam S, Veitch JA. 2021. Luox: validated reference open-access and open-source web platform for calculating and sharing physiologically relevant quantities for light and lighting. Wellcome Open Res. 6:69. Epub 2022 Jun 27. doi:10.12688/wellcomeopenres.16595.3. Cited in PubMed; PMID: 34017925.
- Stefani O, Cajochen C. 2021. Should we re-think regulations and standards for lighting at workplaces? A practice review on existing lighting recommendations. Front Psychiatry. 12:652161. Epub 2021 May 13. doi:10.3389/fpsyt.2021.652161. Cited in PubMed; PMID: 34054611.
- Stefani O, Freyburger M, Veitz S, Basishvili T, Meyer M, Weibel J, Kobayashi K, Shirakawa Y, Cajochen C. 2020. Changing color and intensity of LED lighting across the day impacts on circadian melatonin rhythms and sleep in healthy men. J Pineal Res. e12714. Epub 2020 Dec 30. doi:10.1111/jpi.12714. Cited in PubMed; PMID: 33378563.
- Strauss E, Sherman EMS, Spreen O. 2006. A compendium of neuropsychological tests: administration, norms, and commentary. 3rd ed. Oxford U.A: Oxford University Press; p. XVII, 1216 S.
- Tartaglia MC, Narayanan S, Arnold DL. 2008. Mental fatigue alters the pattern and increases the volume of cerebral activation required for a motor task in multiple sclerosis patients with fatigue. Eur J Neurol. 15(4):413–419. doi:10.1111/j.1468-1331.2008.02090.x. Cited in PubMed; PMID: 18353127.
- Te Kulve M, Schlangen LJM, Schellen L, Frijns AJH, van Marken Lichtenbelt WD. 2017. The impact of morning light intensity and environmental temperature on body temperatures and alertness. Physiol Behav. 175:72–81. Epub 2017 Mar 30. doi:10.1016/j.physbeh.2017.03.043. Cited in PubMed; PMID: 28366816.
- Te Kulve M, Schlangen LJM, van Marken Lichtenbelt W. 2018. Interactions between the perception of light and temperature. Indoor Air. 28(6):881–891. Epub 2018 Sep 10. doi:10.1111/ina.12500. Cited in PubMed; PMID: 30113746.
- Terman M, Williams JBW. 1993. Personal inventory for depression and seasonal affective disorder (PIDS). New York: New York State Psychiatric Institute and the Department of Psychiatry, Columbia University.
- Thomann J, Baumann CR, Landolt H-P, Werth E. 2014. Psychomotor vigilance task demonstrates impaired vigilance in disorders with excessive daytime sleepiness. J Clin Sleep Med. 10(9):1019–1024. Epub 2014 Sep 15. doi:10.5664/jcsm.4042. Cited in PubMed; PMID: 25142762.
- Tombaugh TN. 2006. A comprehensive review of the paced auditory serial addition test (PASAT). Arch Clin Neuropsych. 21(1):53–76. Epub 2005 Nov 14. doi:10.1016/j.acn.2005.07.006. Cited in PubMed; PMID: 16290063.
- Tsunoda M, Endo T, Hashimoto S, Honma S, Honma K-I. 2001. Effects of light and sleep stages on heart rate variability in humans. Psychiat Clin Neuros. 55(3):285–286. doi:10.1046/j.1440-1819.2001.00862.x. Cited in PubMed; PMID: 11422878.
- Uttley J, Fotios SA, Cheal C. 2013. Satisfaction and illuminances set with user-controlled lighting. Archit Sci Rev. 56(4):306–314.
- Veitch JA, Newsham GR, Boyce PR, Jones CC. 2008. Lighting appraisal, well-being and performance in open-plan offices: a linked mechanisms approach. Lighting Res Technol. 40(2):133–151. doi:10.1177/1477153507086279.
- Veitch JA, Stokkermans MGM, Newsham GR. 2011. Linking Lighting Appraisals to Work Behaviors. Environ Behav. 45(2):198–214. doi:10.1177/0013916511420560.
- Viola AU, James LM, Schlangen LJM, Dijk D-J. 2008. Blue-enriched white light in the workplace improves self-reported alertness, performance and sleep quality. Scand J Work Environ Health. 34(4):297–306. Epub 2008 Sep 22. doi:10.5271/sjweh.1268. Cited in PubMed; PMID: 18815716.