
ABSTRACT
Whey protein (WP) supplements have grown in popularity for exercising populations to enhance muscle protein synthesis and promote recovery. The purpose of this investigation was to examine the macronutrient profile, especially protein, of commonly sold protein powder brands in the Colombian (South America) sports supplement market. Eleven popular whey proteins supplements made and sold on the Colombian market were sampled and determined the humidity, ash, total carbohydrates, fat, proteins, and calories (kcal). The mean calorie content declared by product labeling was significantly lower (p < 0.05) than measured (labeled 349.8 ± 20.3 kcal; analyzed 368.2 ± 14.9 kcal). Carbohydrate content was higher than labeled on average (labeled 3.5 ± 6 g/100 g; analyzed 21.9 ± 12.5 g/100 g) (p < 0.05). The protein content on the labels showed a significantly higher content, on average, than analyzed in all samples (labeled 81.4 ± 7.4; analyzed 65.7 ± 14.1) (p < 0.05). These data suggest, that for brands analyzed in this research, nutrient labels may be misleading, especially regarding protein, carbohydrate, and total calorie content. Consumers should diligently read, but also learn the different product labeling; however, brands should emphasize on testing their products and add amino acid profiles to guarantee quality of their products.
1. Introduction
The sports supplement market was valued at 10.7 billion USD in 2020 and trending upward [Citation1]. Of the many supplements sold, whey protein supplements (WP) have become increasingly popular over the last decade and are top sellers in the powder protein market [Citation2]. WP’s popularity is mainly due to the many science-backed benefits elicited from its ingestion, including increased satiety [Citation3], as well as increased rates of muscle protein synthesis, which often produce positive body composition changes, especially when paired with resistance training [Citation4,Citation5]. Additionally, bio-functional properties from peptides found in WP not only benefit the sport and exercise communities but have recently been described to be useful for the treatment of different non-communicable diseases, such as type 2 diabetes [Citation6], obesity [Citation7] among others by their bioactive components [Citation8].
Whey protein supplements represents a small part of the total protein present in dairy products (20%) [Citation9] and possess a high nutritional profile that comes from its composition in essential and branched-chain amino acids [Citation10]. This composition makes it suitable for different food applications such as infant formulas, sports drinks, and powders [Citation11,Citation12]. In sport and exercise, athletes and non-athletes are high consumers of protein supplements, and this pattern is observed worldwide [Citation13–16]. While the consumption of WP supplements seems to be safe and are well known to help elicit positive exercise adaptations, there are differences in how countries regulate supplements sold, with evidence of serious irregularities highlighted by Neves and Caldas in 2015 [Citation17]. Some of these irregularities highlighted by Neves and Caldas included lower protein quantity, alterations in the amino acid score, and a higher carbohydrate dose than indicated on the nutritional facts provided on supplement labels [Citation18]. This has significant implications, as protein content quality and the amount is a significant aspect of the buying process for consumers to help differentiate between protein powder brands [Citation19]. Part of the issue with supplement regulation is the vast difference in the legal framework (e.g. name/classification of supplements, testing regulations, quality control) of supplements between countries, with products shipped across borders and to other states for sale. For example, regulations are different between South America, the United States, and the E.U. [Citation17,Citation20].
The 2018 Analysis & Forecasts of Colombia Whey Protein for up to 2022 indicated that more dairy that is produced in-country would remain in-country to meet an increasing trend in use and demand for whey protein products (i.e. powders, bars, ready to drink beverages) [Citation21]. This growth and market dynamics of WP products and the differences found between different countries, our purpose was to determine and verify the protein content of commonly made and sold protein powder brands in the Colombian (South America) sports supplement market. This work is novel and important as it sheds scientific light on the quality of commonly consumed dietary supplement products.
2. Materials and methods
2.1. Sample collection
Eleven of the made and most-sold whey proteins available on the Colombian market were obtained from a local sports nutrition store for further analysis. Ingredients and macronutrient content is listed in Supplementary Tables 1 and 2, respectively. For each sample, the batch number, date of manufacturing, and expiration were obtained, followed by the storage at room temperature until analysis by a private laboratory, which was not affiliated with any of the supplements analyzed for this research.
2.2. Proximate analysis
All protein samples were submitted to proximate analysis by an external laboratory (Tecnimicro Lab) to determine total carbohydrates, fat, proteins, and calories (kcal) as previously described [Citation22]. Total calories were analyzed from fat, protein, and carbohydrates, fat calories from fat, carbohydrates from the calculation by the difference of components other than carbohydrates. Ash, fat, and moisture were determined by gravimetric method, while protein was determined by the Kjeldahl method as described previously [Citation23]. All tests were carried out according to the certification quality standards given by the Instituto Colombiano Agropecuario (ICA).
2.3. Statistical analysis
Data are presented as mean ± SD. The statistical significance among measured and labeled content was determined by paired Student’s t-test. Statistical significance was set at p < 0.05. All analysis was performed in GraphPad Prism software (Version 8, San Diego, California, USA).
3. Results
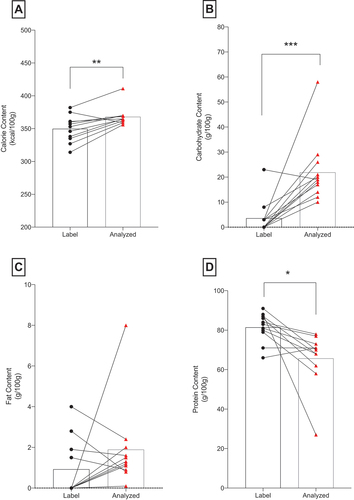
The macronutrient and calorie content labeled and analyzed per 100/g of product is shown in . The mean calorie content declared by product labeling was significantly lower than measured (labeled 349.8 ± 20.3 kcal; analyzed 368.2 ± 14.9 kcal, p = 0.00) ()). Carbohydrate content was higher than labeled (labeled 3.5 ± 6 g/100 g; analyzed 21.9 ± 12.5 g/100 g) (p = 0.00) ()), while fat content shown no differences (labeled 0.9 ± 1.4 g/100 g; analyzed 1.8 ± 2.1 g/100 g) (p = 0.25) ()). Regarding protein content, the labeling showed a significantly higher content than analyzed in all samples (labeled 81.4 ± 7.4; analyzed 65.7 ± 14.1 g/100 g) (p = 0.014) ()).
Figure 1. Macronutrient content of commercially available whey proteins is higher than reported per 100 g of product. (a) Calorie (kcal), (b) carbohydrate (g), (c) fat, and (d) protein. *p < 0.05, **p < 0.01, paired t-test. Values expressed as mean.
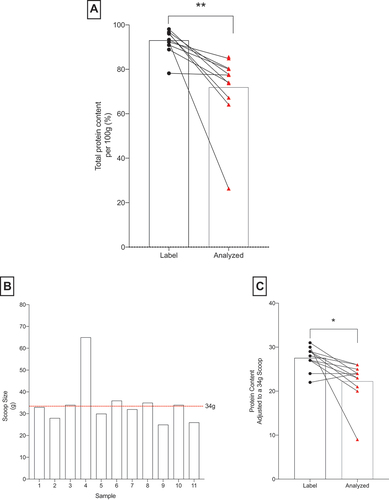
Content per portion is shown in . Calorie content by portion elicited significant differences between measured and analyzed samples (119.8 ± 35.8 kcal vs 126.4 ± 39.5 kcal/portion) (p = 0.003) ()). As for carbohydrate content, the mean content declared by the label was 1.9 ± 4.3 g/portion, while measured 7.5 ± 4.7 g/portion showing a significant difference (p = 0.005) ()). As for fat per portion, no differences were found between labeled and measured ()) (p = 0.29). While protein, measured values were significantly lower than labeled per portion (27.5 ± 6.1 vs 22.6 ± 9.2 g/portion) (p = 0.02) ()). Among products, scoop size varied from 25 to 65 g with an average of 34.3 ± 10 g ()), and even when adjusted to this size, the protein content of the products was shown to be less than declared ()) (p = 0.01).
Figure 2. Whey proteins contain altered macronutrient content per suggested portion. (a) Calorie (kcal), (b) carbohydrate (g), (c) fat, and (d) protein. *p < 0.05, **p < 0.01, paired t-test. Values expressed as mean.
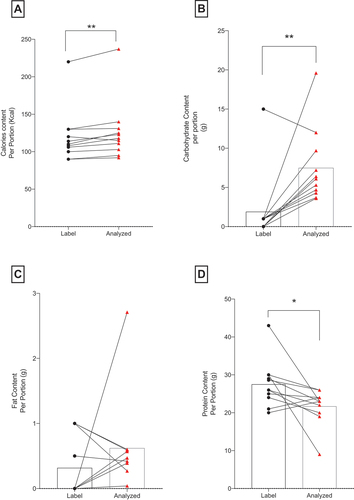
Figure 3. Protein content labeled on available commercially whey proteins is less than measured. (a) Percentage of protein content per 100 g product, (b) differences in Scoop sizes, (c) protein content adjusted to an average of the samples (34 g scoop size). *p < 0.05, **p < 0.01. Paired t-test. Values expressed as mean. Dotted red line (–) represents the average scoop of available whey proteins considered in the study.
4. Discussion
As protein supplements are a preferred and popular way to consume daily protein not only observed in South America but also worldwide, the present study is novel and important, as it sheds scientifically backed evidence of the actual nutritional content of 11, commonly consumed WP supplements. Interestingly, our data indicate that there are significant discrepancies between brand labels (of the 11 proteins investigated in this study – see supplemental tables for nutritional profile information) and the actual macronutrient content of protein products sold in Colombian. This research is important to disseminate, as importantly, consumers should consider thoroughly vetting their dietary supplement products prior to purchase.
Similar research to ours has been previously published. The protein profile content of sports supplements has been reportedly different than previously described by the manufacturers before in different countries [Citation18,Citation24,Citation25]. For example, Kaswari et al. determine protein content via the Kjeldahl method [Citation26] on five commercially available supplements in Indonesia, noting that only two of the samples analyzed (i.e. products) reported having a considerable match between labeled and measured protein [Citation25]. Similarly, Almeida et al. analyzed the protein and amino acid content on 20 whey protein supplements locally manufactured in Brazil and the United States [Citation18]. Interestingly, Almeida and researchers found that Brazilian protein products contained less branched-chain amino acids (BCAA) and total protein informed in their label compared with the Americans. The reduced protein content was reflected on the significantly less α-Lactalbumin and β-lactoglobulin, which represents most of the protein content in these whey products [Citation18]. In the present study, we did not determine amino acid nor α-β-Lactalbumin/lactoglobulin content; however, similarly to Almedia et al. (2016), total protein content determined via the Kjeldahl method was less than declared in all 11 samples analyzed. Further, we noted overall, calories and carbohydrates were higher in the Colombian WP products. The differences in protein determinations have been discussed by Mæhre et al. [Citation27], showing that analytical methods such as Kjeldahl tend to overestimate protein content, specially by the assumption an average nitrogen content that indeed could vary between foods [Citation28]. For this, amino acid analysis is postulated a more precise method for protein analysis, where interfering substances do not affect the result as rely only on amino acid residues [Citation29], however the cost is the main obstacle. Interestingly, more recently, Saxton et al. [Citation30], show that optical spectroscopy, such as mid-infrared spectroscopy (MIR) could be a complementary analysis to support Kjeldahl. Here, beyond amino acid analysis, the quantification of serum proteins β-lactoglobulin, α-lactalbumin, bovine serum albumin (BSA) and IgG using MIR spectra will be desirable and applicable to sport supplement market than warrants further reports.
The difference between products and brands raises the concern regarding the quality of the final product delivered to athletes or the general population that expect to acquire and ingest a specific amount of macronutrients per serving for their particular goal (i.e. simply increase protein consumption, dieting, sports performance, muscle hypertrophy). Carius-Garrido et al., through a proteomic analysis by mass spectrometry (MS), investigated different whey and isolate samples from Brazilian markets [Citation31]. They found that most of the brands analyzed possessed altered and/or sample contamination with other protein sources undeclared on the ingredients list, and a low presence of α-Lactalbumin and β-lactoglobulin in most of the samples. This is indicative of the use of low-quality WP for the development of the products.
Our data and other previous studies to date speak to the importance of dietary supplement regulation and third-party testing mechanisms to help curb the false advertising happening on sports nutrition products. This misinformation is not just happening in Colombian, but also other countries, so all should be aware. This reduction in quality seems to be a ‘normal’ practice in the sports supplement world that needs eradication with tighter control and higher standards on protein quantification, marketing, and delivery.
5. Conclusions
The present work analyzed the protein content of 11 of the most popular protein supplements made and sold in Colombia. This is the first investigation on Colombian-specific products. After comparing with brand labeling, we identified significant differences in protein, carbohydrate, and calories in all selected samples by 100 g selection of the product. When protein portions were set to an average scoop size (34 g), all samples failed to deliver the declared content by each brand. This suggests alterations and brand mislabeling by the product. Thus, Colombian athletes or individuals seeking to ingest protein through these specific supplements may not be consuming the quality and quantity that they are expecting. We conclude that sport nutritionists and consumers need to be aware of the current differences in the protein supplement market to avoid a diminished intake of protein when these sources are preferred. Consumers are encouraged to review supplement best practices, including selecting third-party tested supplement products.
Supplemental Material
Download MS Word (16.1 KB)Supplemental Material
Download MS Word (15.8 KB)Disclosure statement
No potential conflict of interest was reported by the authors.
Supplementary material
Supplemental data for this article can be accessed online at https://doi.org/10.1080/15502783.2022.2090828
Additional information
Funding
References
- Sports Nutrition Market Size & Growth Report, 2021-2028. https://www.grandviewresearch.com/industry-analysis/sports-nutrition-market. Accessed 2021 Sep 9.
- ltd R and M. Global protein supplements market size, share & trends analysis report by source (Animal-based, plant-based), by product (Powder, RTD), by distribution channel (Online stores, DTC), by application, and segment forecasts. 2021-2028. https://www.researchandmarkets.com/reports/4764574/global-protein-supplements-market-size-share-and. Accessed 2021 Sep 14.
- Veldhorst M, Smeets A, Soenen S, et al. Protein-induced satiety: effects and mechanisms of different proteins. Physiol Behav. 2008;94:300–307.
- Bray GA, Smith SR, de Jonge L, et al. Effect of dietary protein content on weight gain, energy expenditure, and body composition during overeating: a randomized controlled trial. Jama. 2012;307:47–55.
- Wirunsawanya K, Upala S, Jaruvongvanich V, et al. Whey protein supplementation improves body composition and cardiovascular risk factors in overweight and obese patients: a systematic review and meta-analysis. J Am Coll Nutr. 2018;37:60–70.
- King DG, Walker M, Campbell MD, et al. A small dose of whey protein co-ingested with mixed-macronutrient breakfast and lunch meals improves postprandial glycemia and suppresses appetite in men with type 2 diabetes: a randomized controlled trial. Am J Clin Nutr. 2018;107:550–557.
- Rakvaag E, Fuglsang-Nielsen R, Bach Knudsen KE, et al. Whey protein combined with low dietary fiber improves lipid profile in subjects with abdominal obesity: a randomized, controlled trial. Nutrients. 2019;11:2091.
- Patel S. Emerging trends in nutraceutical applications of whey protein and its derivatives. J Food Sci Technol. 2015;52:6847–6858.
- Muro Urista C, Fernández R Á, Riera Rodriguez F, et al. Review: production and functionality of active peptides from milk. Food Sci Technol Int. 2011;17:293–317.
- Farnfield MM, Trenerry C, Carey KA, et al. Plasma amino acid response after ingestion of different whey protein fractions. Int J Food Sci Nutr. 2009;60(6):476–486.
- Mølgaard C, Larnkjær A, Arnberg K, et al. Milk and growth in children: effects of whey and casein. Milk and Milk Prod Hum Nutr. 2011;67:67–78.
- Chavan RS, Shraddha RC, Kumar A, et al. Whey based beverage: its functionality, formulations, health benefits and applications. J Food Process Technol. 2015;6:1.
- Baltazar-Martins G, Brito de Souza D, Aguilar-Navarro M, et al. Prevalence and patterns of dietary supplement use in elite Spanish athletes. J Int Soc Sports Nutr. 2019;16:30.
- Whitehouse G, Lawlis T. Protein supplements and adolescent athletes: a pilot study investigating the risk knowledge, motivations and prevalence of use. Nutr Diet. 2017;74:509–515.
- Rivera ACS, Ayala-Guzmán CI, Roldán ABL, et al. Prevalencia y factores asociados al consumo de suplementos nutricionales en asistentes a gimnasios de la Ciudad de México. Revista Española de Nutrición Humana y Dietética. 2021;25:e1159–e1159.
- Jorquera Aguilera C, Rodríguez-Rodríguez F, Torrealba Vieira MI, et al. Consumo, características y perfil del consumidor de suplementos nutricionales en gimnasios de Santiago de Chile. Revista Andaluza de Medicina del Deporte. 2016;9:99–104.
- Neves Db da J, Caldas ED. Dietary supplements: international legal framework and adulteration profiles, and characteristics of products on the Brazilian clandestine market. Regul Toxicol Pharmacol. 2015;73:93–104.
- Almeida CC, Alvares TS, Costa MP, et al. Protein and amino acid profiles of different whey protein supplements. J Diet Suppl. 2016;13:313–323.
- Ingle PD, Christian R, Purohit P, et al. Determination of protein content by NIR spectroscopy in protein powder mix products. J AOAC Int. 2016;99:360–363.
- Top 10 protein supplements. https://labdoor.com/rankings/protein. Accessed 2021 Sep 23.
- ltd R and M. Colombia whey protein market 2018 analysis & forecasts 2014-2022. https://www.researchandmarkets.com/reports/4474050/colombia-whey-protein-market-2018-analysis-and. Accessed 2022 Mar 1.
- Glaves Berhmann A, Gómez-López J, Álvarez M M. Nutritional labeling and amino acid profile in high protein Chilean dairy products: a new alternative for health and sports. Nutr Hosp. 2021;38:1075–1087.
- Cunniff P, Washington DC. Official methods of analysis of aoac international. J AOAC Int. 1997;80:127A.
- Naidoo K, Naidoo R, Bangalee V. Understanding the amino acid profile of whey protein products. Global J Health Sci. 2018;10:45.
- Kuswari M, Gifari N, Nuzrina R, et al. Analysis of protein content on commercial protein supplement in Indonesia. Vol. 6. JUARA : Jurnal Olahraga; 2021. p. 207–212.
- Official Methods of Analysis 2019. AOAC INTERNATIONAL. https://www.aoac.org/resources/official-methods-of-analysis-2019/. Accessed 2021 Sep 7.
- Mæhre HK, Dalheim L, Edvinsen GK, et al. Protein determination—method matters. Foods. 2018;7:5.
- Moore JC, DeVries JW, Lipp M, et al. Total protein methods and their potential utility to reduce the risk of food protein adulteration. Compr Rev Food Sci Food Saf. 2010;9:330–357.
- Energy FF Methods of analysis and conversion factors food and paper nutrition paper. Food and Agriculture Organization: Rome, Italy. 2003.
- Saxton R, McDougal OM. Whey protein powder analysis by mid-infrared spectroscopy. Foods. 2021;10:1033.
- Garrido BC, Ghmf S, Lourenço DC, et al. Proteomics in quality control: whey protein-based supplements. J Proteomics. 2016;147:48–55.