
 ?Mathematical formulae have been encoded as MathML and are displayed in this HTML version using MathJax in order to improve their display. Uncheck the box to turn MathJax off. This feature requires Javascript. Click on a formula to zoom.
ABSTRACT
Background
Based on stoichiometric assumptions, and real-time assessment of expired carbon dioxide (%CO2) and flow rate, the Lumen device provides potential for consumers/athletes to monitor metabolic responses to dietary programs outside of laboratory conditions. However, there is a paucity of research exploring device efficacy. This study aimed to evaluate Lumen device response to: i) a high-carbohydrate meal under laboratory conditions, and ii) a short-term low- or high-carbohydrate diet in healthy volunteers.
Methods
Following institutional ethical approval, 12 healthy volunteers (age: 36 ± 4 yrs; body mass: 72.1 ± 3.6 kg; height: 1.71 ± 0.02 m) performed Lumen breath and Douglas bag expired air measures under fasted laboratory conditions and at 30 and 60 min after a high-carbohydrate (2 g·kg−1) meal, along with capilliarized blood glucose assessment. Data were analyzed using a one-way ANOVA, with ordinary least squares regression used to assess the model between Lumen expired carbon dioxide percentage (L%CO2) and respiratory exchange ratio (RER). In a separate phase, 27 recreationally active adults (age: 42 ± 2 yrs; body mass: 71.9 ± 1.9 kg; height: 1.72 ± 0.02 m) completed a 7-day low- (~20% of energy intake [EI]; LOW) or high-carbohydrate diet (~60% of EI; HIGH) in a randomized, cross-over design under free-living conditions. L%CO2 and derived Lumen Index (LI) were recorded daily across morning (fasted and post-breakfast) and evening (pre/post meal, pre-bed) periods. Repeated measures ANOVA were employed for main analyses, with Bonferroni post-hoc assessment applied (P ≤ 0.05).
Results
Following the carbohydrate test-meal, L%CO2 increased from 4.49 ± 0.05% to 4.80 ± 0.06% by 30 min, remaining elevated at 4.76 ± 0.06% by 60 min post-feeding (P < 0.001, ηp2 = 0.74). Similarly, RER increased by 18.1% from 0.77 ± 0.03 to 0.91 ± 0.02 by 30 min post-meal (P = 0.002). When considering peak data, regression analysis demonstrated a significant model effect between RER and L%CO2 (F = 5.62, P = 0.03, R2 = 0.20). Following main dietary interventions, no significant interactions (diet × day) were found. However, main diet effects were evident across all time-points assessed, highlighting significant differences for both L%CO2 and LI between LOW and HIGH conditions (P < 0.003). For L%CO2, this was particularly noted under fasted (4.35 ± 0.07 vs. 4.46 ± 0.06%, P = 0.001), pre-evening meal (4.35 ± 0.07 vs. 4.50 ± 0.06%, P < 0.001), and pre-bed time-points (4.51 ± 0.08 vs. 4.61 ± 0.06%, P = 0.005).
Conclusion
Our findings demonstrated that a portable, home-use metabolic device (Lumen) detected significantly increased expired %CO2 in response to a high-carbohydrate meal, and may be useful in tracking mean weekly changes to acute dietary carbohydrate modifications. Additional research is warranted to further determine the practical and clinical efficacy of the Lumen device in applied compared to laboratory settings.
Introduction
Nutritional intake is an essential component influencing exercise adherence and aerobic/anaerobic sports performance [Citation1–7]. As part of this, metabolic responses to dietary intake can provide strategic advantages when planning and undertaking exercise programs [Citation8]. The importance of individualized dietary advice has been increasingly recognized, including day-to-day tailored recommendations before, during, and after training and/or competition [Citation3]. Estimates of metabolic responses under resting (fed/fasted) and exercise conditions are typically measured using indirect calorimetry, notably the use of Douglas bag expired air collection [Citation9,Citation10], through to ventilated hood or breath-to-breath analyzers [Citation10–15]. Through assessment of expired fractional gas measures under controlled laboratory conditions [Citation15], metabolic rate and relative contribution of energy substrates (notably fat and carbohydrate oxidation rates) can be estimated from stoichiometric equations [Citation15–20] or extrapolated from the respiratory quotient (RQ)/respiratory exchange ratio (RER) [Citation21]. Estimation of macronutrient contribution to energy demands is important for evaluating metabolic change and/or metabolic flexibility in relation to dietary or exercise-based interventions [Citation22–25]. However, accurate determination of metabolic patterns typically involves controlled laboratory conditions, as well as expensive analytical equipment [Citation13,Citation26–28].
Moreover, while laboratory-based studies tend to report pre-to-post dietary intervention effects, it is challenging to accurately quantify non-laboratory-based metabolic measures to quantify the metabolic effects of dietary programs. Home-use devices such as glucose monitors and cardiovascular trackers are becoming more available and, with technological advancements, are becoming more cost-effective [Citation29]. However, there are currently limited market resources to quantify expired air analysis outside of laboratory conditions (i.e. at home or other field settings). Therefore, the potential to accurately assess or track substrate utilization away from the laboratory may be beneficial in supporting nutrition or exercise-based research (e.g. participant adherence to dietary interventions) or from a consumer self-monitoring perspective (e.g. application of a personalized nutrition approach, or periodized dietary preparations for an event). One such device (Lumen, MetaFlow Ltd.) currently available to consumers is marketed as the ‘first hand-held, portable device to accurately measure metabolism’ (www.lumen.me). Based on real-time assessment of expired percentage of carbon dioxide (%CO2) and flow rate after a breath-hold procedure, the Lumen device is proposed to support monitoring for weight loss programs and longer-term metabolic flexibility, as well as support individual responses to tailored dietary strategies. Based on stoichiometric assumptions, a lower RER (i.e. volume of expired CO2 [CO2] per minute divided by the volume of inspired oxygen [
O2] per minute) of ~0.7 indicates the prevalence of fat oxidation to total energy contribution. In contrast, a raised RER value approaching ~1.0 indicates greater dominance from total carbohydrate oxidation [Citation30,Citation31].
Whilst the Lumen device only measures %CO2, previous validation work has been undertaken in comparison to laboratory-based assessment of RER [Citation32]. Following a 150 g total glucose load, both RER and Lumen %CO2 (L%CO2) significantly increased, with regression analysis supporting the agreement between an acute 0.09 unit increase in RER corresponding with a 0.28% increase in L%CO2 [Citation32]. Therefore, the Lumen device could provide indirect estimates of substrate use [Citation33], and potentially be used to track changes in dietary (i.e. carbohydrate) intake [Citation34]. However, assessment of the Lumen device under free-living conditions is warranted to understand device efficacy, particularly in response to acute dietary changes (e.g. a reduction in total carbohydrate intake or carbohydrate loading). This could facilitate its use in wider research and clinical settings, benefit sport and exercise applications, and support consumer guidance. This project therefore involved two aims: i) to undertake an independent assessment of the Lumen device under controlled laboratory conditions in relation to a standardized test meal; and ii) to investigate the efficacy of the Lumen device in tracking %CO2 responses to an acute low- and high-carbohydrate diet in healthy volunteers.
Materials and methods
Ethical approval
This project employed a two-phase approach encompassing a laboratory-based device assessment and a separate dietary intervention study. For both phases, institutional ethical approval was obtained from the School of Psychology and Sports Science Research Ethics Panel, Anglia Ruskin University (Ethical approval number: SREP/SES_Staff_19-21) and was conducted in accordance with the Declaration of Helsinki (2013).
Phase 1: laboratory-based device assessment
Study participants and eligibility criteria
Following a priori power calculation (G*power3, Dusseldorf, Germany [Citation35]; using α = 0.05; 1 − β = 0.80, based on observed L%CO2 responses to a test meal [Citation32]), a minimum sample size of 10 was determined. Participants were required to meet specific eligibility criteria for this phase, including: no known history of metabolic disorders, cardiovascular disease, or hypertension; no recent illnesses or viral infections (including Covid-19); no use of medication or participating in any current diet programs. All participants were considered generally healthy, with a body mass index (BMI) of <29.9 kg·m2, and were actively engaged in recreational exercise weekly (~3–5 sessions per week). Importantly, all participants were required to have access to a smartphone (iOS or Android) for the purposes of Lumen mobile application accessibility. Before study inclusion, participants attended a full study briefing and provided written informed consent. From initial recruitment, 12 participants (5 male, 7 female) satisfactorily completed this phase (mean ± standard error [SE]: age: 36 ± 4 yrs; body mass: 72.1 ± 3.6 kg; height: 1.71 ± 0.02 m; BMI: 24.6 ± 1.2 kg·m2).
Experimental protocol
All participants were initially provided with an individual Lumen device with study-specific login details and guided instructions for use. An initial 7-day period was allocated to allow participant familiarization with the device and the specific breath maneuver, and synchronization of the Lumen software to individual daily breath responses. The device utilizes a single breath measure (after a standardized seated rest period) involving a deep inhalation with a 10 s breath hold followed by a flow-rate controlled exhalation procedure. Based on the assumption that under resting state conditions individual oxygen consumption (O2) should remain relatively constant, metabolic fluctuations should therefore reflect CO2 changes in expired air. Device reliability was derived from duplicate %CO2 measures within <0.2%. If the error margin exceeded 0.2%CO2, users were required to rest a further 5 min before repeating the procedure to ensure stable reliability. A Lumen Index (LI) from 1 to 5 is derived from the application software based on individual updated L%CO2 range (lowest to highest), in alignment with prior validation research [Citation32]. An LI of 1 indicates the lowest assumed RER based on L%CO2 regression agreement with RER (i.e. greater relative fat oxidation), and 5 indicates a higher assumed RER (hence greater relative carbohydrate utilization), with remaining values based on quintile distribution of the individual L%CO2 range.
Following device habituation, participants attended the Human Physiology Laboratory in a rested state (avoiding exercise in the pre-24 h period) and having completed a standardized overnight fasting period (~10–12 h). Upon arrival, participants were assessed for body mass (Tanita SC-330ST, Amsterdam, The Netherlands) and height (Seca CE123, Hamburg, Germany), before resting in a comfortable supine position for 10 min in a thermoneutral environment (20.6 ± 0.9°C, 61 ± 5% humidity, 758.3 ± 2.8 mmHg). Participants then performed duplicate seated Lumen measures as guided by the mobile application platform. On completion of the Lumen measures, participants remained seated whilst duplicate expired air samples were collected using the Douglas bag method, and analyzed for percentage O2 and CO2 using a Servomex MINIMP 5200 gas analyzer (Servomex Group Ltd, Crowborough, UK; gas calibration accepted with a <0.2% error margin, and flow rate/volume calibration accepted with a <1.0% error margin). Total Douglas bag volume was measured using a Harvard dry gas meter (Harvard Apparatus, Holliston, USA), with sample temperature recorded during volume measurement. Estimates of O2 and
CO2 were corrected against ambient environmental conditions. A 20 μL capillarized blood sample was then collected for analysis of glucose using a Biosen C_Line automated analyzer (EKF Diagnostics, Cardiff, UK).
Following resting measures, participants then consumed a test breakfast meal (sports drink and porridge) comprising a total carbohydrate load of 2 g·kg−1 body mass. This load was based on similar research [Citation32] instigating a fixed 150 g carbohydrate dose, but tailored relative to participant body mass and based on a high-carbohydrate daily plan (~6 g·kg−1). The meal consisted of a sports drink (Maurten Hydrogel Sports Fuel Drink Mix 320, Maurten UK Ltd., London, UK; comprising 41 g total carbohydrate per sachet), which was standardized to 75 g of total carbohydrate mixed with 400 mL of water. The remaining carbohydrate load was calculated against individual body mass delivered via a basic porridge meal (Quaker Oats So Simple, Reading, Berkshire, UK; comprising 26 g total carbohydrate per sachet). To standardize fluid intake, the test meal was made with a total of 9 mL·kg−1 water (with sports drink water volume deducted). As such, the mean carbohydrate intake for the test meal was 69.1 ± 25.1 g, and mean fluid intake (excluding sports drink) was 248.5 ± 113.0 mL. Mean total carbohydrate load was 144.1 ± 25.1 g. Participants were required to consume the test meal over a 10 min timed period. Further duplicate Lumen and Douglas bag measures and capillarized blood samples were collected post-meal at 30 min (P30) and 60 min (P60) (with the timer started at the beginning of consumption of the test meal).
Phase 2: main dietary intervention assessment
Study participants and eligibility criteria
For the main intervention, sample size power calculation (G*power3, Dusseldorf, Germany [Citation35]) was undertaken using L%CO2 data from our laboratory-based study and determined a sample size of 15, using an α = 0.05 and 1 − β = 0.80. Participants were recruited based on the same inclusion criteria as the laboratory-based assessment study. Prior to study inclusion, participants attended a separate study briefing and provided written informed consent. An initial pool of 31 participants took part in the study, from which 4 were eliminated from the final analysis based on non-compliance with the main study protocol (i.e. were either on a hypocaloric diet or did not conform to the study parameters). A cohort of 27 participants (9 males, 18 females) were therefore included in final analyses (Mean ± SE: age: 42 ± 2 yrs; body mass: 71.9 ± 1.9 kg; height: 1.72 ± 0.02 m; BMI: 24.5 ± 0.7 kg·m2).
Experimental design and intervention
For the main study, a randomized, cross-over, dietary controlled design was implemented. Participants initially attended the laboratory to collect study equipment, comprising a Lumen device (with individual study login/code allocation), a Xiaomi Mi Smart Band 4 heart rate monitor, and a Xiaomi Mi Body Composition Scale 2 (Xiaomi Technology UK Ltd., Reading, UK). During this initial visit, participants were measured for both height (Seca CE123, Hamburg, Germany) and body mass (Seca 780, Hamburg, Germany); with laboratory assessed body mass cross checked against the Xiaomi Mi Smart Scale (mean difference 0.2 ± 0.1 kg, P > 0.05). Participants were also provided with guided instructions into the set up and use of the Lumen device, along with an activity diary and individual MyFitnessPal application accounts (MyFitnessPal, Inc., San Francisco, CA, USA).
Participants then had a 10-day habituation period to activate their Lumen application and become familiar with the specific breath maneuver, and gather typical ranges based on minimum/maximum L%CO2 measured values. During the final 7-days, participants recorded their normal exercise patterns using the daily activity log provided to account for session type, mean session heart rate, exercise duration, and session perceived exertion. From this mean weekly training load, training monotony and strain were estimated based on previous research [Citation36]. In addition, participants were provided with individual guidance on daily completion of dietary intake using the smart phone application (MyFitnessPal) with due attention to meal content and brands, portion size/weight, and fluid intake, as previously reported by our group [Citation37]. Individual records were assessed daily by the same researcher to ensure satisfactory compliance and completion detail. Food diaries were then assessed by the same researcher using Nutritics Professional Dietary Analysis software (Nutritics Ltd., Co. Dublin, Ireland).
From this initial habituation period (NORM), individual maintenance caloric intake was determined based on predicted basal metabolic rate (using the Harris-Benedict formula), adjusted against habitual training demands and estimated non-exercise activity thermogenesis [Citation38]. Participants were randomly assigned a 7-day dietary intervention comprising either isocaloric low-carbohydrate (LOW) intake (target ratio of ~20–25% EI from carbohydrate, 15–20% protein, 55–60% fat) or isocaloric high-carbohydrate (HIGH) intake (target ratio ~55–60% EI from carbohydrate, 15–20% protein, 20–25% fat). Individual guidance on meal-planning was provided for each dietary intervention. The dietary interventions were interspersed with a ‘wash-out’ period of at least 7 days returning to habitual intake.
Throughout all dietary periods, participants were requested to perform duplicate Lumen device measures at the following daily stipulated periods: i) overnight fasted (~10 h), morning assessment (30 min post-waking) and morning body mass; ii) 45 min post-breakfast; iii) immediately pre-evening meal; iv) 45 min post-evening meal; and v) pre-bed. Instructions were provided for participants to rest in a comfortable seated position for ~5 min before each measured time-point to standardize the process.
Quality control
Every Lumen breath session undertaken by the participants was stored through the Lumen application in an online platform, and reviewed by one experienced researcher on the acceptability and repeatability criteria for each breath. Acceptability was based on ambient air %CO2 and Lumen breath maneuver requirements for inhaled volume, breath hold time, and exhaled volume. The session %CO2 was determined through replicate measures with a difference <0.2%. Breath sessions that did not meet acceptability criteria were removed from the final analysis.
Statistical analyses
Statistical analyses were performed using SPSS (v26, IBM, NY, USA). Dependent variable distributions were assessed for normality using a Shapiro-Wilk test, with outlier evaluation using 1.5 x interquartile range. Laboratory-based data were assessed using a one-way ANOVA, with ordinary least squares regression used to assess the model between L%CO2 and RER. For the main intervention, a mixed design repeated measures ANOVA (diet, day) was performed for L%CO2 and LI score, with Bonferroni post-hoc assessment where applicable. Where sphericity was violated, a Greenhouse–Geisser correction was applied. An α level of ≤0.05 was employed for statistical significance, with effect size (partial eta squared; ηp2) also reported (small = 0.02, medium = 0.13, large = 0.26). Data are reported as the mean ± SE.
Results
Phase 1: laboratory-based device assessment
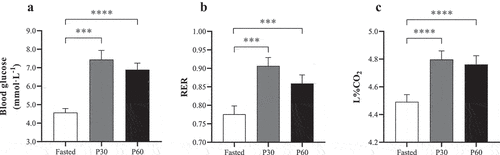
Laboratory-based assessment of the Lumen device is shown in for mean blood glucose, RER, and L%CO2. Blood glucose significantly increased (F = 21.82, P < 0.001, ηp2 = 0.67) from 4.57 ± 0.22 to a peak of 7.44 ± 0.49 mmol·L−1 by 30 min post-meal (P = 0.001), and remained elevated at 60 min (6.89 ± 0.36 mmol·L−1; P < 0.001 compared with rest). Likewise, RER peaked at 30 min post-meal (F = 16.37, P < 0.001, ηp2 = 0.62), increasing by 18.1% to 0.91 ± 0.02 (P = 0.002) and remained elevated compared with resting RER at 60 min (0.86 ± 0.02; P = 0.003). The impact of the test meal also resulted in a significant increase in L%CO2 (F = 30.49, P < 0.001, ηp2 = 0.74) from 4.49 ± 0.05% to 4.80 ± 0.06% by 30 min, remaining elevated at 4.76 ± 0.06% at 60 min (P < 0.001). For all measures, no differences were observed between P30 and P60 (P > 0.05).
Figure 1. Comparison between fasted and post-meal (30 and 60 min) laboratory and Lumen device measures: (a) blood glucose (mmol·L−1); (b) expired air respiratory exchange ratio (RER); and (c) Lumen%CO2 (L%CO2). *** Denotes significant difference between paired timepoints (P ≤ 0.003). **** Denotes significant difference between paired timepoints (P < 0.001).
Mean Douglas bag data are shown in . No significant differences were reported over time for fractional expired oxygen percentage (FEO2%) or O2 (L·min−1; P > 0.05). Fractional expired %CO2 (FECO2%) increased significantly over time (F = 4.48, P = 0.03, ηp2 = 0.31), with post-hoc analysis demonstrating a significant increase by P30 (P = 0.047) but not P60 (P > 0.05). However,
CO2 (L·min−1) significantly increased over time (F = 15.90, P < 0.001, ηp2 = 0.61) both at P30 (P = 0.005) and P60 (P = 0.001) compared with fasted. Minute ventilation (
E) also increased over time (F = 8.42, P = 0.002, ηp2 = 0.46), with paired significance only demonstrated at P60 compared with fasted (P = 0.014).
Table 1. Mean Douglas bag data for fasted and post-meal respiratory measures.
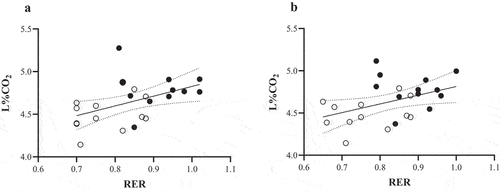
Ordinary least squares regression was employed to assess the model fit between RER and L%CO2 using fasted and post-meal measures. When considering peak (P30) values, a significant regression model was found (F = 5.62, P = 0.03, R2 = 0.20; see tile A) with L%CO2 found to significantly predict RER (β = 1.042, P = 0.03). When mean post-meal data were considered, a significant model effect was also similarly found (F = 5.35, P = 0.03, R2 = 0.20; see tile B). Based on these models, it was estimated that each 0.1 unit increase in RER corresponded with an 0.11% increase in L%CO2.
Figure 2. Ordinary least squares regression between expired RER and Lumen %CO2 (L%CO2) for: (a) fasting and 30 min post-meal (P30); (b) fasting and mean post-meal data. Open circles indicate fasting measures; closed circles represent respective fed measures.
Phase 2: main dietary intervention assessment
Dietary monitoring and training load
Dietary intake adherence to the intervention is shown in . No significant differences were observed for absolute or relative caloric intake between LOW or HIGH, or compared with prior habitual intake (P > 0.05). Furthermore, no differences were observed between estimated maintenance kilocalories (2277.1 ± 60.3 kcal·d−1) compared with caloric intake during both LOW and HIGH (P > 0.05). Protein intake as a percentage of caloric intake was equally maintained across both LOW (19.9 ± 0.3%) and HIGH (19.3 ± 0.4%) interventions (P > 0.05), in accordance with the targeted maintenance kilocalories.
Table 2. Mean dietary intake at baseline and across intervention periods.
As expected, a significant main effect was found for total carbohydrate intake (F = 149.23, P < 0.001, ηp2 = 0.85). For LOW, mean carbohydrate intake was at the lower range of the targeted 20–25% EI (19.9 ± 0.6%) and was significantly lower than both NORM and HIGH (P < 0.001). For HIGH, mean carbohydrate intake satisfactorily met the targeted 55–60% EI range (56.3 ± 0.8%) and was significantly greater than both NORM and LOW demonstrating adherence to the dietary interventions overall (P < 0.001). Likewise, there was a significant main effect for total fat intake (F = 258.54, P < 0.001, ηp2 = 0.91), with mean relative contribution satisfactorily meeting the targeted 55–60% EI for LOW (57.7 ± 0.8%) and 20–25% EI for HIGH (22.8 ± 0.6%), in both cases being significantly different to NORM and the opposite intervention (P < 0.001). No significant differences were reported for body mass at the start of each dietary period (NORM: 71.9 ± 1.9 kg; LOW: 71.6 ± 2.0 kg; HIGH: 72.7 ± 2.3 kg, P > 0.05). Training load comparisons across all dietary periods are shown in . No significant differences were reported between dietary periods for any of the training load variables (P > 0.05) indicating relative consistency across the study duration.
Table 3. Training load comparisons across dietary periods.
Lumen response to dietary interventions
Mean L%CO2 and LI values across each dietary period are shown in , respectively. Under fasted conditions, there was a significant main diet effect for L%CO2 (F = 8.05, P < 0.001, ηp2 = 0.05) and LI (F = 10.84, P < 0.001, ηp2 = 0.07). For HIGH, mean fasted L%CO2 (4.46 ± 0.06%) and LI (2.9 ± 0.2 arbitrary units [AU]) were significantly greater than both NORM (P < 0.005) and LOW (P < 0.001). However, no post-hoc differences were observed between NORM and LOW (P > 0.05).
Figure 3. Mean Lumen %CO2 responses for NORM, LOW, and HIGH according to: (a) ~30 min post-waking fasted assessment; (b) ~45 min post-breakfast; (c) immediately before evening meal; (d) ~45 min post evening meal; and (e) immediately before bed. * Denotes significant difference between paired timepoints (P ≤ 0.043). ** Denotes significant difference between paired timepoints (P ≤ 0.009).
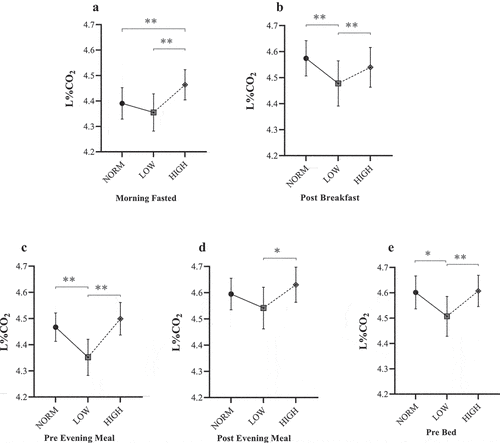
Figure 4. Mean Lumen Index responses for NORM, LOW, and HIGH according to: (a) ~30 min post-waking fasted assessment; (b) ~45 min post-breakfast; (c) immediately before evening meal; (d) ~45 min post evening meal; and (e) immediately before bed. AU = arbitrary units. * Denotes significant difference between paired timepoints (P ≤ 0.028). ** Denotes significant difference between paired timepoints (P ≤ 0.005).
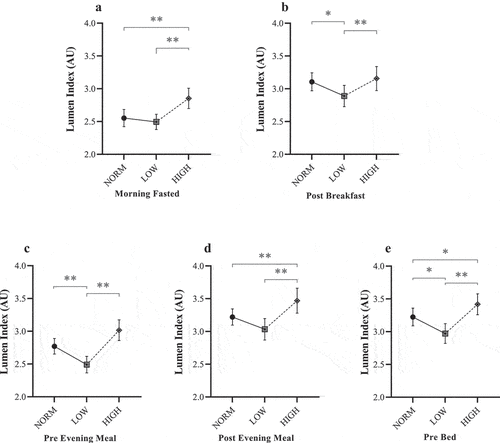
There was also a main diet effect found for L%CO2 (F = 7.30, P < 0.001, ηp2 = 0.04) and LI (F = 7.49, P < 0.001, ηp2 = 0.04) when considering mean values over each dietary period in relation to the first meal of the day. In contrast to morning fasted values, post-hoc analysis revealed significantly lower values following LOW (L%CO2 = 4.48 ± 0.09%, LI = 2.9 ± 0.2 AU) compared with both NORM (L%CO2 = 4.57 ± 0.07%, LI = 3.1 ± 0.1 AU: P < 0.023) and HIGH (L%CO2 = 4.54 ± 0.08%, LI = 3.2 ± 0.2 AU; P < 0.004).
Lumen values typically decreased by the evening meal. For the pre-evening meal measures, a significant main effect was found for both L%CO2 (F = 19.59, P < 0.001, ηp2 = 0.10) and LI (F = 19.12, P < 0.001, ηp2 = 0.10), demonstrating a similar pattern to post-breakfast measures. Post-hoc analyses demonstrated a significantly lower L%CO2 (4.35 ± 0.07%) and LI (2.5 ± 0.1 AU) for LOW compared with both NORM and HIGH (P < 0.001), although no differences were reported between NORM and HIGH (P > 0.05). The consensus between L%CO2 and LI was consistent until post-dinner measures. At this point, there was a main effect for L%CO2 (F = 5.87, P = 0.005, ηp2 = 0.03), whereby mean L%CO2 was significantly different between intervention diets only (LOW = 4.54 ± 0.08%; HIGH = 4.63 ± 0.07%; P = 0.01). Whilst this same comparison was also detected for LI (F = 12.13, P < 0.001, ηp2 = 0.06), values were considerably greater for HIGH (3.5 ± 0.2 AU) compared to both LOW (3.0 ± 0.2 AU; P < 0.001) and NORM (3.2 ± 0.1 AU; P = 0.005). Post-dinner measures were not different between NORM and LOW (P > 0.05).
For the final measure for each day (pre-bed), a significant main effect was found for both L%CO2 (F = 6.18, P = 0.003, ηp2 = 0.03) and LI (F = 14.97, P < 0.001, ηp2 = 0.08). For L%CO2, values were notably lower following LOW (4.51 ± 0.08%) compared with both NORM (4.60 ± 0.06%; P = 0.04) and HIGH (4.61 ± 0.06%; P = 0.005), respectively. Similarly, following LOW, LI values were significantly lower (3.0 ± 0.2 AU) than both NORM (3.2 ± 0.1 AU; P = 0.02) and HIGH (3.4 ± 0.2 AU; P < 0.001). However, it was also noted that a significant difference existed between NORM and HIGH (P = 0.03) in contrast to the pattern for L%CO2.
Discussion
The aim of the current study was to undertake an independent assessment of the efficacy of the Lumen breath device to track %CO2 in response to acute dietary changes in healthy volunteers under real-world conditions. As part of this, we also undertook an independent assessment of the Lumen device under controlled conditions. Findings from our laboratory assessment concurred with those previously reported [Citation32], demonstrating that glycemic response to a carbohydrate-rich test-meal corresponds with distinctive increases in both RER and L%CO2. In the current study, however, we employed a fixed meal plan in contrast to previous research [Citation32] which provided three 50 g glucose solutions separated by 20 min each. This was to instigate a more realistic feeding strategy in line with a high-carbohydrate meal approach. In the current study using the Douglas bag method, an 18.1% (or 0.14 unit) increase in RER corresponded with a 6.9% increase in L%CO2 (or 0.31 absolute %CO2 increase). Lorenz et al. [Citation32] similarly demonstrated an 11.0% increase in RER (or 0.09 unit), using a metabolic cart, corresponded with a 6.6% increase in L%CO2 (or 0.28%CO2 increase). We also demonstrated a significant regression model effect between RER and L%CO2 using both peak (P30) values (P = 0.03, R2 = 0.20) and mean post-fed values (P = 0.03, R2 = 0.20), again comparable to previous research [Citation32]. Expired air analysis demonstrated that changes in RER following the carbohydrate meal likely reflect an increased CO2 (~940 mL), with a smaller (~673 mL) non-significant change in
O2.
Our findings are consistent with previous research [Citation39–46], whereby post-prandial CO2 production is associated with increased
E to facilitate constant arterial CO2 tension (PaCO2). This also highlights the critical importance of standardizing resting procedures as part of Lumen measurements to ensure stable O2 use. Our results therefore infer that relative changes in L%CO2 in response to a test meal may be useful for tracking corresponding metabolic changes based on acute shifts in CO2 production, on the assumption that O2 consumption remains relatively constant. As the Lumen device does not measure %O2, more accurate quantification of metabolic changes cannot be ascertained. Instead, the device may be pertinent for indirect tracking of metabolic alterations to carbohydrate-based meal patterns, and further validation work is warranted.
For the main study, dietary consistency was generally met across the intervention stages, with mean macronutrient distribution ranges achieved for both LOW and HIGH carbohydrate weeks. An important finding from our study was that when macronutrient ratios (particularly for carbohydrate intake) were significantly polarized (i.e. ~20% vs. 60% of caloric load), consistent and significant differences were found for both mean L%CO2 and LI for all timepoints assessed. However, no interactions between diet and time were found for any measures, indicating that day-to-day changes were not significant. These findings therefore highlight that mean weekly changes in L%CO2 and LI measures may provide better indicators of general metabolic adaptations in response to acute dietary changes, particularly when the macronutrient ‘shifts’ are significant. This may have important implications for end-user interpretations when using the device.
One contention with this suggestion, however, is that end-users do not view real-time L%CO2 data, and instead only view a derived LI to provide an indicator of metabolic fuel contribution (based on regression agreement between L%CO2 and RER). However, a critical insight is that this largely depends on the spread of variance in L%CO2 values and, indeed, assumed RER range for a particular individual. From a metabolic perspective, whilst a low LI score (i.e. 1) may be associated with a lower relative RER value, if the distribution of L%CO2 is narrow, then presumed metabolic changes may be minimal. Additionally, RER values typically range from 0.7 to 1.0 under resting conditions, with extremes of this range associated with fat and carbohydrate utilization respectively (and mixed fuel utilization in between). This has important implications for end-user interpretation of results, particularly if assessing acute changes or if resting procedures are not appropriately standardized.
Furthermore, in the current study, mean LI data were compiled to one decimal place to reflect the subtle changes observed. Indeed, across both dietary interventions, mean LI ranged from 2.5 (morning fasted on LOW) to 3.5 (post evening meal on HIGH), supporting the small effect sizes observed. Whilst it was expected that the transition to a low-carbohydrate diet might result in a consecutive reduction in L%CO2 and LI under fasting conditions as example, this was only partly observed over days 2–4, after which measures fluctuated in line with potential metabolic adaptations (i.e. ketosis [Citation47,Citation48]) resulting in subtle increases in L%CO2. As such, end-users should be mindful of tracking mean weekly LI to have a more reliable understanding of individual responses to acute dietary patterns at a particular point in the day.
When comparing differences between NORM and LOW, our findings indicated that statistically significant responses occurred for both mean L%CO2 and LI post-breakfast, pre-evening meal, and pre-bed. However, differences were not found under fasting conditions. This may indicate that metabolic adaptations to an acute low-carbohydrate diet are better observed at these times, with lack of significance under fasting conditions potentially reflecting acute ketogenic influence on CO2 fluctuations in the latter half of the week. Longer term dietary monitoring is therefore warranted to clarify these findings, especially in light of ketogenic adaptations to prolonged low-carbohydrate or intermittent fasting protocols [Citation49,Citation50].
In contrast, the main time point where significant differences were observed between NORM and HIGH for both mean L%CO2 and LI was under fasting conditions. Mean carbohydrate intake under NORM represented 41.7% of EI compared with 56.3% for HIGH. Increased consumption of carbohydrate over the intervention period may have influenced carbohydrate oxidation rates [Citation51,Citation52] leading to elevated expired CO2 under fasted conditions. Potentially, this infers that when dietary carbohydrate is significantly increased, Lumen measures tracked under fasting conditions may offer a more reliable or standardized time-point. However, further research is required to corroborate these observations.
It is important to recognize several limitations of the current study. Whilst sample size was deemed sufficient, a larger sample pool representative of wider consumer, athletic, or clinical populations is warranted to determine the effectiveness of the Lumen device in different settings. Indeed, the current study involved recreationally active volunteers, and expired percentage CO2 may be elevated in trained athletes [Citation53]. Furthermore, circadian hormonal patterns (i.e. across the menstrual cycle) were not determined which may influence metabolic responses to dietary interventions. Further research on the efficacy of the Lumen device, particularly with female users, is therefore warranted to determine endocrine influence on L%CO2 variance. As this study aimed to assess device efficacy under real-world settings, specific meal volume/quantity and set timings were not controlled for. In the current study, overall effect sizes were relatively small; therefore, when strict meal type/amount and timings are followed, metabolic responses based on expired CO2 may be greater. Furthermore, whilst overnight fasting periods were appropriately standardized (~10 h), longer term fasting periods may yield different results.
Whilst the current study demonstrates that the Lumen device may provide useful mean weekly differences between polarized dietary conditions, day-to-day variance did not yield significant findings. Therefore, future research should aim to provide further confirmation on the efficacy and accuracy of the device under controlled laboratory conditions (i.e. with standardized test meals), or with progressive increments of carbohydrate intake to determine whether a ‘threshold’ level for meaningful detection exists. As the current study investigated acute dietary interventions, it would also be meaningful to determine longer term patterns with device use when undertaking dietary programs (e.g. ketogenic diets) alongside laboratory (e.g. RER, blood ketone assessment) or other proxy measures (e.g. glucose monitoring, breath acetone).
Translational aspects
Our findings support previous research [Citation32] that the device detects acute changes in L%CO2 following a significant increase in carbohydrate intake, and collectively these results demonstrate that the Lumen device could have pertinent applications in non-invasively monitoring response to acute meal settings (e.g. pre-exercise carbohydrate strategies) considering previous research highlighting the association between carbohydrate oxidation and exercise performance [Citation18,Citation38,Citation54–56].
For the main aspect of this study, our findings also highlight that the device could be useful for monitoring mean weekly changes in L%CO2 and LI in response to acute dietary approaches (i.e. carbohydrate reduction for weight loss, or carbohydrate-loading for endurance events). However, our results did not demonstrate day-to-day changes at a particular time-point, which may have pertinent applications for end-users when interpreting acute differences between days. The Lumen device may therefore be pertinent for monitoring relative consistency to a targeted nutrition program, with applications to research and individual-user contexts (e.g. at-home monitoring of adherence to a low- or high-carbohydrate diet).
It is important to note that results may be different for chronic interventions (particularly in line with assessment of metabolic flexibility) and further studies should assess the efficacy and practical benefits of using the device longitudinally. End-users should be mindful that metabolic responses to dietary interventions are both complex and highly individualized. This is further apparent when considering differences between trained/lean and untrained/obese populations. Whilst dietary interventions (e.g. low-carbohydrate ketogenic, fat restricted or targeted energy-reduced diets) may modify substrate utilization (i.e. an increase in fat oxidation) leading to improved body composition [Citation57,Citation58], particularly in overweight individuals [Citation47,Citation59], this may not necessarily confer performance benefits (e.g. increased peak power or time to exhaustion [Citation57,Citation60], prolonged endurance [Citation58], or efficient glycogen use [Citation61]). Use of additional measures (e.g. body composition, performance data) may therefore be relevant as an adjunct strategy to support application of the Lumen device. Finally, further research should be undertaken to assess device efficacy in relation to specific end-user goals pertinent to metabolic outcomes [Citation62].
Conclusion
A portable, home-use metabolic device (Lumen) detected significantly increased expired %CO2 in response to a high-carbohydrate test meal, and may be useful in tracking mean weekly changes to acute dietary carbohydrate modifications, especially when protein intake is standardized. Lumen measures following a high-carbohydrate diet may be better assessed under fasting conditions, whereas measures post-breakfast may be better suited for monitoring low-carbohydrate diets. Further research comparing applied versus laboratory settings is warranted to establish clinical and practical efficacy of the Lumen device, particularly in relation to end-user goals.
Abbreviations
BMI: body mass index; EI: energy intake; FECO2: fraction of expired carbon dioxide; FEO2: fraction of expired oxygen; HIGH: high-carbohydrate diet intervention; L%CO2: Lumen breath percent carbon dioxide; LI: Lumen Index; LOW: low-carbohydrate diet intervention; NORM: habitual diet intake; RER: respiratory exchange ratio; RQ: respiratory quotient; CO2: volume of expired carbon dioxide;
O2: volume of oxygen consumption;
E: minute ventilation.
Authors’ contributions
JR, DD, TS conceived the idea and designed the study in conjunction with SY and MM. JR, DD, and TS conducted data collection. JR, DD, TS, JP, JL, and AW analyzed and interpreted the data. JR, DD, and TS prepared the manuscript with assistance from JL, JP, and AW. All authors read and approved the final manuscript.
Data sharing statement
The data collected and analyzed in this study are available from the corresponding author upon reasonable request (https://aru.ac.uk/people/justin-roberts).
Ethics statement
All protocols and procedures were approved by the School of Psychology and Sports Science Research Ethics Panel, Anglia Ruskin University. All participants provided written informed consent.
Acknowledgments
The authors would like to acknowledge Andrew Nwajei for his support in undertaking the laboratory-based device assessment phase. The authors would also like to thank MetaFlow Ltd. for their input in providing study equipment and technical support.
Disclosure statement
Whilst this study was undertaken independently, both SY and MM are employed by MetaFlow Ltd. As such, they were only involved with conceptual design and equipment support, and were fully independent of the main research team conducting the data collection for this study. TS has acted in a scientific advisory capacity for MetaFlow Ltd. This has therefore been noted for transparency.
Additional information
Funding
References
- Jeukendrup AE. Carbohydrate intake during exercise and performance. Nutrition. 2004;20:669–86.
- Stellingwerff T, Morton JP, Burke LM. A framework for periodized nutrition for athletics. Int J Sport Nutr Exerc Metab. 2019;29(2):141–151.
- Jeukendrup AE. Periodized nutrition for athletes. Sports Med. 2017;47(Suppl 1):51–63.
- Cox GR, Clark SA, Cox AJ, et al. Daily training with high carbohydrate availability increases exogenous carbohydrate oxidation during endurance cycling. J Appl Physiol. 2010;109:126–134.
- Antonio J, Candow DG, Forbes SC, et al. Effects of dietary protein on body composition in exercising individuals. Nutrients. 2020;12(6):1890.
- Zoorob R, Parrish ME, O’Hara H, et al. Sports nutrition needs: before, during, and after exercise. Prim Care. 2013;40(2):475–486.
- Thomas DT, Erdman KA, Burke LM. Position of the academy of nutrition and dietetics, dietitians of Canada, and the American College of Sports Medicine: nutrition and athletic performance. J Acad Nutr Diet. 2016;116(3):501–528.
- Spriet LL, Peters SJ. Influence of diet on the metabolic responses to exercise. Proc Nutr Soc. 1998;57(1):25–33.
- Shephard RJ. Open-circuit respirometry: a brief historical review of the use of Douglas bags and chemical analyzers. Eur J Appl Physiol. 2017;117:381–387.
- Mtaweh H, Tuira L, Floh AA, et al. Indirect calorimetry: history, technology, and application. Front Pediatr. 2018;6:257.
- Goedecke JH, Clair Gibson A, Grobler L, et al. Determinants of the variability in respiratory exchange ratio at rest and during exercise in trained athletes. Am J Physiol Endocrinol Metab. 2000;279(6):E1325–E1334.
- Macfarlane DJ. Open-circuit respirometry: a historical review of portable gas analysis systems. Eur J Appl Physiol. 2017;117:2369–2386.
- Ross R, ALDuhishy A, González-Haro C. Validation of the cosmed K4b2 portable metabolic system during running outdoors. J Strength Cond Res. 2020;34(1):124–133.
- Roffey DM, Byrne NM, Hills AP. Day-to-day variance in measurement of resting metabolic rate using ventilated-hood and mouthpiece & nose-clip indirect calorimetry systems. JPEN J Parenter Enteral Nutr. 2006;30(5):426–432.
- Jeukendrup AE, Wallis GA. Measurement of substrate oxidation during exercise by means of gas exchange measurements. Int J Sports Med. 2005;26(1):28–37.
- Hulston CJ, Wallis GA, Jeukendrup AE. Exogenous CHO oxidation with glucose plus fructose intake during exercise. Med Sci Sports Exerc. 2009;41(2):357–363.
- Jentjens RLPG, Jeukendrup AE. High rates of exogenous carbohydrate oxidation from a mixture of glucose and fructose ingested during prolonged cycling exercise. Br J Nutr. 2005;93(4):485–492.
- Roberts JD, Tarpey MD, Kass LS, et al. Assessing a commercially available sports drink on exogenous carbohydrate oxidation, fluid delivery and sustained exercise performance. J Int Soc Sports Nutr. 2014;11(1):8.
- Tarpey MD, Roberts JD, Kass LS, et al. The ingestion of protein with a maltodextrin and fructose beverage on substrate utilisation and exercise performance. Appl Physiol Nutr Metab. 2013;38(12):1245–1253.
- González-Haro C. Concordance between 13 C:12 C ratio technique respect to indirect calorimetry to estimate carbohydrate and fat oxidation rates by means stoichiometric equations during exercise. A reliability and agreement study. Physiol Rep. 2019;7(8):e14053.
- Rosenkilde M, Nordby P, Nielsen LB, et al. Fat oxidation at rest predicts peak fat oxidation during exercise and metabolic phenotype in overweight men. Int J Obes (Lond). 2010;34(5):871–877.
- Rynders CA, Blanc S, DeJong N, et al. Sedentary behaviour is a key determinant of metabolic inflexibility. J Physiol. 2018;596(8):1319–1330.
- Waldman HS, Bryant AR, Knight SN, et al. Assessment of metabolic flexibility by substrate oxidation responses and blood lactate in women expressing varying levels of aerobic fitness and body fat. J Strength Cond Res. 2023;37(3):581–588.
- San-Millán I, Brooks GA. Assessment of metabolic flexibility by means of measuring blood lactate, fat, and carbohydrate oxidation responses to exercise in professional endurance athletes and less-fit individuals. Sports Med. 2018;48(2):467–479.
- Zdzieblik D, Friesenborg H, Gollhofer A, et al. Effect of a high fat diet vs. high carbohydrate diets with different glycemic indices on metabolic parameters in male endurance athletes: a pilot trial. Front Nutr. 2022;9:802374.
- Seo HC, Shin D, Leem CH, et al. Development of a portable respiratory gas analyzer for measuring indirect resting energy expenditure (REE). J Healthc Eng. 2021;2021:8870749.
- Guidetti L, Meucci M, Bolletta F, et al. Validity, reliability and minimum detectable change of COSMED K5 portable gas exchange system in breath-by-breath mode. PLoS One. 2018;13(12):e0209925.
- Tsekouras YE, Tambalis KD, Sarras SE, et al. Validity and reliability of the new portable metabolic analyzer PNOE. Front Sports Act Living. 2019;1:24.
- Rodbard D. Continuous glucose monitoring: a review of successes, challenges, and opportunities. Diabetes Technol Ther. 2016;18(Suppl2):S3–S13.
- Ramos-Jiménez A, Hernández-Torres RP, Torres-Durán PV, et al. The respiratory exchange ratio is associated with fitness indicators both in trained and untrained men: a possible application for people with reduced exercise tolerance. Clin Med Circ Respirat Pulm Med. 2008;2:1–9.
- Melzer K. Carbohydrate and fat utilization during rest and physical activity. e-SPEN. 2011;6(2):e45–e52.
- Lorenz KA, Yeshurun S, Aziz R, et al. A handheld metabolic device (Lumen) to measure fuel utilization in healthy young adults: device validation study. Interact J Med Res. 2021;10(2):e25371.
- Wijngaarden MA, Bakker LE, van der Zon GC, et al. Regulation of skeletal muscle energy/nutrient-sensing pathways during metabolic adaptation to fasting in healthy humans. Am J Physiol Endocrinol Metab. 2014;307(10):E885–E895.
- Terink R, Witkamp RF, Hopman MT, et al. A 2 week cross-over intervention with a low carbohydrate, high fat diet compared to a high carbohydrate diet attenuates exercise-induced cortisol response, but not the reduction of exercise capacity, in recreational athletes. Nutrients. 2021;13(1):157.
- Faul F, Erdfelder E, Lang A-G, et al. G*power 3: a flexible statistical power analysis program for the social, behavioral, and biomedical sciences. Behav Res Methods. 2007;39:175–191.
- Roberts JD, Willmott AGB, Beasley L, et al. The impact of decaffeinated green tea extract on fat oxidation, body composition and cardio-metabolic health in overweight, recreationally active individuals. Nutrients. 2021;13(3):764.
- Roberts J, Zinchenko A, Mahbubani KT, et al. Satiating effect of high protein diets on resistance-trained individuals in energy deficit. Nutrients. 2018;11(1):56.
- Furber M, Pyle S, Roberts M, et al. Comparing acute, high dietary protein and carbohydrate intake on transcriptional biomarkers, fuel utilisation and exercise performance in trained male runners. Nutrients. 2021;13(12):4391.
- Laaban JP, Lemaire F, Baron JF, et al. Influence of caloric intake on the respiratory mode during mandatory minute volume ventilation. Chest. 1985;87:67–72.
- Bessard T, Schutz Y, Jequier E. Energy expenditure and postprandial thermogenesis in obese women before and after weight loss. Am J Clin Nutr. 1983;38:680–693.
- Kelly KP, McGuinnes OP, Buchowski M, et al. Eating breakfast and avoiding late-evening snacking sustains lipid oxidation. PLoS Biol. 2020;18(2):e3000622.
- Hayashi K, Suekuni M, Sugiyama K. Effect of food intake on respiratory chemosensitivity to CO2 in young adults. J Physiol Anthro. 2019;38:8.
- Whitley HA, Humphreys SM, Campbell IT, et al. Metabolic and performance responses during endurance exercise after high-fat and high-carbohydrate meals. J Appl Physiol. 1998;85(2):418–424.
- Habas ME, Macdonald IA. Metabolic and cardiovascular responses to liquid and solid test meals. Br J Nutr. 1998;79:241–247.
- Efthimiou J, Mounsey PJ, Benson DN, et al. Effect of carbohydrate rich versus fat loads on gas exchange and walking performance in patients with chronic obstructive lung disease. Thorax. 1992;47:451–456.
- Gregory S, Wood R, Matthews T, et al. Substrate utilization is influenced by acute dietary carbohydrate intake in active, healthy females. J Sports Sci Med. 2011;10:59–65.
- Hall KD, Bemis T, Brychta R, et al. Calorie for calorie, dietary fat restriction results in more body fat loss than carbohydrate restriction in people with obesity. Cell Metab. 2015;22(3):427–436.
- Fried PI, McClean PA, Phillipson EA, et al. Effect of ketosis on respiratory sensitivity to carbon dioxide in obesity. N Engl J Med. 1976;294:1081–1086.
- Ravussin R, Beyl RA, Poggiogalle E, et al. Early time-restricted feeding reduces appetite and increases fat oxidation but does not affect energy expenditure in humans. Obesity. 2019;27:1244–1254.
- Rubini A, Bosco G, Lodi A, et al. Effects of twenty days of the ketogenic diet on metabolic and respiratory parameters in healthy subjects. Lung. 2015;193(6):939–945.
- Backhouse SH, Williams C, Stevenson E, et al. Effects of the glycemic index of breakfast on metabolic responses to brisk walking in females. Eur J Clin Nutr. 2007;61:590–596.
- Podlogar T, Debevec T. Effects of a 14-day high carbohydrate diet on exercise performance of a low-carbohydrate adapted athlete – case study. Kinesiol Slov. 2016;22(1):37–46.
- Bussotti M, Magrì D, Previtali E, et al. End-tidal pressure of CO2 and exercise performance in healthy subjects. Eur J Appl Physiol. 2008;103(6):727–732.
- Currell K, Jeukendrup AE. Superior endurance performance with ingestion of multiple transportable carbohydrates. Med Sci Sports Exerc. 2008;40(2):275–281.
- Coggan AR, Swanson SC. Nutritional manipulations before and during endurance exercise: effects on performance. Med Sci Sports Exerc. 1992;24(9 Suppl):S331–S335.
- Hargreaves M, Hawley JA, Jeukendrup A. Pre-exercise carbohydrate and fat ingestion: effects on metabolism and performance. J Sports Sci. 2004;22(1):31–38.
- Zinn C, Wood M, Williden M, et al. Ketogenic diet benefits body composition and well-being but not performance in a pilot case study of New Zealand endurance athletes. J Int Soc Sports Nutr. 2017;14:22.
- McSwiney FT, Wardrop B, Hyde PN, et al. Keto-adaptation enhances exercise performance and body composition responses to training in endurance athletes. Metabolism. 2018;81:25–34.
- Lightowler H, Schweitzer L, Theis S, et al. Changes in weight and substrate oxidation in overweight adults following isomaltulose intake during a 12-week weight loss intervention: a randomized, double-blind, controlled trial. Nutrients. 2019;11(10):2367.
- Klement RJ, Frobel T, Albers T, et al. A pilot case study on the impact of a self-prescribed ketogenic diet on biochemical parameters and running performance in healthy and physically active individuals. Nutr Med. 2013;1(1):10.
- Volek JS, Freidenreich DJ, Saenz C, et al. Metabolic characteristics of keto-adapted ultra-endurance runners. Metabolism. 2016;65(3):100–110.
- Buch A, Yeshurun S, Cramer T, et al. The effects of metabolism tracker device (Lumen®) usage on metabolic control in adults with prediabetes: pilot clinical trial. Obes Facts. 2023;16(1):53–61.