
ABSTRACT
Purpose
It is unclear whether resistance (RT) and concurrent training (CT; resistance plus endurance training) combined with different protein intakes have differential effects on muscle hypertrophy, strength, and performance. Therefore, we compared the effects of two high-protein diets (1.6 or 3.2 g.kg−1.d−1) during 16 weeks of either CT or RT alone in resistance-trained males.
Methods
Forty-eight resistance-trained males (age: 26 ± 6 yr, body mass index: 25.6 ± 2.9 kg.m−2) performed 16 weeks (four sessions·w−1) of CT or RT with either 1.6 g.kg−1.d−1 protein (CT1; n = 12; RT1; n = 12) or 3.2 g.kg−1.d−1 protein (CT2; n = 12; RT2; n = 12). Training adaptations were assessed pre-, mid-, and post-intervention.
Results
All measures of performance (endurance, vertical jump, and pull-up), lean mass, muscle strength, and power significantly increased post-intervention in all groups, but peak power gains were greater in RT2 compared with RT1 and CT1 (p < .05). VO2max significantly increased in both CT groups (p < .001). Select biochemical markers of kidney and liver function significantly increased within the RT2 and CT2 groups (p < .05), however, no between-group differences were apparent (p > .05).
Conclusions
With the exception of peak power, intake of 1.6 g.kg−1.d−1 of protein appears sufficient to maximize gains in lean mass, muscle strength, performance, and aerobic capacity during both RT and CT without influencing markers of kidney and liver function, indicating this daily protein amount is effective and safely tolerated in young, healthy adults.
Introduction
Physical performance in sports requires the integration of physiological, biomechanical, metabolic, psychological, nutritional, and training features. Athletic performance capability can be augmented following training programs incorporating resistance training (RT) and endurance training (ET). Resistance training is the most effective training method for improving anabolic-related adaptations (muscular strength, power, or endurance) in trained adults [Citation1]. On the contrary, ET can promote improvements in VO2max as well as increased cardiovascular health and function, and skeletal muscle oxidative capacity [Citation2,Citation3]. Considering training adaptations between ET and RT are largely divergent (and may be influenced by the type and participant’s characteristics), integrating both exercise modalities into a single training program is intuitively necessary to simultaneously maximize anabolic, metabolic, and oxidative adaptation responses. Concurrent training (CT) is generally characterized by the incorporation of RT and ET into the same training program. Previous studies have demonstrated that CT can augment muscle strength, anaerobic power, aerobic capacity, and maximal velocity contraction responses [Citation4–7]. Such adaptations are paramount for athletic populations involved in sports such as basketball, rowing, and rugby, which require anabolic, aerobic, and anaerobic-based adaptations for optimal performance [Citation8,Citation9]. In this respect, and in accordance with the specificity of exercise training principles, exercise modalities in a CT program are likely to rely on the biomechanics and energy systems of a particular athletic activity [Citation10].
Despite these positive adaptation responses with CT, several lines of evidence have reported attenuated increases in muscle strength, power, and hypertrophy with CT compared to RT performed in isolation, known as the “interference effect” [Citation10–15]. Such blunted anabolic training responses are inconsistently reported in the literature and can be dependent upon the training experience of participants, sequence/order of training bouts, and modes of exercise performed [Citation16–20]. Several suggested approaches to circumventing the interference effect have centered on extended recovery periods (i.e. 6–24 hours) between training sessions, performing cycling rather than running as ET, and incorporating post-exercise nutritional strategies [Citation21]. Regarding nutrition, numerous studies have observed enhanced muscular adaptations (i.e. strength, lean mass, or power) with protein ingestion (i.e. diet or supplements) in conjunction with RT [Citation1,Citation22–29]. In contrast, much less consideration has been directed toward the effects of protein intake on exercise adaptation responses with CT. We previously demonstrated similar increases in lean mass and muscle strength in recreationally active males following 12 weeks of RT in isolation (three sessions. w−1) and CT (six sessions. w−1) combined with a high protein diet (2 g.kg−1.d−1) [Citation4]. In contrast, select measures of lower body anaerobic power-based adaptations (Wingate) were attenuated with CT compared to RT in isolation, suggesting some training responses are still susceptible to the interference effect with CT and high dietary protein availability. Intriguingly, greater increases in lean mass (3.2 kg vs. 2.2 kg) were recently reported with higher protein intake (~2.2–2.4 g.kg−1.d−1) compared to ~1.0 g.kg−1.d−1 after three but not six months of CT in recreationally trained males [Citation30], suggesting the possibility for differences in daily protein availability to modulate adaptation responses with CT. Findings from a recent systematic review provide support for protein supplementation to enhance increases in skeletal muscle mass and strength/power with CT with the post-exercise intake of ~0.49 g/kg bodyweight high-quality protein purported to maximize post-exercise rates of myofibrillar protein synthesis in this context [Citation31].
A systematic review and meta-analysis by Morton and colleagues suggested 1.6 g.kg−1.d−1 protein was sufficient to maximize fat-free mass (FFM) gains following RT [Citation23]. In contrast, others have speculated that the minimal daily needs of dietary protein in trained individuals should be approximately 2 g.kg−1.d−1 [Citation29]. Notably, these daily protein suggestions are based on work incorporating RT only. Given greater energetic stresses inherent due to increased training volumes with CT compared to single-mode exercise training, it is possible that required dietary protein amounts are higher for CT [Citation32]. Therefore, to determine whether the potential interference effects of CT on lean mass, strength, and power adaptations can be attenuated, we investigated the effects of two protein diets well above the current recommended daily allowances ([RDAs], 1.6 or 3.2 g.kg−1.d−1) during 16 weeks of either CT or RT alone. We also sought to determine the effects of these high protein diets on muscular performance, maximal oxygen uptake (VO2max), biochemical markers of liver and kidney function, and potential associations between gains in lean mass with all muscular performances (strength, power, endurance, VO2max, vertical jump, and pull-up). Based on the currently available evidence, albeit from RT conducted in isolation [Citation23], we hypothesized that a daily protein amount of 1.6 g.kg−1.d−1 would be sufficient to maximize maximal strength, hypertrophy, performance, and power adaptations with CT compared to both the 3.2 g.kg−1.d−1 protein condition and RT. We speculate that the 1.6 g.kg−1.d−1 amount will provide sufficient availability of amino acids for muscle tissue to be utilized for all for required metabolic anabolic cellular processes to maximize adaptation responses despite the potential for RT to be conducted in a compromised energy state due to the concurrent performance of glycogen-depleting, ET-based exercise.
Methods
Participants
The present study recruited 48 young, healthy, resistance-trained males aged between 18 and 36 years via advertisements on social media. Interested participants were informed of the study and testing procedures either over the phone or in person at local gyms. By self-report, participants were required to submit a health and fitness history questionnaire, verifying their previous training background of three sessions per week with at least 1 year of RT experience (three to four sessions per week), sleeping for at least 7 to 8 hours during the 24-hour day, not taking any steroids or any illegal agents known to increase muscle size for the previous year, lower than ~1.6 g. kg−1.d−1 of protein ingestion, and being free from musculoskeletal disorders. Participants deemed eligible according to the criteria mentioned above provided written and verbal consent to participate. In addition, a medical history questionnaire was obtained when consenting, and participants were asked to return to complete the study procedures. The protocol was reviewed by the Institutional Human Subject Committee and the Ethics Committee of the University of Isfahan (IR.UI.REC.1400.098) and carried out in accordance with the Declaration of Helsinki. This study has been registered with the Iranian Registry of Clinical Trials (IRCT20191204045612N2).
Study design
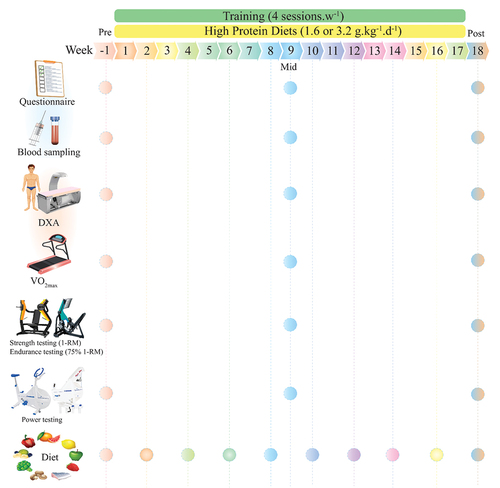
An overview of the study procedures is shown in . After baseline measurements (described subsequently), participants were familiarized with the study tests and procedures and randomly assigned to one of four groups using an online resource (www.randomizer.org): CT +1.6 g.kg−1.d−1 of protein (CT1; n = 12), CT +3.2 g.kg−1.d−1 of protein (CT2; n = 12), RT +1.6 g.kg−1.d−1 of protein (RT1; n = 12) or RT +3.2 g.kg−1.d−1 of protein (RT2; n = 12). Our original intent regarding the length of this study was six months; however, due to the Coronavirus Disease 2019 (COVID-19) pandemic, we voluntarily decided to end the study at 16 weeks. Therefore, measurements were collected at baseline, week 9, and week 18 (i.e. two weeks post-training intervention) during the same time of day (−1 hour). Participants first completed four preliminary testing days: on the first visit, questionnaires were assessed; on the second visit, blood draw and body composition were performed; on the third visit, VO2max and performance tests were performed; on the fourth visit, participants completed chest and leg press one-repetition maximum (1-RM), muscular endurance tests (75% 1-RM), and muscular power. After performing these tests, participants met the study dietitian for an introductory consultation to discuss food preferences as well as target protein and energy intakes prior to the initiation of training programs. To assess sleep quality and health status, the Pittsburgh Sleep Quality Index (PSQI) and the General Health Questionnaire-28 (GHQ-28) were used, respectively [Citation33]. All mentioned procedures were performed in exactly the order for all time measurements.
Figure 1. Schematic overview of study timeline.
Anthropometry and body composition
Participants were asked to report to the laboratory hydrated after an overnight fast, with a 24-hour dietary recall collected before testing. Participants were instructed to void completely within 30 minutes of the test to minimize hydration status errors and advised to refrain from caffeinated beverages, alcohol, and other diuretics 12 hours prior to measurements. Participants’ body mass and height were measured with a digital scale (Lumbar, China) to the nearest 0.1 kg and a stadiometer (Race industrialization, China) to the nearest 0.1 cm, respectively. Total lean mass, body fat percentage (BFP), and estimated visceral adipose tissue (VAT) were assessed using whole-body dual-energy x-ray absorptiometry (DXA; Hologic, Discovery, Wi [S/N 93,045 M]). Briefly, participants were asked to lay supine on the DXA examination table wearing shorts for approximately 7 minutes while a low dose of radiation scanned their entire body. For DXA measurements, previous test re-test reliability in our laboratory is as follows: BFP intraclass correlation coefficient (ICC) = 0.998; coefficient of variation (CV): <1%; lean mass: ICC = 1.00; CV: <1%. All DXA scans were conducted by the same technician, analyzed with the image compare mode for serial examination software feature (Hologic APEX software, version 4.5.3.2), and followed strict manufacturer guidelines for calibration and testing procedures as per the formerly published study [Citation34].
Maximal strength testing
Maximal strength was determined using 1-RM for plate-loaded leg press and chest press. This testing (1-RM) also was performed to determine training intensity for RT protocols. Before the beginning of the test, the researchers explained the purpose, attendant risks, discomforts, responsibilities of the participant, benefits, inquiries, and freedom of consent. Participants were instructed to refrain from alcohol for 48 hours, caffeinated drinks for 12 hours, and food intake for 2 hours before the testing session; however, water consumption was allowed. Participants performed a general 10 min warm-up (5 min slow running on a treadmill; 3–5 km speed, or elliptical; with 5–10 level) and specific warm-up activities (5 min, e.g. medicine ball twist 1 × 10, medicine ball wood chops 1 × 10, straddled toe touch 2 × 5, dynamic quadriceps stretch 1 × 5, medicine ball squat 1 × 5–8) before the test. The participants then performed two attempts, recording their highest lifted weight and number of repetitions. The number of repetitions to fatigue did not exceed 10. Participants were allowed 3 to 5 minutes rest periods between attempts, and there was no arousing stimulus during testing. After the testing session, participant’s maximal strength was predicted using the formula: 1-RM= weight/(1.0278–0.0278×reps) [Citation21]. Chest and leg press exercises were used as upper and lower body strength measures, and 1-RM was used to determine individualized RT prescription.
Muscular endurance
The participants rested for 5 minutes after the 1-RM testing prior to completing the muscular endurance test in the morning (9:00–10 a.m.). Participants were instructed to perform leg- and chest press exercises at 75% of the 1-RM to test muscular endurance, denoted as the number of successful repetitions completed prior to technical failure [Citation34].
Training volume
RT volume was calculated using the following formula in each session and was reported weekly [Citation35]:
Resistance training volume = [repetitions (n) × sets (n) × load or selected weight (kg)].
Endurance training volume was calculated using the following formula: Total ET volume: [work + rest].
Work: [Intensity × maximum aerobic power (MAP) × (set × duration [as noted in training protocol] × 0.06)].
Rest: [Intensity × MAP × (set × duration [as noted in training protocol] × 0.06)].
Intensity: percent of MAP; Set: number of repetitions of each session; Duration: spent time (minutes); 0.06: Convert watts to kilojoules
Muscular power
Upper- and lower-body anaerobic power was assessed via Monark Wingate cycle ergometry (Monark model 894e, Vansbro, Sweden) as previously described [Citation4,Citation36]. Briefly, participants were acquainted with the test and instructed to stay seated in the saddle for the test duration. Participants cycled or cranked against a pre-determined resistance (7.5% of body mass for the lower body test and 5.5% for the upper body test) as fast as possible for 30 seconds. Participants were verbally encouraged to pedal as hard and fast as possible throughout the whole 30 seconds test. Peak power output was documented in real-time during the test using Monark Anaerobic test software (3.3.0.0).
Performance testing
Maximal vertical jump height and total pull-ups (1 set) were assessed. Each participant generally performed the following warm-up: a 5-min run/bike on a treadmill or cycle ergometer at a self-directed leisurely pace followed by a dynamic warm-up consisting of 10 yards each of high knees, butt kicks, side shuffles, and karaoke running drill, and finally ten pushups and ten bodyweight squats. Participants then rested for 2–3 min prior to commencing the performance tests. Subsequently, the following tests were performed in the order given: vertical jump – highest value with a maximum number of three attempts; pull-ups – highest repetitions with a maximum number of three attempts. For both tests, there was a rest interval of approximately 60–180 seconds.
VO2max testing
Briefly, the participants performed an Ekblom-Bak (EB) test with a constant pedal frequency of 60 revolutions per min (rpm). The protocol of the EB test is described in detail elsewhere [Citation37,Citation38]. The test started with 4 min of cycling at the standard work rate with a resistance of 0.5 kiloponds (kp), ~ 30 watts (W). The second submaximal work rate was individually chosen to obtain a rating of perceived exertion (RPE) of ~14 and the test was terminated if the participant rated a perceived exertion higher than 16 [Citation37]. The selection of the higher work rate was based on the participants’ self-reported physical status and training habits. HR and VO2 were recorded as the mean at the last minute for each work rate. The estimated VO2max was calculated using the sex-specific EB prediction equations, previously shown to have good validity and reliability in mixed populations [Citation38,Citation39]. The test was conducted on a Monark cycle ergometer model 828E (Monark Exercise AB, Vansbro, Sweden).
Blood tests
Fasting blood samples (5 ml) were taken from the cubital vein using standard procedures following an 8-hour overnight fast at the same time of day (8:00–9:00 a.m.) in pre, mid, and post-testing. Blood samples were centrifuged at 1000 g at 4°C for 15 min, with aliquots of serum frozen in liquid N2 and stored at − 80°C before analysis. Liver enzymes (alanine transaminase [ALT; intra-assay CV: 1.81%; inter-assay CV: 2%]), aspartate aminotransferase [AST; intra-assay CV: 2.01%; inter-assay CV: 2.54%], and gamma-glutamyl transferase [GGT; intra-assay CV: 1.56%; inter-assay CV: 0.92%], creatinine [intra-assay CV: 1.60%; inter-assay CV: 2.24%], and Urea Nitrogen (BUN) [intra-assay CV: 2.20%; inter-assay CV: 3.36%] were measured in serum. Liver and kidney function markers were measured in duplicates using Pars Azmoon kits and the spectrophotometric method (DiaSys Diagnostic Systems GmbH, Germany). These were performed after 48 hours of rest.
Resistance training
Participants in the two RT groups performed four sessions/week (Saturday, Monday, Wednesday, and Thursday) involving a supervised, linear periodized training program comprising two upper and two lower-body sessions each week. Prior to each RT session, participants performed 10 minutes of general (5 min slow running on a treadmill; 3–5 km speed, or elliptical; with 5–10 level) and specific warm-up activities (5 min, e.g. medicine ball twist 1 × 10, medicine ball wood chops 1 × 10, straddled toe touch 2 × 5, dynamic quadriceps stretch 1 × 5, medicine ball squat 1 × 5–8). Participants then completed an upper-body RT program consisting of seven exercises (chest press, lateral pulldown, standing barbell shoulder press, standing shoulder shrugs, bicep curl, triceps press down, and abdominal crunch) 2×/wk and six exercises of lower-body RT program (45-degree leg press, back squats, seated leg curl, Barbell hip thrusts, back extension, and calf raises) performed for 2×/wk. Participants performed three sets of 12 repetitions with 75% of 1-RM for weeks 1–4, 3 sets of 10 repetitions with 80% of 1-RM for weeks 5–8, 4 sets of 8 repetitions with 85% of 1-RM for weeks 9–12, and 4 sets of 6 repetitions with 90% of 1-RM for weeks 13–16. Rest intervals between exercises and sets lasted no longer than 2 minutes [Citation40]. The periodized RT program was based on our previous work [Citation40] and following recommendations by the National Strength and Conditioning Association [Citation41]. Participants were provided verbal encouragement and feedback during and after each set. Training data for each participant were logged, permitting us to guarantee that training effort was maximized within each training session and that participants successfully implemented progressive overload in an individualized fashion. In addition, study personnel supervised all training throughout the study. A detailed outline can be found in .
Table 1. Resistance training program.
Concurrent training
Participants in the two CT groups performed four sessions/week (Saturday, Monday, Wednesday, and Thursday) comprising RT at the beginning of the session, followed by ET as an exercise order sequence recommended [Citation42] to minimize possible interferences in muscle anabolism. Prior to each CT session, participants performed 10 minutes of general (5 min slow running on a treadmill; 3–5 km speed, or elliptical; with 5–10 level) and specific warm-up activities (5 min, e.g. medicine ball twist 1 × 10, medicine ball wood chops 1 × 10, straddled toe touch 2 × 5, dynamic quadriceps stretch 1 × 5, medicine ball squat 1 × 5–8). Participants then undertook the same RT program as described above. Immediately following the completion of RT, participants then performed endurance cycle training on ergometers that consisted of a mixture of hill simulation rides of varying intensities (25–110 of MAP), moderate-intensity continuous training at 50% MAP, moderate-intensity interval training (MICT) at 70% MAP, and high-intensity interval training (HIIT) at 100% MAP. Moderate-intensity intervals were separated by a 60-s recovery period at ~ 40% MAP to establish a 2.5:1 or 5:1 work-to-rest ratio. High-intensity intervals were separated by 20- to 60-s recovery periods, completed at ~ 40% MAP, to establish a 1:5, 1:2, or 1:1 work-to-rest ratio. All cycling sessions were preceded by 3–5 min of cycling at ≤50 W. Progressive overload was applied by manipulating the number of intervals and relative intensity of load throughout. A detailed outline can be found in .
Table 2. A. Overview of 16-week endurance training program. B. the detailed endurance training program.
Diet
Participants completed six 24 h dietary logs (4 nonconsecutive weekdays and 2 nonconsecutive weekend days) to determine habitual protein intakes. To assist in achieving their targeted protein intake (i.e. 1.6 or 3.2 g.kg−1.d−1), participants consumed a 40 g of isolated whey protein (Wisser nutrition, Iran) beverage upon cessation of every training session that comprised the following nutrition profile per scoop (28 g): calories,110; total fat, 0.5 g; saturated and trans-fat, sugars, and dietary fiber, 0 g; sodium, 50 mg; potassium, 112 mg; total carbohydrate, 2 g; protein, 24 g. Other remaining protein quantities were consumed via foods, and habitual dietary protein intake remained stable throughout the intervention for all groups.
Our rationale for implementing the 1.6 g.kg−1.d−1 protein group was based on the previously mentioned work by Morton et al. (2018), where this daily amount was recommended to maximize FFM gains following RT [Citation23]. As no study has currently investigated the effects of protein availability above 2–2.2 g.kg−1.d−1 on training adaptation responses with CT, we sought to ensure there was a clear difference in the amount of protein intake between groups. Thus, we chose to double the 1.6 g.kg−1.d−1 amount for the comparison high protein group (i.e. 3.2 g.kg−1.d−1) while also ensuring this amount can be safely tolerated. In support, previous work by Antonio and colleagues demonstrated this amount (~2.51–3.32 g.kg−1.d−1) to exert no harmful effects on liver and kidney function markers [Citation43].
Participants attended consultations with an accredited practicing dietitian every two weeks, where they were provided guidelines to reach protein and energy needs, including the distribution of protein intake throughout the day across 4–7 meals with 20–40 g of protein per meal to maximize muscle protein synthesis (MPS) [Citation44,Citation45]. Macronutrient composition was supervised during the study, with total energy intake (TEI) and protein intake a focus. Carbohydrate and fat intake were suggested to be within the Acceptable Macronutrient Distribution Range for these macronutrients (45–65% and 20–35% TEI for carbohydrate and fat, respectively). Participants were asked to remain in a positive energy balance to alleviate any potential of energetic stress-related interferences to anabolic adaptations [Citation46,Citation47]. Food records were kept daily by participants throughout the study using mobile phone applications Easy Diet Diary (Xyris Software Pty Ltd, AUS, for those with iPhones, Apple Inc, USA; n = 18) and My Fitness Pal (MyFitnessPal Inc., USA) for those with Android-based devices; n = 26). All dietary intake data were analyzed using (Diet Analysis Plus, version 10; Cengage) to ensure the same food database was used for all analyses.
Statistical analysis
The sample size was calculated using PASS.15 software in which an F test, repeated measures, and within-between interaction ANOVA revealed that 40 participants were needed to detect a medium effect (Cohen’s f = 0.25) with a significance level of α = 0.05 and 80% power for changes in muscular strength (the primary outcome of this study) post-exercise training intervention [Citation4]. We recruited 20% more participants (n = 8, 2 for each group) due to potential dropouts. The normality of the distribution of all variables was evaluated before performing statistical analyses using the Shapiro – Wilk test; there were no missing values at any time point. Baseline characteristics (at PRE) between groups were reported using mean (SD). Effects of training and nutritional interventions on dependent variables were analyzed using a three × four analysis of variance (ANOVA) with repeated measures (time [pretest vs. mid-test vs. posttest] × group [CT1 vs. CT2 vs. RT1 vs. RT2]) to determine the differences between the treatments over time. When the group-by-time interaction was significant, we used Generalized Estimation Equation (GEE) analysis to determine between-group differences. Analysis of covariance (ANCOVA) was used to assess the changes between pretest and during-intervention nutrient intakes. Cohen’s d effect size (ES) was calculated as post‐training mean minus pre‐training mean/pooled pre‐training standard deviation means [Citation48]. All analyses were performed using R (version 4.1.2), and figure production was performed using GraphPad Prism (version 8.4.3) and R software (version 4.1.2).
Results
Participant characteristics
One hundred and twelve participants were assessed for eligibility. Twenty-eight did not meet the inclusion criteria, while 36 were not interested in participating after the first interview (). One participant from each group (due to lack of time, not being interested, COVID-19, or musculoskeletal injury) withdrew from the study. There were no significant between-group differences in all baseline characteristics (). There were no differences between groups for PSQI (p = 0.923), GHQ-28q (p = 0.421), or training experience (p = 0.475).
Figure 2. The flow of participant recruitment.
Table 3. Baseline characteristics of the participants.
Body composition
Changes in body composition throughout the intervention are shown in and Supplementary Tables S4A and B. There was a significant main effect of time for body mass (p < 0.001), BMI (p < .001), lean mass [(p < .001), ()], BFP [(p = .001), ()], and VAT [(p = 0.022), ()]. Body mass and BMI significantly increased from pre to post by 2.2% in RT1 (p = 0.026) and 2.4% in RT2 (p = .022). Lean mass significantly increased from pre to post by 3% in CT1 (p < .001), 3.8% in CT2 (p = .002), 3.5% in RT1 (p = .004), and 4% in RT2 (p < .001). BFP significantly decreased from pre to post by 9% in CT1 (p = .001). VAT significantly decreased from pre to post by 16.4% in CT1 (p = .043).
Figure 3. Effects of resistance or concurrent training in combination with high protein diets on body composition. a) lean mass (kg), b) body fat percentage (BFP), and c) estimated visceral adipose tissue (EST.VAT mass [g]). n=11 per group, error bars represent 95% confidence interval (CI), and p-values above time points indicate paired sample t-test results. CT1, concurrent training + 1.6 g.kg−1.d−1; CT2, concurrent training + 3.2 g.kg−1.d−1; RT1, resistance training + 1.6 g.kg−1.d−1; RT2, resistance training + 3.2 g.kg−1.d−1.
![Figure 3. Effects of resistance or concurrent training in combination with high protein diets on body composition. a) lean mass (kg), b) body fat percentage (BFP), and c) estimated visceral adipose tissue (EST.VAT mass [g]). n=11 per group, error bars represent 95% confidence interval (CI), and p-values above time points indicate paired sample t-test results. CT1, concurrent training + 1.6 g.kg−1.d−1; CT2, concurrent training + 3.2 g.kg−1.d−1; RT1, resistance training + 1.6 g.kg−1.d−1; RT2, resistance training + 3.2 g.kg−1.d−1.](/cms/asset/b242f979-16c6-478d-a680-7a9540deeae1/rssn_a_2236053_f0003_oc.jpg)
Performance
Changes in performance throughout the intervention are shown in as well as Supplementary Tables S5A and B.
Figure 4. Effects of resistance or concurrent training in combination with high protein diets on muscular performance. a) Absolute chest press strength (kg), b) Chest press endurance (r), c) Absolute leg press strength (kg), d) Leg press endurance (r), e) Absolute upper body power (w), f) Absolute lower body power (w), g) Vertical jump (cm), h) Pull-up (r), and I) VO2max (ml−1.kg−1.min−1). n = 11 per group, error bars represent 95% confidence interval (CI), and p-values above time points indicate paired sample t-test results. CT1, concurrent training + 1.6 g.kg−1.d−1; CT2, concurrent training + 3.2 g.kg−1.d−1; RT1, resistance training + 1.6 g.kg−1.d−1; RT2, resistance training + 3.2 g.kg−1.d−1.
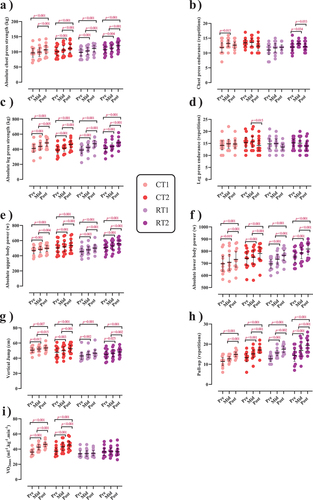
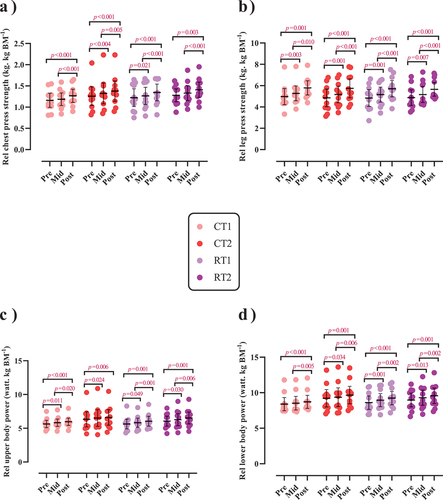
Figure 5. Effects of resistance or concurrent training in combination with high protein diets on relative upper and lower body strength and power. a) Relative chest press strength (kg. kg BM−1), b) Relative leg press strength (kg. kg BM−1), c) Relative upper body power (watt. kg BM−1), and d) Relative lower body power (watt. kg BM−1). n=11 per group, error bars represent 95% confidence interval (CI), and p-values above each time points indicate paired sample t-test results. CT1, concurrent training + 1.6 g.kg−1.d−1; CT2, concurrent training + 3.2 g.kg−1.d−1; RT1, resistance training + 1.6 g.kg−1.d−1; RT2, resistance training + 3.2 g.kg−1.d−1.
Muscular strength
There was a significant main effect of time for both absolute [(p < .001), ()] and relative chest press strength [(p < .001), )] as well as for both absolute (p < .001; ) and relative leg press strength (p < .001; ). Absolute chest press strength significantly increased from pre to post by 11.2% in CT1 (p < .001), 10.4% in CT2 (p < .001), 13.4% in RT1 (p < .001), and 12.1% in RT2 (p < .001). Relative chest press strength significantly increased from pre to post by 10% in CT1 (p < .001), 9.5% in CT2 (p < .001), 11% in RT1 (p < .001), and 10.1% in RT2 (p = .003). Absolute leg press strength significantly increased from pre to post by 19.6% in CT1 (p < .001), 20.3% in CT2 (p < .001), 22.3% in RT1 (p < .001), and 20% in RT2 (p = .001). Relative leg press strength significantly increased from pre to post by 18.3% in CT1 (p < .001), 19.3% in CT2 (p < .001), 19.7% in RT1 (p < .001), and 17.7% in RT2 (p < .001). No between-group differences were observed.
Muscular endurance
There was a significant main effect of time for chest press [(p = .020), ()], and leg press endurance (p = .022; ). Chest press endurance significantly increased from pre to mid by 14.9% in CT1 (p = .015) and 11.8% in RT2 (p = 0.034) while significantly decreasing from mid to post by 7.6% in RT2 (p = .033). Leg press endurance significantly decreased from mid to post by 8.9% in CT2 (p = .015). No between-group differences were observed.
Muscular power
There was a significant group-by-time interaction for absolute upper-body power (p = .009; )] and absolute lower-body peak power [(p < .001; )]. The increase of absolute lower body power in RT2 was significantly greater (0.1%) than in RT1 (p = .044). This was also observed for absolute lower body power (p = .033) and compared to CT1 [3.6%, (p = .034)]. Regarding relative values, there was a significant main effect of time for both relative upper and lower body power (p < .001; , respectively). Relative upper body power significantly increased from pre to post by 5.9% in CT1, 4.4% in CT2, 7.5% in RT1, and 7.4% in RT2 [(p < .01; )]. Relative lower body power significantly increased from pre to post by 4.5% in CT1, 3.7% in CT2, 7.6% in RT1, and 6.3% in RT2 [(p < .01; )].
Muscular performance
There was a significant main effect of time for vertical jump (p < .001; ) and pull-up (p < .001; )]. Vertical jump significantly increased from pre to post by 5.9% in CT1 (p = .007), 10.7% in CT2 (p < .001), 8.7% in RT1 (p = .001), and 8.3% in RT2 (p < .001). Pull-up significantly increased from pre to post by 38% in CT1 (p < .001), 33.1% in CT2 (p < .001), 38.4% in RT1 (p < 0.001), and 41.6% in RT2 (p < .001). There was a significant group-by-time interaction for VO2max [(p < .001), ()]. The increase in VO2max in CT1 was significantly greater (26.94%) than in RT1 (p < .001) and RT2 (28.69%, p = .045). In addition, the increase in CT2 was significantly greater (20.46%) than in RT1 (p = .004).
Biochemical markers
Changes in biochemical markers throughout the intervention are shown in and Supplementary Tables S6A and B.
Figure 6. Effects of resistance or concurrent training in combination with high protein diets on markers of liver and kidney function. a) gamma-glutamyl transferase (GGT [(u/l)]), b) Aspartate transaminase (AST [(u/l)]), c) Alanine transaminase (ALT [(u/l)]), d) Urea (mg/dl), and e) Creatinine (mg/dl). n=11 per group, error bars represent 95% confidence interval (CI), and p-values above each time points indicate paired sample t-test results. CT1, concurrent training + 1.6 g.kg−1.d−1; CT2, concurrent training + 3.2 g.kg−1.d−1; RT1, resistance training + 1.6 g.kg−1.d−1; RT2, resistance training + 3.2 g.kg−1.d−1.
![Figure 6. Effects of resistance or concurrent training in combination with high protein diets on markers of liver and kidney function. a) gamma-glutamyl transferase (GGT [(u/l)]), b) Aspartate transaminase (AST [(u/l)]), c) Alanine transaminase (ALT [(u/l)]), d) Urea (mg/dl), and e) Creatinine (mg/dl). n=11 per group, error bars represent 95% confidence interval (CI), and p-values above each time points indicate paired sample t-test results. CT1, concurrent training + 1.6 g.kg−1.d−1; CT2, concurrent training + 3.2 g.kg−1.d−1; RT1, resistance training + 1.6 g.kg−1.d−1; RT2, resistance training + 3.2 g.kg−1.d−1.](/cms/asset/1d1fbb5c-ef8e-45bd-8113-a52a1ff97e10/rssn_a_2236053_f0006_oc.jpg)
Liver function
There was a significant main effect of time for GGT (p < .001; ), AST (p < .001; ), and ALT (p < .001; ). GGT significantly increased from pre to post by 39.7% in CT2 (p = .001) and 26.8% in RT2 (p = .033). AST significantly increased from pre to post by 49.2% in CT2 (p = .003) and 39.4% in RT2 (p = .017). ALT significantly increased from pre to post by 41.1% in CT2 (p = .031) and 30.6% in RT2 (p = .005). There were no changes for any marker in CT1 and RT1 over time (p > .05).
Kidney function
There was a significant main effect of time for urea (p = 0.003; ) and creatinine (p < .001), ). Urea significantly increased from pre to post by 44.3% in CT2 (p = .016) and 35.5% in RT2 (p = .004). Creatinine significantly increased from pre to post by 28% in CT2 (p = .007) and 21.1% in RT2 (p = .009). There were no changes for any marker in CT1 and RT1 over time (p > .05).
Dietary assessments
Average dietary intakes at baseline and throughout the intervention are presented in . There was no significant difference between groups at baseline for any average daily nutrient and energy intake (p > .05). Energy intake increased by 20% in CT2 (p < .001) and 19% in RT2 from baseline (p = .023). ANCOVA indicated that energy intake in CT1 (123.49 ± 14.50 kJ.kg−1.d−1) was significantly lower than in CT2 (144.37 ± 22.41 kJ.kg−1.d−1; p = .003) and RT2 (137.36 ± 15.39 kJ.kg−1.d−1; p = .041). In addition, energy intake in CT2 (144.37 ± 22.41 kJ.kg−1.d−1) was significantly greater than in RT1 (124.69 ± 12.36 kJ.kg−1.d−1; p = .002). Protein intake increased from baseline by 84.6% in CT1 (p = .001), 216.1% in CT2 (p < .001), 45.3% in RT1 (p = .005), and 206.6% in RT2 (p < .001). Protein intake in CT1 (1.62 ± 0.022 g.kg−1.d−1) was significantly lower than in CT2 (3.29 ± 0.100 g.kg−1.d−1) and RT2 (3.25 ± 0.064 g.kg−1.d−1; p < .001) while protein intake in RT1 (1.63 ± 0.031 g.kg−1.d−1) was significantly lower than in RT2 (3.25 ± 0.064 g.kg−1.d−1; p < .001)). Fat and carbohydrate intake did not significantly change from baseline in any group (p > .05).
Table 4. Average dietary intake at baseline and throughout the 16-week training intervention.
Training volume
Changes in training volume throughout the intervention are shown in . There was a significant main effect of time for upper body and lower body RT volume (p < .001; , respectively). Upper body RT volume significantly decreased from weeks 1–4 to weeks 13–16 by 19.6% in CT1 (p < .001), 15.4% in CT2 (p < .001), 10.6% in RT1 (p < .001), and 12.3% in RT2 (p = .001). Moreover, lower body RT volume significantly decreased from weeks 1–4 to weeks 13–16 by 25.3% in CT1 (p < .001), 24.8% in CT2 (p < .001), 26.1% in RT1 (p < .001), and 25.2% in RT2 (p < .001). However, there was no significant main effect of time for ET volume in either CT1 or CT2 groups (p = .245; ).
Figure 7. Effects of resistance or concurrent training in combination with high protein diets on training volume. a) Upper body resistance training volume (UBRT volume [kg.Kg BM −1]), b) Lower body resistance training volume (LBRT volume [kg.Kg BM −1]), and c) Endurance training volume (ET volume [kj. Kg BM−1]). CT1, concurrent training + 1.6 g.kg−1.d−1; CT2, concurrent training + 3.2 g.kg−1.d−1; RT1, resistance training + 1.6 g.kg−1.d−1; RT2, resistance training + 3.2 g.kg−1.d−1.
![Figure 7. Effects of resistance or concurrent training in combination with high protein diets on training volume. a) Upper body resistance training volume (UBRT volume [kg.Kg BM −1]), b) Lower body resistance training volume (LBRT volume [kg.Kg BM −1]), and c) Endurance training volume (ET volume [kj. Kg BM−1]). CT1, concurrent training + 1.6 g.kg−1.d−1; CT2, concurrent training + 3.2 g.kg−1.d−1; RT1, resistance training + 1.6 g.kg−1.d−1; RT2, resistance training + 3.2 g.kg−1.d−1.](/cms/asset/6f9d8605-97b3-4fed-9428-7f028e36efed/rssn_a_2236053_f0007_oc.jpg)
Discussion
We report that CT, when performed 4 d.wk−1 on alternate days combined with two different high protein diets, does not compromise gains in muscular strength, absolute upper body power, or lean mass compared to RT alone combined with high protein diets. Furthermore, only CT induced significant increases in VO2max post-intervention. In contrast, there was attenuation in absolute lower body power post-intervention in CT1 when compared to RT2 but not RT1. Overall, these observations present novel information regarding nutrition practices for maximizing muscle lean mass, strength, performance, and power adaptations with CT.
Muscle strength and power adaptations
The first major finding from our current work was that gains in strength and absolute upper body power increased similarly in all exercise training and dietary protein groups, indicating that these adaptation responses were not impaired with CT compared to RT. In contrast, increases in absolute lower body power with RT2 were significantly greater than CT1. In his classical work in the 1980s, Hickson showed ET to attenuate maximal strength development in a CT program [Citation49], although subsequent studies with a considerably lower total training volume have reported no interference in maximal strength with CT [Citation14,Citation50,Citation51]. A systematic review and meta‑analysis of 27 studies in 2021 found that CT exclusively impairs lower-body maximal strength development in trained, but not moderately trained or untrained, individuals [Citation52]. Moreover, this attenuation in strength for trained individuals was more pronounced when CT sessions were undertaken within the same session compared to different/separate sessions with an extended recovery between exercise bouts [Citation52]. In contrast, an updated systematic review and meta‑analysis reported no interference in the development of maximal strength with CT compared to strength training in isolation, independent of individual training history/status [Citation19]. Participants in our study possessed previous RT experience (i.e. performing three sessions per week for at least one year). Such training experience/status has been theorized to increase the likelihood of interference in strength development compared to untrained cohorts due to a lower potential for strength adaptations with CT, meaning even a small interference effect would then be sufficient to reduce strength development adaptation in trained individuals similar to those in our study [Citation11]. Nonetheless, and perhaps more confounding in our study design, was that the individual exercise sessions comprising our CT program were undertaken immediately after each other with no recovery period. Both acute and accumulated fatigue induced by ET can decrease the volume or intensity of RT undertaken [Citation53,Citation54], particularly if the ET component of CT involves self-regulated high-intensity ET. Robineau and colleagues previously reported that increases in maximal strength for bench press and half squat were significantly reduced when strength and ET were performed within the same session (i.e. one session immediately after the other) compared to either a 6- or 24-h recovery interval between training sessions in a trained cohort [Citation55]. Interestingly, RT sessions were always performed before ET in that study, which was the same exercise order as in our current work. In addition to acknowledged differences in participant characteristics, exercise training variables (i.e. sets, repetitions, exercise duration), and training length (7 versus 16 weeks) between our current study and work by Robineau et al. [Citation55], another key difference was the high dietary protein component of our study. We speculate the high protein availability with both CT groups in our study may have played a role in the similar maximum strength responses between CT and RT through the established capacity for dietary protein to support and augment skeletal muscle remodeling during post-exercise recovery [Citation56]. In support, a systematic review, meta-analysis, and meta-regression by Morton and coworkers demonstrated protein supplementation (1.6 g.kg−1.d−1) to enhance RT-induced increases in 1-RM strength in trained (and untrained) individuals [Citation23]. Additionally, within a CT setting, higher protein availability (~2 g.kg−1.d−1) has been shown to promote greater increases in upper-body 1-RM strength (i.e. bench press) compared to lower protein intake (~1 g.kg−1.d−1) over 8 [Citation57] and 12 [Citation58] weeks. However, not all studies have reported further beneficial gains in maximum strength following CT with increased protein intake [Citation7,Citation59]. Furthermore, there was no comparison in strength adaptations between CT and an RT-only condition in work by Robineau and colleagues, precluding the possibility that gains in muscle strength may still have been similar (i.e. no interference) between CT with no recovery period between sessions and RT performed in isolation. Considering the limited number of studies into this area, future studies investigating the capacity for different amounts of daily protein intake to augment maximum strength adaptations with CT involving different recovery lengths between RT and ET are required to provide more insight in this area.
In contrast to changes in maximum strength, increases in absolute lower body peak power were significantly reduced with CT1 compared to RT2 as measured by Wingate cycle ergometry. While this attenuation in absolute lower body peak power was not apparent with the CT2 group, we have previously reported blunted responses in relative Wingate peak power output with CT compared to RT only in conjunction with a diet providing 2 g.kg−1.d−1 of protein [Citation4]. The capacity for CT to compromise explosive muscular power but not maximum strength adaptations (as observed in our past and current work) is in agreement with findings reported by Schumann and colleagues from their recent systematic review and meta‑analysis [Citation19]. Subgroup analysis from this work further showed this reduced development in explosive strength/power with CT to be further compounded if RT and ET modes were performed within the same session compared to if separated by at least three hours of recovery. The basis for this is theorized to result from residual fatigue induced by the ET component of CT affecting neural input to the motor neurons innervating working leg muscle groups before force generation, thus reducing rapid force output [Citation19]. Altered pennation angle and fascicle length adaptations [Citation60], muscle shortening velocity [Citation61], and muscle fiber type changes [Citation62] have also been implicated in dampened muscle power adaptations with CT compared to RT only. Based on previous reviews suggesting more beneficial lower strength adaptations [Citation63,Citation64], RT was performed before the ET component of the CT program in our current study. In theory, this sequential order reduces the likelihood of residual fatigue from ET impairing muscle power adaptation responses with the RT component of a CT session. However, the work by Schumann and colleagues indicates that attenuation in muscle power responses with CT is more related to the close proximity of exercise sessions compared to the exercise order per se [Citation19].
Body compositional changes
Post-intervention gains in lean mass were similar between CT and RT groups regardless of daily dietary protein intake. These results support our earlier work over 12 weeks, where similar increases in total and leg lean mass were observed post-intervention between CT and RT groups with a high protein diet of 2 g.kg−1.d−1 [Citation4]. Previous studies have observed significantly higher increases in FFM or lean mass following CT with protein intakes of ~ 2.1–2.3 g.kg−1.d−1 compared to ~1.1 g.kg−1.d−1 [Citation30,Citation65,Citation66]. These findings collectively indicate a beneficial effect of increased protein intake with CT compared to levels marginally above the current RDA. In further support, a recent systematic review investigating the effects of dietary protein supplementation on longer-term changes in muscle mass with CT identified five of a total of nine studies to enhance post-intervention changes in either lean or FFM following CT with increased protein availability [Citation31]. However, a limitation of many of these studies was that there was no comparison to an RT-only group to ascertain whether these increases in lean mass with CT were of a similar or different (i.e. greater or lower) magnitude. Moreover, the daily protein intakes of these studies were no higher than ~2.2 g.kg−1.d−1, raising the question of whether daily protein intake above this level may further increase muscle mass. Results from several studies have also shown no further benefit to increases in muscle mass following CT with higher daily protein intakes [Citation58,Citation59,Citation67,Citation68]. Several interrelated factors may explain this finding, including older age and potentially associated anabolic resistance [Citation58,Citation59], insufficient RT volume [Citation58,Citation59], and inclusion of participants with obesity [Citation67,Citation68] that may specifically relate to a previously observed blunted MPS response to protein ingestion in such individuals [Citation69]. Findings from the literature investigating changes in lean and FFM with different daily amounts of high protein availability following RT similarly show no added benefit. For instance, ingestion of 5.5 times the RDA of protein (4.4 g.kg−1.d−1) resulted in similar gains in FFM compared to 1.8 g.kg−1.d−1 in resistance-trained individuals who otherwise maintain the same training regimen [Citation70]. Moreover, healthy-trained males and females consuming 3.4 g.kg−1.d−1 of protein showed no further increase in FFM compared to those ingesting 2.3 g.kg−1.d−1 [Citation29]. However, a key difference between CT and RT performed in isolation is likely differences in inherent training volumes/loads. The greater training volume with CT can lead to situations of energy deficit and thus spending more time in a catabolic state, particularly if adequate nutritional practices are not enforced during periods of recovery and rest. While a recent meta-analysis reported the presence of an energy deficit to impair gains in lean mass with RT [Citation71], findings from several studies show protein intake (in some cases up to three times the current RDA) can “rescue” declines in MPS with RT [Citation72–74]. Thus, considering these findings and the aforementioned evidence demonstrating greater increases in muscle mass with CT with increased protein availability compared to levels around 1–1.1 g.kg−1.d−1 [Citation30], it would be prudent for individuals participating in high-volume CT to consume protein intakes no less than 1.6 g.kg−1.d−1 with a likely upper limit of approximately 2.2–2.4 g.kg−1.d−1 to maximize increases in lean mass with CT. Total caloric energy must also be adequate in the context of CT to maximize increases in lean mass. While both higher protein groups in our current work reported significantly higher energy intakes compared to the lower protein groups, the similar increases in lean mass indicate caloric intake in these lower protein groups was still sufficient to support the cellular energy requirements to maximally facilitate muscle hypertrophy responses. In this regard, the caloric intake in the two lower protein groups (~122 kJ. kg−1.d−1, OR 29 kcal. kg−1.d−1, OR 2400 kcal.d−1, OR 10,053 kj.d−1) were comparable to energy intakes in previously reported studies demonstrating significant increases in muscle hypertrophy following CT [Citation4,Citation30], intuitively indicating this quantity of caloric intake can maximally promote increases in lean mass.
Among other body composition changes from our present work, we observed that BFP and VAT were reduced only in CT1 and remained unchanged in all other groups. This contrasts with our previous study in which fat mass remained unchanged with 12 weeks of CT while increasing in the RT group [Citation4]. Possible explanations for the BFP loss in the CT1 group include elevated excess post-exercise oxygen consumption (EPOC) due to the combination of HIIT and MICT in the ET component [Citation75–78] and lipolytic effects of epinephrine in response to HIIT previously identified [Citation79] and subsequently expected to stimulate fat loss [Citation80]. Notwithstanding, BFP remained unchanged in the CT2 group. Although there was no difference in training volume and modes between both CT groups, CT2 experienced a significant increase in energy intake during the intervention. Intuitively, it is possible that the high dietary protein intake in this group and potential for excess protein (i.e. beyond all tissue anabolic and metabolic needs) will eventually be converted to glucose (via gluconeogenesis) or ketone bodies and ultimately converted to glycogen or stored as fat [Citation81,Citation82].
Aerobic capacity and performance measures
Another novel finding from this study was that increases in vertical jump performance were higher in the CT1 group compared to both RT groups. This was surprising given the attenuation in Wingate peak power with CT1 compared to RT2 previously discussed. Such discrepancy in these diverse power adaptation responses may relate to differences in neuromuscular activation between tests due to repetitive and high-force contractions of antagonistic muscles of the contralateral leg during a Wingate test compared to the more static and explosive nature of a single vertical jump [Citation83]. Several studies have investigated vertical jump performance with CT and shown similar [Citation50,Citation84,Citation85] or no post-training increase [Citation86] compared to RT only. To our knowledge, this is the first study to investigate vertical jump performance with CT and high protein availability. Previous work following 8 weeks of RT showed no differences in vertical jump performance between daily protein intakes of either 2.3 g.kg−1.d−1 or 3.4 g.kg−1.d−1 in healthy trained males and females [Citation29], indicating no beneficial effects of extra protein availability. We previously showed similar magnitude increases in the squat and countermovement jumps (which both closely resemble vertical jump performance) between 12 weeks of CT and RT in combination with a high protein diet (2 g.kg−1.d−1). Collectively, while it appears high dietary protein availability can confer beneficial effects on selective aspects of muscle power output (such as vertical jump), such positive responses need to be interpreted with caution, particularly considering muscle power adaptations may vary more depending on factors such as exercise order and recovery time between CT sessions [Citation19].
Post-intervention increases in VO2max were significantly higher with CT compared to RT in both dietary protein amounts. This is unsurprising given the aerobic training component of the CT program and supports findings from a meta-analysis of 21 studies that showed a significantly larger effect size for improvements in VO2max with CT compared to RT only [Citation87]. Previous work has demonstrated that the addition of RT to ET can increase endurance performance [Citation88,Citation89] and VO2max [Citation14,Citation15,Citation49,Citation90–92], or at least produce similar magnitude increases in VO2max, compared to ET only [Citation87,Citation93,Citation94]. Moreover, the capacity for CT to increase aerobic capacity does not appear to be dependent on exercise order within a CT program [Citation64]. We recently demonstrated in a systematic review of 30 studies that protein ingestion following ET and/or HIIT significantly increases post-exercise MPS responses [Citation95]. Interestingly, this capacity for exogenous protein intake to augment MPS responses with aerobic training and/or HIIT was mainly confined to mixed and myofibrillar proteins rather than mitochondrial proteins, which would appear counterintuitive based on a classical principle of training specificity [Citation96]. Regardless, over extended periods of time (i.e. weeks, months), a recent systematic review and meta-analysis of 19 studies reported greater gains in O2peak with protein supplementation compared to a control condition [Citation97]. However, such findings are equivocal in the literature [Citation98–100], and one study reported no further improvements in VO2peak with 6 weeks CT between individuals consuming 3.5 g.kg−1.d−1 or 1.2 g.kg−1.d−1 of protein [Citation7]. Nonetheless, considering the maximum number of pull-ups, another measure of (upper body) muscular endurance, was significantly greater with higher dietary protein availability (i.e. in CT2 and RT2 compared to CT1 and RT1) in our current work, we contend that available evidence overall supports the intake of adequate protein availability (i.e. at least 1.6 g.kg−1.d−1) to help mediate aerobic capacity and muscular endurance responses with CT.
Biochemical markers of liver and kidney function
High protein diets have been associated with potential negative effects on kidney function, particularly glomerular filtration rate [Citation101–103]. Specifically, it has been put forward that high and sustained dietary protein intake can ultimately lead to glomerular damage and eventual kidney damage and failure [Citation104]. While such links may be more likely in individuals with compromised kidney function (such as chronic kidney disease) [Citation105], the association between high dietary protein availability and reduced kidney and liver function appears much less evident in healthy individuals [Citation106]. Considering the high protein components of our dietary intervention, which were two and four-fold higher than most national current RDAs for protein, we assessed several biochemical markers of kidney and liver function to determine whether 16 weeks of high protein availability alters these markers. Our results showed significant within-group increases in urea, creatinine, GGT, ALT, and AST post-intervention in both RT2 and CT2 groups consuming 3.2 g.kg−1.d−1 of protein, although no between-group differences compared with RT1 and CT1 groups were observed. Normal healthy ranges for these markers can vary depending on reference ranges used by local laboratories and an individual’s age. Compared to normal reference ranges, serum GGT, ALT, and AST values post-intervention in the RT2 and CT2 groups were still within normal reference ranges, although approaching the upper limits for these [Citation107,Citation108], while urea and creatinine levels were slightly above normal reference ranges [Citation109,Citation110]. While it is unknown whether these markers may continue to increase over longer periods of time (i.e. months to years), our results would indicate that individuals consuming very high protein diets (i.e. 3.2 g.kg−1.d−1) chronically may benefit from regular blood testing for continual monitoring of such markers to help confirm continual liver health.
Limitations and conclusion
Limitations of our current work are acknowledged. Firstly, all HIIT and MICT sessions in our study design involved stationary cycling on an ergometer. As such, the capacity for overground and/or treadmill running to alter exercise adaptation responses with CT from our study design is unknown. This is an important factor considering the likelihood of greater exercise-induced muscle damage and/or slower recovery responses with running compared to cycling due to the eccentric and concentric contractile nature of running compared to concentric contractions only with cycling [Citation111,Citation112]. Moreover, running is a central exercise modality in many team sports, such as basketball and rugby that undergo CT programs for performance; thus, including this exercise modality in future CT studies can also provide new sports application knowledge. Another limitation of our work was no comparison to a non-exercise or placebo group (i.e. dietary protein intake at current RDA). Without these comparisons, it is difficult to completely elucidate the extent to which the exercise or dietary component contributed to increases in select adaptation responses observed.
In conclusion, we report that 16 weeks of RT and CT each performed 4 d. wk−1 in combination with high protein diets of either 1.6 or 3.2 g.kg−1.d−1results in similar improvements in muscle strength and mass, absolute upper body power, and performance adaptations. This suggests athletes can gain benefits when consuming 1.6 g.kg−1.d−1 to promote muscular adaptations from RT and CT, except for absolute lower body peak power. Moreover, due to increases in liver and kidney markers in CT2 and RT2 groups, a protein intake of 1.6 g.kg−1.d−NaN Invalid Date NaNbe safer long-term compared to greater amounts (i.e. 3.2 g.kg−1.d−1). Also, CT following 1.6 g.kg−1.d−1 resulted in similar improvements in vertical jump and pull-up in comparison to other groups; moreover, the increases in VO 2max were significantly greater than RT in isolation groups (both RT1 and RT2).
Abbreviations
| BFP | = | body fat percentage |
| FFM | = | fat-free mass |
| RT | = | resistance training |
| ET | = | endurance training |
| CT | = | concurrent training |
Authors’ information
This was provided on the first page.
Ethical approval and consent to participate
The protocol was reviewed by the Institutional Human Subject Committee and the Ethics Committee of the University of Isfahan (IR.UI.REC.1400.098) and carried out in accordance with the Declaration of Helsinki. This study has been registered with the Iranian Registry of Clinical Trials (IRCT20191204045612N2). All participants signed an informed consent form and were informed that they could withdraw from the study at any point.
Consent for publication
We agree to publications after acceptance in JISSN.
Datat availability statement Data sharing is applicable.
Authorship contributions
Conceptualization: [Reza Bagheri and Donny M Camera]; Methodology: [Reza Bagheri, Donny M Camera, David Scott, Ramin Sadeghi, and Mehdi Kargarfard]; Formal analysis and investigation: [Reza Bagheri]; Writing – original draft preparation: [Reza Bagheri and Donny M Camera]; Writing – review and editing: [Reza Bagheri, Donny M Camera, David Scott, and Ramin Sadeghi]; Supervision: [Mehdi Kargarfard].
Supplemental Material
Download Zip (115.8 KB)Acknowledgments
We would like to express our great appreciation to Dr. Neda Cheraghloo for her valuable and constructive suggestions during data analysis.
Disclosure statement
No potential conflict of interest was reported by the author(s).
Supplementary material
Supplemental data for this article can be accessed online at https://doi.org/10.1080/15502783.2023.2236053
Additional information
Funding
References
- Pourabbas, M, Bagheri, R, Hooshmand Moghadam, B, et al. Strategic ingestion of high-protein dairy milk during a resistance training program increases lean mass, strength, and power in trained young males. Nutrients. 2021;13(3):948. doi: 10.3390/nu13030948
- Ashor, AW, Lara, J, Siervo, M, et al. Effects of exercise modalities on arterial stiffness and wave reflection: a systematic review and meta-analysis of randomized controlled trials. Plos One. 2014;9(10):e110034. doi: 10.1371/journal.pone.0110034
- Hawley, JA. Adaptations of skeletal muscle to prolonged, intense endurance training. Clin Exp Pharmacol Physiol. 2002;29(3):218–610. doi: 10.1046/j.1440-1681.2002.03623.x
- Shamim, B, Devlin, BL, Timmins, RG, et al. Adaptations to concurrent training in combination with high protein availability: a comparative trial in healthy, recreationally active men. Sports Med. 2018;48(12):2869–2883. doi: 10.1007/s40279-018-0999-9
- Davis, WJ, Wood, DT, Andrews, RG, et al. Concurrent training enhances athletes’ strength, muscle endurance, and other measures. J Strength Cond Res. 2008;22(5):1487–1502. doi: 10.1519/JSC.0b013e3181739f08
- Sabag, A, Najafi, A, Michael, S, et al. The compatibility of concurrent high intensity interval training and resistance training for muscular strength and hypertrophy: a systematic review and meta-analysis. J Sports Sci. 2018;36(21):2472–2483. doi: 10.1080/02640414.2018.1464636
- Forbes, SC, Bell, GJ. Whey protein isolate or concentrate combined with concurrent training does not augment performance, cardiorespiratory fitness, or strength adaptations. J Sports Med Phys Fitness. 2020;60(6):832–840. doi: 10.23736/S0022-4707.20.10314-1
- Baker, D. The effects of an in-season of concurrent training on the maintenance of maximal strength and power in professional and college-aged rugby league football players. J Strength Cond Res. 2001;15(2):172–177. doi: 10.1519/00124278-200105000-00004
- Argus, CK, Gill, N, Keogh, J, et al. Effects of a short-term pre-season training programme on the body composition and anaerobic performance of professional rugby union players. J Sports Sci. 2010;28(6):679–686. doi: 10.1080/02640411003645695
- Fyfe, JJ, Bishop, DJ, Stepto, NK. Interference between concurrent resistance and endurance exercise: molecular bases and the role of individual training variables. Sports Med. 2014;44(6):743–762. doi: 10.1007/s40279-014-0162-1
- Coffey, VG, Hawley, JA. Concurrent exercise training: do opposites distract? Journal Of Physiology. 2017;595(9):2883–2896. doi: 10.1113/JP272270
- Craig, BW, Lucas, J, Pohlman, R, et al. The effects of running, weightlifting and a combination of both on growth hormone release. J Strength Cond Res. 1991;5(4):198–203. doi: 10.1519/00124278-199111000-00005
- Bell, G, Syrotuik, D, Martin, T, et al. Effect of concurrent strength and endurance training on skeletal muscle properties and hormone concentrations in humans. Eur J Appl Physiol. 2000;81(5):418–427. doi: 10.1007/s004210050063
- Häkkinen, K, Alen, M, Kraemer, W, et al. Neuromuscular adaptations during concurrent strength and endurance training versus strength training. Eur J Appl Physiol. 2003;89(1):42–52. doi: 10.1007/s00421-002-0751-9
- Fyfe, JJ, Bartlett, JD, Hanson, ED, et al. Endurance training intensity does not mediate interference to maximal lower-body strength gain during short-term concurrent training. Front Physiol. 2016;7:487. DOI:10.3389/fphys.2016.00487
- Lundberg, TR, Fernandez-Gonzalo, R, Gustafsson, T, et al. Aerobic exercise does not compromise muscle hypertrophy response to short-term resistance training. J Appl Physiol. 2013;114(1):81–89. doi: 10.1152/japplphysiol.01013.2012
- Sale, D, Jacobs, I, MacDougall, J, et al. Comparison of two regimens of concurrent strength and endurance training. Med & Sci In Sports & Ex. 1990;22(3):348–356. doi: 10.1249/00005768-199006000-00012
- De Souza, E, Tricoli, V, Roschel, H, et al. Molecular adaptations to concurrent training. Int J Sports Med. 2013;34(3):207–213. doi: 10.1055/s-0032-1312627
- Schumann, M, Feuerbacher, JF, Sünkeler, M, et al. Compatibility of concurrent Aerobic and strength training for skeletal muscle size and function: an updated systematic review and meta-analysis. Sports Med 2021;52:1–12.
- Khodadadi, F, Bagheri, R, Negaresh, R, et al. The effect of high-intensity interval training type on body fat percentage, fat and fat-free mass: a systematic review and meta-analysis of randomized clinical trials. J Clin Med. 2023;12(6):2291. doi: 10.3390/jcm12062291
- Murach, KA, Bagley, JR. Skeletal muscle hypertrophy with concurrent exercise training: contrary evidence for an interference effect. Sports Med. 2016;46(8):1029–1039. doi: 10.1007/s40279-016-0496-y
- Bagheri, R, Moghadam, BH, Candow, DG, et al. Effects of Icelandic yogurt consumption and resistance training in healthy untrained older males. British Journal Of Nutrition. 2021;127(9):1334–1342. doi: 10.1017/S0007114521002166
- Morton, RW, Murphy, KT, McKellar, SR, et al. A systematic review, meta-analysis and meta-regression of the effect of protein supplementation on resistance training-induced gains in muscle mass and strength in healthy adults. Br J Sports Med. 2018;52(6):376–384. doi: 10.1136/bjsports-2017-097608
- Campbell, WW. Synergistic use of higher-protein diets or nutritional supplements with resistance training to counter sarcopenia. Nutr Rev. 2007;65(9):416–422. doi: 10.1111/j.1753-4887.2007.tb00320.x
- Candow, DG, Chilibeck, PD, Facci, M, et al. Protein supplementation before and after resistance training in older men. Eur J Appl Physiol. 2006;97(5):548–556. doi: 10.1007/s00421-006-0223-8
- Bosse, JD, Dixon, BM. Dietary protein to maximize resistance training: a review and examination of protein spread and change theories. J Int Soc Sports Nutr. 2012;9(1):1–11. doi: 10.1186/1550-2783-9-42
- Candow, DG, Burke, NC, Smith-Palmer, T, et al. Effect of whey and soy protein supplementation combined with resistance training in young adults. Int J Sport Nutr Exercise Metab. 2006;16(3):233–244. doi: 10.1123/ijsnem.16.3.233
- Rankin, JW, Goldman, LP, Puglisi, MJ, et al. Effect of post-exercise supplement consumption on adaptations to resistance training. J Am Coll Nutr. 2004;23(4):322–330. doi: 10.1080/07315724.2004.10719375
- Antonio, J, Ellerbroek, A, Silver, T, et al. A high protein diet (3.4 g/kg/d) combined with a heavy resistance training program improves body composition in healthy trained men and women–a follow-up investigation. J Int Soc Sports Nutr. 2015;12(1):1–9. doi: 10.1186/s12970-015-0100-0
- Ormsbee, MJ, Willingham, BD, Marchant, T, et al. Protein supplementation during a 6-month concurrent training program: effect on body composition and muscular strength in sedentary individuals. Int J Sport Nutr Exercise Metab. 2018;28(6):619–628. doi: 10.1123/ijsnem.2018-0036
- Hartono, FA, Martin-Arrowsmith, PW, Peeters, WM, et al. The effects of dietary protein supplementation on acute changes in muscle protein synthesis and longer-term changes in muscle mass, strength, and aerobic capacity in response to concurrent resistance and endurance exercise in healthy adults: a systematic review. Sports Med. 2022;52:1–34.
- Camera, DM. Evaluating the effects of increased protein intake on muscle strength, hypertrophy and power adaptations with concurrent training: a narrative review. Sports Med. 2021;52(3):441–461. doi: 10.1007/s40279-021-01585-9
- Ghobadi, H, Attarzadeh Hosseini, SR, Rashidlamir, A, et al. Auto-regulatory progressive training compared to linear programming on muscular strength, endurance, and body composition in recreationally active males. Eur J Sport Sci. 2021;22(10):1543–1554. doi: 10.1080/17461391.2021.1963321
- Wilborn, CD, Taylor, LW, Outlaw, J, et al. The effects of pre-and post-exercise whey vs. casein protein consumption on body composition and performance measures in collegiate female athletes. J Sports Sci Med. 2013;12(1):74.
- Cunha, PM, Nunes, JP, Tomeleri, CM, et al. Resistance training performed with single and multiple sets induces similar improvements in muscular strength, muscle mass, muscle quality, and IGF-1 in older women: A randomized controlled trial. J Strength Cond Res. 2020;34(4):1008–1016. doi: 10.1519/JSC.0000000000002847
- Colantonio, E, Barros, RV, MAPDM, K. Oxygen uptake during Wingate tests for arms and legs in swimmers and water polo players. Revista Brasileira de Medicina Do Esporte. 2003;9(3):141–144. doi: 10.1590/S1517-86922003000300003
- Ekblom‐Bak, E, Björkman, F, Hellenius, ML, et al. A new submaximal cycle ergometer test for prediction of VO2max. Scandinavian J Med Sci Sports. 2014;24(2):319–326. doi: 10.1111/sms.12014
- Björkman, F, Ekblom-Bak, E, Ekblom, Ö, et al. Validity of the revised Ekblom Bak cycle ergometer test in adults. Eur J Appl Physiol. 2016;116(9):1627–1638. doi: 10.1007/s00421-016-3412-0
- Björkman, F, Eggers, A, Stenman, A, et al. Sex and maturity status affected the validity of a submaximal cycle test in adolescents. Acta Paediatrica. 2018;107(1):126–133. doi: 10.1111/apa.14080
- Spillane, M, Schwarz, N, Willoughby, DS. Heavy resistance training and peri-exercise ingestion of a multi-ingredient ergogenic nutritional supplement in males: effects on body composition, muscle performance and markers of muscle protein synthesis. J Sports Sci Med. 2014;13(4):894.
- Haff, GG, Triplett, NT. Essentials of strength training and conditioning. 4th ed. Champaign, IL: Human kinetics; 2015.
- Vechin, FC, Conceição, MS, Telles, GD, et al. Interference phenomenon with concurrent strength and high-intensity interval training-based aerobic training: an updated model. Sports Med. 2021;51(4):599–605. doi: 10.1007/s40279-020-01421-6
- Antonio, J, Ellerbroek, A, Silver, T, et al. A high protein diet has no harmful effects: a one-year crossover study in resistance-trained males. J Nutr Metab. 2016;2016:1–5. DOI:10.1155/2016/9104792
- Moore, DR, Robinson, MJ, Fry, JL, et al. Ingested protein dose response of muscle and albumin protein synthesis after resistance exercise in young men. Am J Clin Nutr. 2009;89(1):161–168. doi: 10.3945/ajcn.2008.26401
- Snijders, T, Res, PT, Smeets, JS, et al. Protein ingestion before sleep increases muscle mass and strength gains during prolonged resistance-type exercise training in healthy young men. J Nutr. 2015;145(6):1178–1184. doi: 10.3945/jn.114.208371
- Perez-Schindler, J, Hamilton, DL, Moore, DR, et al. Nutritional strategies to support concurrent training. Eur J Sport Sci. 2015;15(1):41–52. doi: 10.1080/17461391.2014.950345
- Hamilton, DL, Philp, A. Can AMPK mediated suppression of mTORC1 explain the concurrent training effect? Cell Mol Exerc Physiol. 2013;2(1):e4. doi: 10.7457/cmep.v2i1.e4
- Cohen, J. A power primer. Phychol Bulletin. 1992;112(1):155–159. doi: 10.1037/0033-2909.112.1.155
- Hickson, RC. Interference of strength development by simultaneously training for strength and endurance. Eur J Appl Physiol Occup Physiol. 1980;45(2–3):255–263. doi: 10.1007/BF00421333
- McCarthy, JP, Agre, JC, Graf, BK, et al. Compatibility of adaptive responses with combining strength and endurance training. Med & Sci In Sports & Ex. 1995;27(3):429–436. doi: 10.1249/00005768-199503000-00021
- McCarthy, JP, Pozniak, MA, Agre, JC. Neuromuscular adaptations to concurrent strength and endurance training. Medicine & Science In Sports & Exercise. 2002;34(3):511–519. doi: 10.1097/00005768-200203000-00019
- Petré, H, Hemmingsson, E, Rosdahl, H, et al. Development of maximal dynamic strength during concurrent resistance and endurance training in untrained, moderately trained, and trained individuals: a systematic review and meta-analysis. Sports Med. 2021;51(5):991–1010. doi: 10.1007/s40279-021-01426-9
- De Souza, EO, Tricoli, V, Franchini, E, et al. Acute effect of two aerobic exercise modes on maximum strength and strength endurance. J Strength Cond Res. 2007;21(4):1286–1290. doi: 10.1519/00124278-200711000-00053
- Sporer, BC, Wenger, HA. Effects of aerobic exercise on strength performance following various periods of recovery. J Strength Cond Res. 2003;17(4):638–644. doi: 10.1519/00124278-200311000-00003
- Robineau, J, Babault, N, Piscione, J, et al. Specific training effects of concurrent aerobic and strength exercises depend on recovery duration. J Strength Cond Res. 2016;30(3):672–683. doi: 10.1519/JSC.0000000000000798
- Jäger, R, Kerksick, CM, Campbell, BI, et al. International society of sports nutrition position stand: protein and exercise. J Int Soc Sports Nutr. 2017;14(1):20. doi: 10.1186/s12970-017-0177-8
- Walker, TB, Smith, J, Herrera, M, et al. The influence of 8 weeks of whey-protein and leucine supplementation on physical and cognitive performance. Int J Sport Nutr Exercise Metab. 2010;20(5):409–417. doi: 10.1123/ijsnem.20.5.409
- Ives, SJ, Norton, C, Miller, V, et al. Multi-modal exercise training and protein-pacing enhances physical performance adaptations independent of growth hormone and BDNF but may be dependent on IGF-1 in exercise-trained men. Growth Hormone IGF Res. 2017;32:60–70. DOI:10.1016/j.ghir.2016.10.002
- Arciero, PJ, Ives, SJ, Norton, C, et al. Protein-pacing and multi-component exercise training improves physical performance outcomes in exercise-trained women: the PRISE 3 study. Nutrients. 2016;8(6):332. doi: 10.3390/nu8060332
- Tsitkanou, S, Spengos, K, Stasinaki, AN, et al. Effects of high‐intensity interval cycling performed after resistance training on muscle strength and hypertrophy. Scandinavian J Med Sci Sports. 2017;27(11):1317–1327. doi: 10.1111/sms.12751
- Linari, M, Bottinelli, R, Pellegrino, MA, et al. The mechanism of the force response to stretch in human skinned muscle fibres with different myosin isoforms. Journal Of Physiology. 2004;554(2):335–352. doi: 10.1113/jphysiol.2003.051748
- Kazior, Z, Willis, SJ, Moberg, M, et al. Endurance exercise enhances the effect of strength training on muscle fiber size and protein expression of Akt and mTOR. Plos One. 2016;11(2):e0149082. doi: 10.1371/journal.pone.0149082
- Eddens, L, van Someren, K, Howatson, G. The role of intra-session exercise sequence in the interference effect: a systematic review with meta-analysis. Sports Med. 2018;48(1):177–188. doi: 10.1007/s40279-017-0784-1
- Murlasits, Z, Kneffel, Z, Thalib, L. The physiological effects of concurrent strength and endurance training sequence: A systematic review and meta-analysis. J Sports Sci. 2018;36(11):1212–1219. doi: 10.1080/02640414.2017.1364405
- Ballard, TL, Clapper, JA, Specker, BL, et al. Effect of protein supplementation during a 6-mo strength and conditioning program on insulin-like growth factor I and markers of bone turnover in young adults. Am J Clin Nutr. 2005;81(6):1442–1448. doi: 10.1093/ajcn/81.6.1442
- Longland, TM, Oikawa, SY, Mitchell, CJ, et al. Higher compared with lower dietary protein during an energy deficit combined with intense exercise promotes greater lean mass gain and fat mass loss: a randomized trial. Am J Clin Nutr. 2016;103(3):738–746. doi: 10.3945/ajcn.115.119339
- Cronin, O, Barton, W, Skuse, P, et al. A prospective metagenomic and metabolomic analysis of the impact of exercise and/or whey protein supplementation on the gut microbiome of sedentary adults. mSystems. 2018;3(3):e00044–18. doi: 10.1128/mSystems.00044-18
- Weinheimer, EM, Conley, TB, Kobza, VM, et al. Whey protein supplementation does not affect exercise training-induced changes in body composition and indices of metabolic syndrome in middle-aged overweight and obese adults. J Nutr. 2012;142(8):1532–1539. doi: 10.3945/jn.111.153619
- Beals, JW, Burd, NA, Moore, DR, et al. Obesity alters the muscle protein synthetic response to nutrition and exercise. Front Nutr. 2019;6:87. doi: 10.3389/fnut.2019.00087
- Antonio, J, Peacock, CA, Ellerbroek, A, et al. The effects of consuming a high protein diet (4.4 g/kg/d) on body composition in resistance-trained individuals. J Int Soc Sports Nutr. 2014;11(1):19. doi: 10.1186/1550-2783-11-19
- Murphy, C, Koehler, K. Energy deficiency impairs resistance training gains in lean mass but not strength: A meta‐analysis and meta‐regression. Scandinavian J Med Sci Sports. 2022;32(1):125–137. doi: 10.1111/sms.14075
- Areta, JL, Burke, LM, Camera, DM, et al. Reduced resting skeletal muscle protein synthesis is rescued by resistance exercise and protein ingestion following short-term energy deficit. Am J Physiol Endocrinol Metab. 2014;306(8):E989–E997. doi: 10.1152/ajpendo.00590.2013
- Hector, AJ, McGlory, C, Damas, F, et al. Pronounced energy restriction with elevated protein intake results in no change in proteolysis and reductions in skeletal muscle protein synthesis that are mitigated by resistance exercise. Faseb J. 2018;32(1):265–275. doi: 10.1096/fj.201700158RR
- Hudson, JL, Wang, Y, Bergia, RE III, et al. Protein intake greater than the RDA differentially influences whole-body lean mass responses to purposeful catabolic and anabolic stressors: a systematic review and meta-analysis. Adv Nutr. 2020;11(3):548–558. doi: 10.1093/advances/nmz106
- Chan, HH, Burns, SF. Oxygen consumption, substrate oxidation, and blood pressure following sprint interval exercise. Appl Physiol Nutr Metab. 2013;38(2):182–187. doi: 10.1139/apnm-2012-0136
- Gore, C, Withers, R. The effect of exercise intensity and duration on the oxygen deficit and excess post-exercise oxygen consumption. Eur J Appl Physiol Occup Physiol. 1990;60(3):169–174. doi: 10.1007/BF00839153
- Hazell, TJ, Olver, TD, Hamilton, CD, et al. Two minutes of sprint-interval exercise elicits 24-hr oxygen consumption similar to that of 30 min of continuous endurance exercise. Int J Sport Nutr Exercise Metab. 2012;22(4):276–283. doi: 10.1123/ijsnem.22.4.276
- Laforgia, J, Withers, RT, Gore, CJ. Effects of exercise intensity and duration on the excess post-exercise oxygen consumption. J Sports Sci. 2006;24(12):1247–1264. doi: 10.1080/02640410600552064
- Zouhal, H, Jacob, C, Delamarche, P, et al. Catecholamines and the effects of exercise, training and gender. Sports Med. 2008;38(5):401–423. doi: 10.2165/00007256-200838050-00004
- Galster, AD, Clutter, WE, Cryer, PE, et al. Epinephrine plasma thresholds for lipolytic effects in man: measurements of fatty acid transport with [l-13C] palmitic acid. J Clin Investig. 1981;67(6):1729–1738. doi: 10.1172/JCI110211
- Hildebrandt, LA, Spennetta, T, Elson, C, et al. Utilization and preferred metabolic pathway of ketone bodies for lipid synthesis by isolated rat hepatoma cells. Am J Physiol Cell Physiol. 1995;269(1):C22–C7. doi: 10.1152/ajpcell.1995.269.1.C22
- Gannon, MC, Nuttall, FQ. Amino acid ingestion and glucose metabolism—a review. IUBMB Life. 2010;62(9):660–668. doi: 10.1002/iub.375
- Driss, T, Vandewalle, H. The measurement of maximal (anaerobic) power output on a cycle ergometer: a critical review. Bio Med Res Int. 2013;2013:1–40. doi: 10.1155/2013/589361
- Mathieu, B, Robineau, J, Piscione, J, et al. Concurrent training programming: the acute effects of sprint interval exercise on the subsequent strength training. Sports. 2022;10(5):75. doi: 10.3390/sports10050075
- Balabinis, CP, Psarakis, CH, Moukas, M, et al. Early phase changes by concurrent endurance and strength training. J Strength Cond Res. 2003;17(2):393–401. doi: 10.1519/1533-4287(2003)017<0393:EPCBCE>2.0.CO;2
- Glowacki, SP, Martin, SE, Maurer, A, et al. Effects of resistance, endurance, and concurrent exercise on training outcomes in men. Med & Sci In Sports & Ex. 2004;36:2119–2127. DOI:10.1249/01.MSS.0000147629.74832.52
- Wilson, JM, Marin, PJ, Rhea, MR, et al. Concurrent training: a meta-analysis examining interference of aerobic and resistance exercises. J Strength Cond Res. 2012;26(8):2293–2307. doi: 10.1519/JSC.0b013e31823a3e2d
- Aagaard, P, Andersen, JL. Effects of strength training on endurance capacity in top‐level endurance athletes. Scandinavian J Med Sci Sports. 2010;20:39–47. doi: 10.1111/j.1600-0838.2010.01197.x
- Rønnestad, BR, Hansen, EA, Raastad, T. Effect of heavy strength training on thigh muscle cross-sectional area, performance determinants, and performance in well-trained cyclists. Eur J Appl Physiol. 2010;108(5):965–975. doi: 10.1007/s00421-009-1307-z
- Mikkola, J, Rusko, H, Izquierdo, M, et al. Neuromuscular and cardiovascular adaptations during concurrent strength and endurance training in untrained men. Int J Sports Med. 2012;33(9):702–710. doi: 10.1055/s-0031-1295475
- Cadore, EL, Izquierdo, M, Pinto, SS, et al. Neuromuscular adaptations to concurrent training in the elderly: effects of intrasession exercise sequence. Age. 2013;35(3):891–903. doi: 10.1007/s11357-012-9405-y
- Hickson, R, Dvorak, B, Gorostiaga, E, et al. Potential for strength and endurance training to amplify endurance performance. J Appl Physiol. 1988;65(5):2285–2290. doi: 10.1152/jappl.1988.65.5.2285
- Nelson, AG, Arnall, DA, Loy, SF, et al. Consequences of combining strength and endurance training regimens. Phys Ther. 1990;70(5):287–294. doi: 10.1093/ptj/70.5.287
- Psilander, N, Frank, P, Flockhart, M, et al. Adding strength to endurance training does not enhance aerobic capacity in cyclists. Scandinavian J Med Sci Sports. 2015;25(4):e353–e359. doi: 10.1111/sms.12338
- Bagheri, R, Robinson, I, Moradi, S, et al. Muscle protein synthesis responses following aerobic-based exercise or high-intensity interval training with or without protein ingestion: a systematic review. Sports Med. 2022;52(11):2713–2732. doi: 10.1007/s40279-022-01707-x
- Coffey, VG, Hawley, JA. The molecular bases of training adaptation. Sports Med. 2007;37(9):737–763. doi: 10.2165/00007256-200737090-00001
- Lin, Y-N, Tseng, T-T, Knuiman, P, et al. Protein supplementation increases adaptations to endurance training: A systematic review and meta-analysis. Clin Nutr. 2021;40(5):3123–3132. doi: 10.1016/j.clnu.2020.12.012
- Forbes, SC, Bell, GJ. Whey protein isolate supplementation while endurance training does not Alter cycling performance or immune responses at rest or after exercise. Front Nutr. 2019;6:19. doi: 10.3389/fnut.2019.00019
- Roberson, PA, Romero, MA, Mumford, PW, et al. Protein supplementation throughout 10 weeks of progressive run training is not beneficial for time trial improvement. Front Nutr. 2018;5:97. DOI:10.3389/fnut.2018.00097
- Jonvik, KL, Paulussen, KJ, Danen, SL, et al. Protein supplementation does not augment adaptations to endurance exercise training. Med & Sci In Sports & Ex. 2019;51(10):2041. doi: 10.1249/MSS.0000000000002028
- Ko, G-J, Rhee, CM, Kalantar-Zadeh, K, et al. The effects of high-protein diets on kidney health and longevity. J Am Soc Nephrol. 2020;31(8):1667–1679. doi: 10.1681/ASN.2020010028
- Kalantar-Zadeh, K, Kramer, HM, Fouque, D. High-protein diet is bad for kidney health: unleashing the taboo. UK: Oxford University Press; 2020. 1–4.
- Schwingshackl, L, Hoffmann, G, Sands, JM. Comparison of high vs. normal/low protein diets on renal function in subjects without chronic kidney disease: a systematic review and meta-analysis. Plos One. 2014;9(5):e97656. doi: 10.1371/journal.pone.0097656
- Brenner, BM, Meyer, TW, Hostetter, TH. Dietary protein intake and the progressive nature of kidney disease: the role of hemodynamically mediated glomerular injury in the pathogenesis of progressive glomerular sclerosis in aging, renal ablation, and intrinsic renal disease. N Engl J Med. 1982;307(11):652–659. doi: 10.1056/NEJM198209093071104
- Fouque, D, Laville, M, Boissel, JP 2006 . Low protein diets for chronic kidney disease in non diabetic adults. Cochrane Database Syst Rev. (2):1–10.
- Devries, MC, Sithamparapillai, A, Brimble, KS, et al. Changes in kidney function do not differ between healthy adults consuming higher-compared with lower-or normal-protein diets: a systematic review and meta-analysis. J Nutr. 2018;148(11):1760–1775. doi: 10.1093/jn/nxy197
- Shivaraj, G, Prakash, D, Vinayak, H, et al. A review on laboratory liver function tests. Pan Afr Med J. 2009;3:17.
- Nicoll, D, Detmer, W. Current medical diagnosis & treatment. Basic Principles of Diagnostic Test Use and Interpretation. 36th edn ed. Stamford, CT: Appleton & Lange; 1997. 1–16.
- Shahbaz, H, Gupta, M, Owais, A. Frequency, awareness, and symptoms of chikungunya among patients in a tertiary care hospital of Karachi: a cross-sectional study. Cureus. 2019;11(2). doi: 10.7759/cureus.4054
- Hosten, AO. BUN and creatinine. Clinical methods: the history, physical, and laboratory examinations. 3rd ed. Salem, New Hampshire: Butterworths; 1990.
- Bijker, K, De Groot, G, Hollander, A. Differences in leg muscle activity during running and cycling in humans. Eur J Appl Physiol. 2002;87(6):556–561. doi: 10.1007/s00421-002-0663-8
- Peake, JM, Neubauer, O, Della Gatta, PA, et al. Muscle damage and inflammation during recovery from exercise. J Appl Physiol. 2017;122(3):559–570. doi: 10.1152/japplphysiol.00971.2016