
ABSTRACT
Background
Despite the high risk of eating disorder (ED)-related attitudes and behaviors among female dancers, targeted scientific dietary regimens are currently inadequate. Time-restricted eating (TRE), a popular intermittent fasting protocol, has been shown to be effective in enhancing body composition and exercise performance in athletes. In this study, TRE was employed as a dietary regimen to improve body composition and exercise performance and address ED attitudes and behaviors in DanceSport dancers.
Methods
Twenty female DanceSport dancers were recruited and divided into two groups: TRE (n = 10) and normal diet (ND) (n = 10). The TRE group consumed their self-selected necessary energy intake exclusively between 11 a.m. and 7 p.m. (utilizing a 16-hour fasting and 8-hour eating window) for 6 weeks, while the ND group maintained their regular dieting patterns. The consumption of water, black tea, or coffee without added sugar or milk was not restricted. Physical activity and calorie intake were systematically recorded during the TRE intervention. Body composition, aerobic and anaerobic performance, and ED attitudes and behaviors were assessed before and after the TRE intervention. The trial was registered in the Chinese Clinical Trial Registry under the identifier ChiCTR2200063780.
Results
The fixed effects tests (p < 0.0001) and estimates for the intercept (p < 0.0001) of hunger level indicated a noticeable effect on the initial state of hunger during TRE. No significant differences were observed in ED attitudes or behaviors (p > 0.05). TRE resulted in a reduction in hip circumference (p = 0.039), fat mass (kg) (p = 0.0004), and body fat percentage (p = 0.0005), with no significant decrease in fat-free mass (p > 0.05). No significant improvement was observed in aerobic performance (p > 0.05). The average power (AP) (p = 0.01) and AP/Body weight ratio (p = 0.003) significantly increased. Additionally, the power drop decreased significantly (p = 0.019). Group-by-time interactions were observed for fat mass (kg) (p = 0.01), body fat percentage (p = 0.035), and AP/Body weight (p = 0.020).
Conclusion
TRE can be considered a feasible nutritional strategy for DanceSport dancers, facilitating improvements in body composition without compromising aerobic and anaerobic exercise performance or exacerbating ED attitudes and behaviors. Moreover, TRE may facilitate more favorable physiological adaptations, potentially contributing to improved exercise performance.
1. Introduction
A judicious nutritional strategy is imperative for dancers [Citation1] because nutrient availability profoundly influences energy expenditure, body composition, and exercise performance [Citation2]. DanceSport is a high-intensity, competitive, and aesthetic form of exercise characterized by strict demands on body shape and exercise performance [Citation3]. The quality and timing of dietary intake are critical for meeting the demands of high-intensity exercise performance [Citation1]. However, dancers often pursue a slim body shape at the expense of physical and mental health and nutrient availability. Numerous studies have demonstrated heightened concern for body shape, eating disorders (ED), and binge-eating behavior among dancers, which are also associated with an increased risk of obesity, heart disease, and diabetes [Citation4,Citation5]. Many female dancers also develop menstrual cycle disorders, osteoporosis, and depression because of their unscientific eating habits [Citation6].
The 16/8 time-restricted eating (TRE) is a specific form of intermittent fasting that limits calorie intake to an 8-hour window with 16 fasting hours per day [Citation7]. TRE allows for an adjustable eating and fasting window, leading to a generally high adherence of up to 87% in human participants [Citation8]. Consequently, TRE has been widely implemented in recent years. Some studies did not find any significant improvements in body composition or exercise performance [Citation9,Citation10]. Numerous studies in athletic groups have suggested that TRE may reduce fat mass (FM) without impairing aerobic and anaerobic performance or fat-free mass (FFM) [Citation11–13]. Some studies have reported neutral results for TRE, without significant improvements in body composition and/or exercise capacity [Citation14–16].
To the best of our knowledge, no previous study has reported the effects of TRE in groups of dancers. Therefore, the aim of our research was to investigate the effects of a 6-week TRE program on female DanceSport dancers. We hypothesized that the TRE protocol would lead to a reduction in FM without impairing aerobic and anaerobic performance or exacerbating eating disorders.
2. Methods
2.1. Participants
All the participants in this trial were undergraduate DanceSport dancers recruited from the School of Art at Beijing Sport University. They possessed advanced professional techniques, had at least 5 years of training experience, and had participated in domestic or global competitions at least once. They were enrolled in a comparable school curriculum and, as a result, had similar levels of physical activity. The included participants were under 25 years of age, had a body mass index (BMI) of less than 24 kg/m2, were not currently using any medication or anabolic steroids, had no acute or chronic diseases, were not undergoing any physical treatment or rehabilitation, and did not smoke or consume alcohol.
All the participants received written information detailing the procedures, requirements, and risks associated with the tests and interventions, which were approved by the Sports Science Experiment Ethics Committee of Beijing Sports University (2022156 H). All participants provided written informed consent before participation.
2.2. Study design
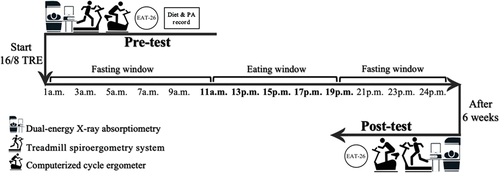
This trial was registered in the Chinese Clinical Trial Registry (https://www.chictr.org.cn.) under the registration number ChiCTR2200063780. The study design is illustrated in . The trial comprised a total of 6 nonconsecutive visits, with 3 conducted before the TRE intervention and 3 after the intervention. All measurements were distributed across 3 nonconsecutive visits conducted before and at the conclusion of the 6-week intervention. During the first visit, basic information, height, body weight (BW), and body composition were recorded. Aerobic and anaerobic tests were conducted during the other two visits, with a 5-day interval between visits. All participants commenced the TRE intervention in September 2022.
Figure 1. Study design. TRE, Time-restricted eating; PA, Physical activity; EAT-26: Eating attitudes test.
2.3. Sample size
By employing G-Power software (G-Power 3.1.9.6, Developed by Axel Buchner, Heinrich-Heine-Universität Düsseldorf, Germany), the statistical power (1-β) was set at 0.80, the type I error rate (α) at 0.05, the correlation between pre-and-post intervention measures at 0.80, and the effect size at 0.4. The analysis required a sample size of 20 participants (including potential dropouts).
2.4. Physical activity intervention
Participants were classified based on their physical activity levels according to their habitual curriculum training routine, which was consistently followed throughout the intervention period. Physical activity levels before and during the TRE intervention were assessed using the short version of the International Physical Activity Questionnaire (IPAQ) [Citation17]. The IPAQ has been validated with reasonable measurement properties for monitoring population levels of physical activity among adults aged 18–65 years in diverse settings [Citation17,Citation18]. The IPAQ was distributed every other week to all participants, and the total weekly metabolic equivalent (MET) was calculated based on the official scoring criteria.
2.5. Dietary intervention
All recruited participants were instructed to document all food and liquid intake in pictures and send them via the WeChat application (the most widely used communication application in mainland China) for one week before the TRE intervention, ensuring they maintained normal dietary habits. Participants in the normal diet (ND) group continued with their habitual eating patterns throughout the intervention, usually before their first class at 8 a.m. and after their last class at 8 p.m. Participants in the TRE group were instructed to consume all their dietary intake within an 8-hour window (11 a.m. to 7 p.m.). No energy intake beyond the 8-hour eating window was allowed. The consumption of water, black tea, or coffee without added sugar or milk was not restricted. Throughout the 6-week TRE intervention, all participants were required to document their food and liquid intake in the same manner as before the TRE period, ensuring that the TRE group adhered to the 8-hour window and the ND group maintained their habitual eating patterns. Participants were instructed to send their pictures directly to one researcher rather than in a group chat to minimize interactive influence.
A three-day estimated food record and a 72-hour recall were employed to track and calculate the energy intake in both the TRE and ND groups [Citation19]. Food energy was analyzed using the “BoHe” application, a professional team that offers diet analysis and photo identification of food calories for millions of Chinese people. All subjects reported their energy intake for three consecutive days, including two weekdays and one weekend day (from Thursday to Saturday), both before and every week during the TRE intervention.
Sunday was designated as an energy supplementation day. The three-day estimated food record was converted into calories to assess whether there was an energy deficit between the pretest and the rest of the week. Participants with an energy deficit were instructed to supplement their lack of energy every Sunday by choosing foods containing suitable calories. A dietitian conducted one-on-one consultations with the participants twice a week using the current dietary data to ensure that the progression of food intake in both groups was scientifically managed and did not induce adverse reactions.
2.6. Hunger
Throughout the TRE intervention, the hunger levels of participants in the TRE group were recorded using a visual analog scale (VAS) [Citation20]. The VAS was completed every week during the intervention on Saturday just before the TRE eating window began (at 10:30 a.m). The participants were instructed to indicate their current level of hunger by marking the box that best described their feelings. The VAS was equidistantly marked with different levels of hunger: (1) very hungry (need to eat), (2) hungry (would like to eat), (3) somewhat hungry (could eat), (4) no feeling of fullness or hunger, (5) somewhat full (could eat some more), (6) full (I have eaten enough), and (7) very full (feel I have eaten too much).
2.7. ED attitudes and behaviors
Eating disorder (ED) attitudes and behaviors were assessed using the Eating Attitudes Test (EAT-26) [Citation21]. The EAT-26 questionnaire comprises 26 statements and 5 behavioral questions. A total score of ≥ 20 in the 26 statements or any endorsement in the 5 behavioral questions would suggest a high risk of developing an ED.
2.8. Anthropometry
Height was measured using a wall-mounted stadiometer to the nearest 0.1 cm while subjects stood upright on their heels with shoulders touching the stadiometer. Waist and hip circumferences were measured using heavy-duty inelastic plastic fiber tape, with participants standing with a bare midriff after exhaling, both feet touching, and arms hanging freely [Citation22]. Hip circumference was measured at the maximum extension of the buttocks, and waist circumference was measured directly on the skin at the level of the iliac crest [Citation23]. BW was recorded, and body composition was assessed using a dual-energy X-ray absorptiometry (DXA) scan (Lunar iDXATM, GE Healthcare software enCORE version 16, Madison, WI, USA). The BMI, body fat percentage, FM, and FFM values were recorded. All participants underwent the DXA scan on the same day during both pre- and posttests between 7 and 11 a.m. Participants were instructed to fast for 6 hours and abstain from consuming any liquid for 2 hours prior to the testing session. After changing into light clothes and removing shoes and accessories, the participants were instructed to lie in a supine position with their feet evenly positioned on either side of the midline and arms placed equidistant to the trunk with hands pronated and fingers spread. Before the tests, a quality assurance program was implemented with known properties, in accordance with the manufacturer’s instructions.
2.9. Aerobic performance
The incremental exercise test was conducted on a motorized treadmill (RUN 7410/T-PC; RunnerTM, Cavezzo MO, Italy). Following a comprehensive oral explanation of the test, sufficient stretching preparation, and a 3-minute warm-up at 7 km/h, the speed was increased by 1 km/h after every 3-minute interval. This protocol provided the most accurate submaximal measurement of physiological variables [Citation24], until volitional exhaustion [Citation25]. Ratings of perceived exertion (RPE) and heart rate (HR) were recorded during the last 30 seconds of each stage. A 1% gradient was maintained throughout the test to simulate outdoor running [Citation26]. The test was conducted in a scientific motor laboratory with a room temperature between 21–24 degree Celsius. Respiratory gas exchange parameters including maximal oxygen intake (VO2max), oxygen intake per kilogram (VO2/kg), carbon dioxide production (VCO2), and anaerobic threshold (AT) were recorded. The VO2max was determined if any of the two following criteria were met: a respiratory exchange ratio over 1.1; an HR ±10 bpm of the maximal age-predicted HR; RPE scale over 18; oxygen intake of the subjects increased to the plateau period or slowly decreased with the load intensity [Citation27].
2.10. Anaerobic performance
The Wingate Anaerobic Test was conducted using a computerized cycle ergometer (Monark 894E Peak Bike, Monark TM, Sweden). Matching toe clips are installed to prevent foot slippage. The foot position on the pedals, saddle height, and upper-body posture were customized according to the individual anthropometric specifications. The individual adjustments remained the same during both pre- and posttests. Following an oral explanation of the test and a 10-minute warm-up, the participants were instructed to pedal at full speed with the cycle ergometer unloaded for 5 seconds. During this stage, a braking force equivalent to 7.5% of individual’s body mass was applied with a countdown of 30 seconds [Citation28]. Throughout the test, the participants were verbally encouraged to achieve their best performance. The peak power (PP), PP/BW, average power (AP), AP/BW, and power drop (PD) were recorded. PD was calculated using this equation: Power Drop (%) = ((Peak Power − Minimum Power)/Peak Power) × 100, where PP and minimum power represent the highest and lowest power output achieved during the Wingate test [Citation29]. The test was conducted in a scientific motor laboratory with a room temperature between 21–24 degrees Celsius.
2.11. Statistics
Statistical analysis was conducted using SPSS software (IBM SPSS Statistics 27.0, Ehningen, Germany). Results were presented as means ± SD or n (%). Normal distribution was assessed using Shapiro-Wilk’s W test. An independent samples t-test was used to assess baseline differences between the groups. A repeated-measures ANOVA with group-by-time interaction was used to assess the intervention effects. Outliers and sphericity were assessed before conducting repeated-measures ANOVA. A Chi-square test (χ2) was utilized for non-parametric analysis. A linear mixed-effects model was applied, considering time as a fixed effect to capture the overall trend across multiple time points, while accounting for individual variability through random effects. Differences were considered statistically significant at p < 0.05.
3. Results
3.1. Characteristics and physical activity
A total of 20 female DanceSport dancers (age: 19.25 ± 1.21 years, p = 0.37; height: 1.65 ± 0.04 cm, p = 0.51; body mass: 52.52 ± 5.28 kg, p = 0.30; body mass index: 19.21 ± 1.75 kg/m2, p = 0.44) enrolled at Beijing Sport University were recruited and randomly assigned to the TRE (n = 10) or ND (n = 10) group using computer-generated software. No dropouts were recorded, and all participants completed the TRE intervention and the pre- and posttests. No reports of side effects were received or detected by the researcher or dietitian during or after the intervention. The baseline characteristics of each group are shown in . No significant differences were observed at the baseline.
Table 1. Baseline characteristics.
The participants spent 3.2 ± 1.4 hours per day on DanceSport training and had a baseline physical activity level of 9778.3 ± 4274.5 MET-min/week. During the TRE intervention, the TRE group performed 10,003.1 ± 3710.1 MET-min/week of physical activity, while the ND group engaged in 8953.9 ± 4657 MET-min/week. No significant differences were observed (p = 0.521).
3.2. Hunger
Hunger levels during the 6-week TRE intervention were recorded, as shown in . According to the linear mixed-effects model, the covariance parameter estimates for residual variance were highly significant (Z = 4.415, p < 0.0001), indicating a good fit for individual variability. The fixed-effects tests demonstrated a highly significant intercept (F = 75.669, p < 0.0001) and the fixed-effect estimates for the intercept were also highly significant (t = 8.699, p < 0.0001). The fixed-effect estimate for the different testing sessions (time effect) was not statistically significant (t = 0.473, p = 0.643).
Figure 2. The line chart of hunger levels in TRE group during the 6-week TRE intervention.
3.3. Energy intake
The three-day estimated food records and 72-hour recalls before and during TRE intervention were analyzed. As shown in , no significant differences were found in the total calorie intake and macronutrients between the groups. Moreover, no significant differences in total calorie and macronutrients intake were observed between the baseline level and during the TRE intervention (total calorie intake at baseline: TRE: 1486.4 ± 215.6 kcal; ND: 1562.2 ± 323.8 kcal). During the TRE intervention, the TRE group consumed an average of 1523.6 ± 333.1 kcal per day. Of these, 15.2 ± 2.2% was protein, 32.8 ± 3.4% was fat, and 52.0 ± 4.2% was carbohydrates. The ND group ingested 1595.9 ± 328.2 kcal per day during the experiment, with 16.7 ± 2.1% from protein, 34.2 ± 3.2% from fat, and 49.1 ± 4.4% from carbohydrate.
Table 2. Total calorie intake and macronutrients at baseline and during TRE in TRE and ND group.
3.4. ED attitudes and behaviors
ED attitudes and behaviors at baseline and after 6 weeks in the TRE and ND groups are shown in . The overall ED level, binge eating behavior, and significant weight loss behavior (20 pounds or more in the last 6 months) remained the same at baseline and after 6 weeks. No significant differences were observed between baseline and posttest in vomiting behavior (p = 0.5), drug use behavior (p = 1.582), or excessive exercise behavior (p = 0.474).
Table 3. ED attitudes and behaviors at baseline and posttest in TRE and ND group.
3.5. Body composition
The body composition at baseline and after 6 weeks in the TRE and ND groups is shown in . No significant differences were found in waist circumference (p = 0.70) (), BMI (p = 0.72) (), or FFM (p = 0.88) (). The hip circumference (p = 0.039) () differed significantly after 6 weeks, changing from 90.4 ± 4.3 cm to 88.3 ± 4.4 cm. Meanwhile, FM (kg) (p = 0.0004) () and body fat percentage (p = 0.0005) () were significantly altered after 6 weeks, changing from 14.3 ± 3.6 kg and 27.3 ± 4.4% to 13.0 ± 2.9 kg and 25.4 ± 3.8%, respectively. In the repeated measures ANOVA, significant group-by-time interactions were observed for FM (kg) (F = 8.371, p = 0.01) and body fat percentage (F = 5.172, p = 0.035). No other significant group-by-time interactions were observed for body composition assessments.
Figure 3. The violin plots of changes of waist circumference, hip circumference, body mass index (BMI), fat mass (FM) and fat-free mass (FFM) in TRE and ND group at baseline and after TRE intervention. The thick lines indicate the median value in each group. The thin lines represent each interquartile range. The pound sign (#) illustrates within-group differences (p < 0.05).
3.6. Aerobic performance
shows the aerobic performance of the TRE and ND groups at baseline and after 6 weeks. No significant between-group or within-group differences were observed in HR (p = 0.68) (), VO2max (p = 0.97) (), VO2/kg (p = 0.56) (), VCO2 (p = 0.73) (), or AT (p = 0.11) (). In the repeated-measures ANOVA, no significant group-by-time interaction was observed in aerobic performance assessments.
Figure 4. The violin plots of changes of heart rate (HR), maximum oxygen intake (VO2max), oxygen intake (VO2/kg), carbon dioxide production (VCO2) and anaerobic threshold (AT) in TRE and ND group at baseline and after TRE intervention. The thick lines indicate the median value in each group. The thin lines represent each interquartile range.
3.7. Anaerobic performance
Anaerobic performance at baseline and after 6 weeks in the TRE and ND groups is shown in . Baseline data from one subject each in the TRE and ND groups were excluded because they were verified as outliers. No significant differences were found in PP (p = 0.17) () or PP/BW (p = 0.30) (). The within-group significant differences in AP (p = 0.01) () and AP/BW (p = 0.003) () were observed, changed from 292.1 ± 43.9 W to 316.5 ± 45.8 W and from 5.4 ± 0.4 W/kg to 5.9 ± 0.6 W/kg separately. The within-group PD after 6 weeks was significantly differed (TRE: 57.9 ± 14.3%; ND: 66.0 ± 7.48%) (p = 0.043) (). Moreover, significant decrease of PD was also detected in TRE group after 6 weeks compared with ND group (p = 0.05), altered from 62.6 ± 20.1% to 48.8 ± 6.5% (). In the repeated measures ANOVA, significant group-by-time interactions were observed for AP/BW (F = 6.529, p = 0.020). No other significant group-by-time interactions were observed during anaerobic performance assessment.
Figure 5. The violin plots of changes of peak power (PP), PP/BW, average power (AP), AP/BW and power drop (PD) in TRE and ND group at baseline and after TRE intervention. The thick lines indicate the median value in each group. The thin lines represent each interquartile range. The asterisk mark (*) demonstrates between-group significant difference (p < 0.05). The pound sign (#) illustrates within-group differences (p < 0.05).
4. Discussion
To the best of our knowledge, this is the first TRE intervention study specifically targeting DanceSport dancers. Dancer groups, particularly female dancers, face high demands regarding body shape and exercise performance. Consequently, the daily intake of fats and carbohydrates may be more frequently restricted than in other groups [Citation30]. Recent research reported an approximately 50% underweight rate among female ballet dancers and artistic gymnasts [Citation30], leading to a higher risk of disordered eating attitudes and low energy availability [Citation30–32]. Our study demonstrated that a 6-week 16/8 TRE intervention reduced FM while maintaining FFM, without impairing aerobic or anaerobic performance. AP/BW increased and PD decreased after the 6-week intervention period. Additionally, no significant improvement was observed in ED attitudes or behaviors.
Hunger levels in the TRE group were recorded weekly during the 6-week intervention. The highly significant intercept for both the fixed effects analysis and estimation, combined with the non-significant results for the time effect, suggests that engaging in TRE had a remarkable effect on the initial state of hunger. However, hunger levels did not exhibit a significant trend over the six-week period, which means that the hunger impact of TRE may be more pronounced at the beginning of the intervention but remains relatively stable over time, reducing the improvement in adherence and making TRE more subjectively acceptable.
Consistent with most previous studies, in this study, FM in kilograms and as a percentage significantly decreased after TRE, with no impairment in FFM. In addition, a significant decrease in hip circumference was observed in the TRE group. Although not every TRE intervention results in significant changes in body composition [Citation14], various durations of TRE ranging from 4 to 8 weeks have been shown to significantly reduce BW or FM without affecting exercise performance capacity [Citation12,Citation14,Citation33]. Notably, unlike interventions involving calorie restrictions, for example, a 25% caloric deficit [Citation14] or instructing participants to consume isocaloric diets with the same macronutrient composition [Citation33], our study did not restrict calorie intake during the entire TRE intervention. Participants were allowed to consume as much self-picked food as desired within an 8-hour eating window. Hatori et al. [Citation34] found an increase in hepatic AMP and phospho-acetyl coenzyme A carboxylase (pACC), reflecting increased hepatic AMPK activity in mice fed a high-fat diet with 16/8 TRE (no change in energy intervention). This may be the mechanism by which TRE regulates metabolism without altering the energy intake.
TRE significantly reduced FM in this study, potentially because of its impact on circadian rhythms, thereby influencing energy expenditure rates [Citation35,Citation36]. When combined with exercise, TRE has the potential to enhance lipid metabolism, thereby contributing to alterations in glucose and fat consumption rates [Citation37,Citation38]. Although the main increase in lipid metabolism occurs between 18 and 24 h of acute fasting [Citation39], significant changes can occur during long-term intervention with shorter fasting durations. By coordinating feeding times and leveraging circadian rhythm, TRE activates key metabolic regulators and pathways involved in lipid metabolism, such as PPAR γ and AMPK. For example, TRE increases the level of REV-ERB α (a circadian transcriptional repressor) and reduces expression of a key lipogenic gene, fatty acid synthase [Citation40]. The function of the AMPK pathway, 5′-cyclic adenosine 5′-monophosphate response element binding protein, and mammalian target of rapamycin, as well as the circadian clock oscillations and target gene expression, can all be enhanced by TRE. Liver metabolism is modified, and food uptake and energy expenditure are enhanced by these modifications to the anabolic and catabolic pathways [Citation34].
Despite the relatively short duration of fasting (6 weeks), time-restricted eating (TRE) can positively impact body composition and exercise performance through several mechanisms [Citation39]. TRE enhances fat oxidation, leading to a reduction in body fat mass, while also improving insulin sensitivity. This enhancement facilitates glucose uptake by muscle cells and aids in exercise performance and recovery. Additionally, an increase in growth hormone secretion during fasting can promote muscle growth and repair, potentially enhancing exercise performance. Furthermore, the reduction in inflammation and improvement in mitochondrial function resulting from TRE can contribute to a better recovery from exercise-induced muscle damage and enhance energy production during physical activity [Citation41].
DanceSport, as a sports discipline, involves alternating physical activity with medium duration and high energy demands, encompassing both aerobic and anaerobic phases separated by short recovery periods [Citation25]. The current study did not observe any significant improvements in aerobic capacity. While practical evidence in dancers is still limited, similar supportive results were achieved in an 8-week TRE experiment in runners; exercise performance was not impaired with a decrease in body weight and energy intake [Citation12]. They observed no improvement in laboratory-based measures of aerobic performance. As reported, 4–8 weeks of TRE intervention in endurance or resistance training athletes did not result in any significant improvement in running economy or •VO2max values during a graded maximal exercise test [Citation11–13]. Consistent with a previous study, adherence to a TRE diet had a neutral effect on aerobic performance [Citation33]. In our study, improvements in aerobic performance were more closely related to exercise training and less affected by short-term dietary interventions. Although the participants in this study also underwent normal training, the 6-week TRE intervention had little effect on their aerobic performance.
In our study, anaerobic AP and AP/BW ratio significantly improved with a decrease in PD. Similar results were also found in a 4-week TRE intervention in healthy men; the Wingate tests were conducted after 1 and 4 weeks of TRE intervention, and a significant increase in AP was only observed after 4 weeks [Citation42]. This suggests that short-term TRE can lead to the depletion of hepatic glycogen, which may negatively impact exercise performance [Citation9]. Furthermore, TRE can elicit better physiological adaptations to enhance anaerobic exercise performance, and this effect is strongly mediated by TRE [Citation42]. This finding was also supported by Park et al. [Citation43]. The higher glycogen content in the liver and skeletal muscles resulting from intermittent fasting may be the reason for the improvement in AP and AP/BW in the present study.
PD is defined as the difference between PP and minimum power, and originally demonstrated physical fatigue during exercise [Citation44]. Numerous studies have shown that because of the metabolic switch that occurs during a change in diet regimen, TRE could lead to decreased weight gain and lower blood glucose levels [Citation45]. This, in turn, increases beta-hydroxybutyrate levels during lipid metabolism, resulting in higher ketone levels and, consequently, resistance to physical fatigue [Citation46,Citation47].
This study was designed for DanceSport dancers with the original aim of improving their physical and mental health, which is often exacerbated by unhealthy eating habits, such as restricted food intake or binge eating behavior, owing to their high requirement for body shape and weight. Despite numerous studies proving the efficacy of TRE in athletic groups or exercise performance [Citation10,Citation12,Citation13,Citation33,Citation42,Citation48], a clear prevalence of ED among female dancers has been reported in previous studies [Citation49,Citation50]. Therefore, the EAT-26 was administered in this study before and after the 6-week TRE intervention to address psychological safety and ensure that this eating strategy would not mask any risky behaviors. Based on these results, TRE, despite being an eating restriction regimen for DanceSport dancers, a high-risk group, could be considered a feasible and effective dietary strategy to reduce their unhealthy eating habits.
5. Limitations
This study had some limitations. (1) As a pilot study with 20 participants, the results can be justified by further research with larger samples, whether through randomized controlled trials or cohort studies. (2) The energy and macronutrient intake in this study were estimated using a consecutive three-day estimated food record and a 72-hour recall, which may have limitations in assessing the accuracy of nutritional calculations. (3) Since blinding of the participants was not possible with a TRE intervention and all the included subjects were undergraduate DanceSport dancers who might know each other in the same grade, potential interactions between groups might have existed, which could have influenced how they performed the intervention. Although the participants were coded with numbers, researchers were not blinded to the group participants when performing the exercise performance tests, potentially introducing bias. (4) despite no exacerbation of ED was observed, other potential psychological effects cannot be ruled out and should be further analyzed in future studies. (5) A recent study reported that the improvement in total body mass, insulin resistance, fasting glucose, adiposity, inflammation, and gut microbial diversity was better in the early TRE (food intake restricted to the early part of the day) than in the middle TRE (food intake restricted to the middle of the day) [Citation51]. We selected the middle TRE in this study to align with the curriculum of dancers in schools. Further studies are needed to investigate the effects of early TRE and compare different TRE regimens.
6. Conclusions
In conclusion, our study suggests that the 16/8 TRE protocol is a feasible nutritional regimen for DanceSport dancers. This approach has the potential to enhance body composition while concurrently sustaining aerobic and anaerobic exercise performance without exacerbating eating disorders.
Acknowledgments
The authors would like to express their gratitude for the support provided by Dr. Jing Mi, his doctoral student Naijing Jin, and Dr. Lijin Gong and acknowledge the valuable assistance in participant recruitment and organization provided by the DanceSport instructors Lu Li, Jie Yang, Bei Chen, Chang Liu, and Zhiwei He. Additionally, sincere thanks are extended to all the participants for their voluntary involvement in the study.
Disclosure statement
No potential conflict of interest was reported by the author(s).
Additional information
Funding
References
- Brown DD. Nutritional considerations for the vegetarian and vegan dancer. J Dance Med Sci. 2018;22(1):44–16. doi: 10.12678/1089-313X.22.1.44
- Nobari H, Saedmocheshi S, Murawska-Ciałowicz E, et al. Exploring the effects of energy constraints on performance, body composition, Endocrinological/Hematological biomarkers, and Immune System among athletes: an overview of the fasting state. Nutrients. 2022;14(15):3197. doi: 10.3390/nu14153197
- Liiv H, Wyon MA, Jürimäe T, et al. Anthropometry, somatotypes, and aerobic power in ballet, contemporary dance, and dancesport. Med Probl Perform Art. 2013;28(4):207–211. doi: 10.21091/mppa.2013.4041
- Application of Chinese Traditional Culture in Dance Sports Creation. Yu J, editor. 2015 International Conference on Economics, Social Science, Arts, Education and Management Engineering, Xi’an, China. Atlantis Press; 2015.
- Kulshreshtha M, Babu N, Goel NJ, et al. Disordered eating attitudes and body shape concerns among North Indian Kathak dancers. Intl J Eat Disord. 2021;54(2):148–154. doi: 10.1002/eat.23425
- Doria N, Numer M, Cimino S. Dancing in a culture of disordered eating: A feminist poststructural analysis of body and body image among young girls in the world of dance. PLOS ONE. 2022;17(1):e0247651. doi: 10.1371/journal.pone.0247651
- Świątkiewicz I, Woźniak A, Taub PR. Time-restricted eating and metabolic syndrome: current status and future perspectives. Nutrients. 2021;13(1):221. doi: 10.3390/nu13010221
- Wu B, White K, Maw MTT, et al. Adherence to diet and meal timing in a randomized controlled feeding study of time-restricted feeding. Nutrients. 2022;14(11):2283. doi: 10.3390/nu14112283
- Naharudin MNB, Yusof A. The effect of 10 days of intermittent fasting on Wingate anaerobic power and prolonged high-intensity time-to-exhaustion cycling performance. Eur J Sport Sci. 2018;18(5):667–676. doi: 10.1080/17461391.2018.1438520
- Correia J M, Santos I, Pezarat-Correia P, et al. Effects of intermittent fasting on specific exercise performance outcomes: a systematic review including meta-analysis. Nutrients. 2020;12(5):1390. doi: 10.3390/nu12051390
- Tinsley GM, Moore ML, Graybeal AJ, et al. Time-restricted feeding plus resistance training in active females: a randomized trial. Am J Clin Nutr. 2019;110(3):628–640. doi: 10.1093/ajcn/nqz126
- Brady AJ, Langton HM, Mulligan M, et al. Effects of 8 wk of 16: 8 time-restricted eating in male middle-and long-distance runners. Med Sci Sports Exerc. 2021;53(3):633–642. doi: 10.1249/MSS.0000000000002488
- Moro T, Tinsley G, Bianco A, et al. Effects of eight weeks of time-restricted feeding (16/8) on basal metabolism, maximal strength, body composition, inflammation, and cardiovascular risk factors in resistance-trained males. J Transl Med. 2016;14(1):1–10. doi: 10.1186/s12967-016-1044-0
- Stratton MT, Tinsley GM, Alesi MG, et al. Four weeks of time-restricted feeding combined with resistance training does not differentially influence measures of body composition, muscle performance, resting energy expenditure, and blood biomarkers. Nutrients. 2020;12(4):1126. doi: 10.3390/nu12041126
- Chaouachi A, Coutts AJ, Chamari K, et al. Effect of ramadan intermittent fasting on aerobic and anaerobic performance and perception of fatigue in male elite judo athletes. J Strength Cond Res. 2009;23(9):2702–2709. doi: 10.1519/JSC.0b013e3181bc17fc
- Aziz AR, Chia M, Singh R, et al. Effects of Ramadan Fasting on Perceived Exercise Intensity during High-Intensity Interval Training in Elite Youth Soccer Players. Int J Sports Sci & Coaching. 2011;6(1):87–98. doi: 10.1260/1747-9541.6.1.87
- Craig CL, Marshall AL, Sjöström M, et al. International physical activity questionnaire: 12-country reliability and validity. Med Sci Sports Exerc. 2003;35(8):1381–1395. doi: 10.1249/01.MSS.0000078924.61453.FB
- Lee PH, Macfarlane DJ, Lam TH, et al. Validity of the international physical activity questionnaire short form (IPAQ-SF): a systematic review. Int J Behav Nutr Phys Act. 2011;8(1):1–11. doi: 10.1186/1479-5868-8-115
- Schröder H, Covas M, Marrugat J, et al. Use of a three-day estimated food record, a 72-hour recall and a food-frequency questionnaire for dietary assessment in a Mediterranean Spanish population. Clin Nutr. 2001;20(5):429–437. doi: 10.1054/clnu.2001.0460
- Flint A, Raben A, Blundell J, et al. Reproducibility, power and validity of visual analogue scales in assessment of appetite sensations in single test meal studies. Int J Obesity. 2000;24(1):38–48. doi: 10.1038/sj.ijo.0801083
- Garner DM, Olmsted MP, Bohr Y, et al. The eating attitudes test: psychometric features and clinical correlates. Psychol Med. 1982;12(4):871–878. doi: 10.1017/S0033291700049163
- Ness‐Abramof R, Apovian CM. Waist circumference measurement in clinical practice. Nut In Clin Prac. 2008;23(4):397–404. doi: 10.1177/0884533608321700
- Wang J, Thornton J, Kolesnik S, et al. Anthropometry in body composition: an overview. Ann N Y Acad Sci. 2000;904(1):317–326. doi: 10.1111/j.1749-6632.2000.tb06474.x
- Bentley DJ, Newell J, Bishop D. Incremental exercise test design and analysis: implications for performance diagnostics in endurance athletes. Sports Med. 2007;37(7):575–586. doi: 10.2165/00007256-200737070-00002
- Bria S, Bianco M, Galvani C, et al. Physiological characteristics of elite sport-dancers. J Sports Med Phys Fitness. 2011;51(2):194–203.
- Jones AM, Doust JH. A 1% treadmill grade most accurately reflects the energetic cost of outdoor running. J Sports Sci. 1996;14(4):321–327. doi: 10.1080/02640419608727717
- Howley ET, Bassett DR, Welch HG. Criteria for maximal oxygen uptake: review and commentary. Med Sci Sports Exerc. 1995;27(9):1292–1301. doi: 10.1249/00005768-199509000-00009
- Doré E, Bedu M, França NM, et al. Testing peak cycling performance: effects of braking force during growth. Med Sci Sports Exerc. 2000;32(2):493. doi: 10.1097/00005768-200002000-00035
- Adams GM. Exercise physiology : laboratory manual. Boston: McGraw-Hill; 2002. eng.
- Leonkiewicz M, Wawrzyniak A, Farrer LM. Recruitment, adherence and attrition challenges in internet-based indicated prevention programs for eating disorders: lessons learned from a randomised controlled trial of ProYouth OZ. J Eat Disord. 2022;10(1):1–12. doi: 10.1186/s40337-021-00520-7
- Prus D, Mijatovic D, Hadzic V, et al. (Low) Energy Availability and Its Association with Injury Occurrence in Competitive Dance: Cross-Sectional Analysis in Female Dancers. Medicina (B Aires). 2022;58(7):853. doi: 10.3390/medicina58070853
- Keay N, Overseas A, Francis G. Indicators and correlates of low energy availability in male and female dancers. BMJ Open Sport Exercise Med. 2020;6(1):e000906. doi: 10.1136/bmjsem-2020-000906
- Tovar AP, Richardson CE, Keim NL, et al. Four weeks of 16/8 time restrictive feeding in endurance trained male runners decreases fat mass, without affecting exercise performance. Nutrients. 2021;13(9):2941. doi: 10.3390/nu13092941
- Hatori M, Vollmers C, Zarrinpar A, et al. Time-restricted feeding without reducing caloric intake prevents metabolic diseases in mice fed a high-fat diet. Cell Metab. 2012;15(6):848–860. doi: 10.1016/j.cmet.2012.04.019
- Manoogian EN, Chow LS, Taub PR, et al. Time-restricted eating for the prevention and management of metabolic diseases. Endocrine Reviews. 2022;43(2):405–436. doi: 10.1210/endrev/bnab027
- Chaix A, Manoogian EN, Melkani GC, et al. Time-restricted eating to prevent and manage chronic metabolic diseases. Annu Rev Nutr. 2019;39(1):291–315. doi: 10.1146/annurev-nutr-082018-124320
- Kotarsky CJ, Johnson NR, Mahoney SJ, et al. Time‐restricted eating and concurrent exercise training reduces fat mass and increases lean mass in overweight and obese adults. Physiological Reports. 2021;9(10):e14868. doi: 10.14814/phy2.14868
- Damasceno de Lima R, Fudoli Lins Vieira R, Rosetto Muñoz V, et al. Time-restricted feeding combined with resistance exercise prevents obesity and improves lipid metabolism in the liver of mice fed a high-fat diet. Am J Physiol Endocrinol Metab. 2023;325(5):E513–E528. doi: 10.1152/ajpendo.00129.2023
- Stratton MT, Albracht-Schulte K, Harty PS, et al. Physiological responses to acute fasting: implications for intermittent fasting programs. Nutr Rev. 2022;80(3):439–452. doi: 10.1093/nutrit/nuab094
- Cho H, Zhao X, Hatori M, et al. Regulation of circadian behaviour and metabolism by REV-ERB-α and REV-ERB-β. Nature. 2012;485(7396):123–127. doi: 10.1038/nature11048
- Markus I, Constantini K, Hoffman J, et al. Exercise-induced muscle damage: Mechanism, assessment and nutritional factors to accelerate recovery. Eur J Appl Physiol. 2021;121(4):969–992. doi: 10.1007/s00421-020-04566-4
- Correia JM, Santos I, Pezarat-Correia P, et al. Effects of time-restricted feeding on supramaximal exercise performance and body composition: a randomized and counterbalanced crossover study in healthy men. Int J Environ Res Public Health. 2021;18(14):7227. doi: 10.3390/ijerph18147227
- Park S, Yoo KM, Hyun JS, et al. Intermittent fasting reduces body fat but exacerbates hepatic insulin resistance in young rats regardless of high protein and fat diets. J Nutr Biochem. 2017;40:14–22. doi: 10.1016/j.jnutbio.2016.10.003
- Naharudin MN, Yusof A, Lucia A. Fatigue index and fatigue rate during an anaerobic performance under hypohydrations. PLOS ONE. 2013;8(10):e77290. doi: 10.1371/journal.pone.0077290
- Cho Y, Hong N, K-W K, et al. The effectiveness of intermittent fasting to reduce body mass index and glucose metabolism: a systematic review and meta-analysis. J Clin Med. 2019;8(10):1645. doi: 10.3390/jcm8101645
- Dedual MA, Wueest S, Borsigova M, et al. Intermittent fasting improves metabolic flexibility in short-term high-fat diet-fed mice. Am J Physiol Endocrinol Metab. 2019;317(5):E773–E782. doi: 10.1152/ajpendo.00187.2019
- Niepoetter P, Butts-Wilmsmeyer C, Gopalan C, et al. Intermittent fasting and mental and physical fatigue in obese and non-obese rats. PLOS ONE. 2022;17(11):e0275684. doi: 10.1371/journal.pone.0275684
- Isenmann E, Dissemond J, Geisler S. The effects of a macronutrient-based diet and time-restricted feeding (16: 8) on body composition in physically active individuals—a 14-week randomised controlled trial. Nutrients. 2021;13(9):3122. doi: 10.3390/nu13093122
- Aoun A, Ghanem C, Hamod N, et al. The Safety and Efficacy of Intermittent Fasting for Weight Loss. Nutr Today. 2020;55(6):270–277. doi: 10.1097/NT.0000000000000443
- Cuccolo K, Kramer R, Petros T, et al. Intermittent fasting implementation and association with eating disorder symptomatology. Eat Disord. 2022;30(5):471–491. doi: 10.1080/10640266.2021.1922145
- Xie Z, Sun Y, Ye Y, et al. Randomized controlled trial for time-restricted eating in healthy volunteers without obesity. Nat Commun. 2022;13(1):1003. doi: 10.1038/s41467-022-28662-5