Abstract
To study the composition of wild strawberries grown at high altitude, total antioxidant capacity, total phenolic compounds, total flavonoids, and individual phenolic compounds were measured in wild strawberries (Fragaria vesca) collected between 2,650 and 3,300 m above sea level in Bolivia. Total antioxidant capacity, as assessed by the ferric-reducing antioxidant power and 2,2' -azino-bis(3-ethylbenzotiazoline-6-sulphonic acid) methods, was in the range 16-39 μmol of Trolox equivalents/g fw by both methods. The total phenolic content was 9.7–21 μmol gallic acid equivalents/g fw, and the flavonoid content ranged between 2.8 and 4.9 μmol of catechin equivalents/g fw. The data obtained by the four methods showed several significant linear correlations confirming that flavonoids and other phenolic compounds contributed significantly to the total antioxidant capacity values. Reversed-phase high performance liquid chromatography analysis of extracts subjected to acid hydrolysis showed the presence of seven major fractions, tentatively identified as ellagic acid, cyanidin, pelargonidin, quercetin, kaempferol, gallic acid derivatives, and catechin derivatives. The data indicated that wild strawberries have a somewhat higher total antioxidant capacity content in comparison with that reported for cultivated strawberries. No obvious difference to the composition reported for wild strawberries grown at low altitude could be found.
INTRODUCTION
Numerous species of wild strawberries (genus Fragaria) are distributed world wide, and they have importance as the origin of strawberries and, to some extent, as a component of traditional diets. A characteristic feature of many berries is their high content of phenolic compounds, including derivatives of hydroxybenzoic and hydroxycinnamic acid, anthocyanins, flavonols, ellagitannins, and conjugated forms of gallic acid (CitationAaby et al., 2007; CitationMäättä, et al., 2004). Cultivated strawberries (F. ananassa) have been shown to have a higher content of phenolic compounds and antioxidant activity compared to many other plants, especially regarding ellagic acid (CitationAaby et al., 2007; CitationHäkkinen, and Törrönen, 2000; CitationWilliner et al., 2003) and vitamin C (CitationOlsson et al., 2004; CitationProteggente et al., 2002). Concerning the effects on the consumer, ellagic acid, and related compounds have been suggested to have anticarcinogenic and antimutagenic effects (CitationWang and Zheng, 2001; CitationWedge et al., 2001).
In South America, the F. chiloensis and F. vesca species are the most common wild strawberry species found. A reason could be that they are adaptable to special growth conditions; for example, F. chiloensis can survive on nutrient-poor dunes at high salt levels and has a higher maximal photosynthetic rate than that of any other species (CitationHancock and Luby, 1993). In Bolivia, some wild strawberry species, such as F. vesca, have adapted to the high altitude (CitationNavarro and Maldonado, 1994), but it is not known if wild strawberries grown at high altitude (including the higher exposure to ultraviolet radiation) have a different composition from those grown at low altitude. Since few data on the antioxidant capacity and total phenolic content of wild strawberries are available in the literature compared to those on the cultivated varieties of strawberry, the aim of the present study was to contribute new data about these aspects of wild strawberry from Bolivia.
MATERIALS AND METHODS
Chemicals
The Folin-Ciocalteu reagent, gallic acid, sodium carbonate, sodium nitrite 99%, aluminium chloride hexahydrate 97%, and acetone (p.a.) were purchased from Merck (Darmstadt, Germany); ABTS [2,2′-azino-bis(3-ethylbenzotiazoline-6-sulphonic acid)], baicalein 98%, catechin 99%, ellagic acid 99%, catechin gallate 99%, kaempferol 99%, quercetin 99%, potassium persulphate, Trolox (6-hydroxy-2,5,7,8-tetramethyl chroman-2-carboxylic acid) 97%, and TPTZ (2,4,6-tripyridyl-s-triazine) from Sigma-Aldrich (St. Louis, MO, USA); ferric chloride from ICN Biomedicals Inc. (Costa Mesa, CA, USA); acetic acid (glacial p.a.) and sodium acetate from BDH Chemicals Ltd. (Poole, UK). Cyanidin Cl and pelargonidin Cl were obtained from Extrasynthèse (Genay, France) and methanol high performance liquid chromatography (HPLC) grade from Laboratory supplies (Poole, UK).
Plant Material
Samples of wild strawberries were collected in April 2005 at an altitude range from 2,650 to 3,300 m above sea level from the sites Patata and Quirambaya, Department of La Paz, Bolivia, nearby the city of Sorata. A voucher was deposited in the Herbario Nacional de Bolivia, and the sample was identified as F. vesca. The samples were collected in two different ecological systems, one from mountains valleys at 2,000 to 3,100 m with a mesotropical climate and the other one from the upper mountain region at 3,100 to 3,900 m with a subtropical climate. At low altitude, the berries grow in the shade, but at high altitude, the conditions switched between shadow and sunlight exposure and high to low humidity. The locations of the collection sites are summarized in . The samples were stored cool in plastic bags for 24–48 h before they were transferred to a freezer (−20°C) until extraction. The extracts were kept in a freezer (−80°C) until the day of analysis.
TABLE 1 Description of the Collection Sites for Wild Strawberry Samples
Sample Preparation
The samples were mixed with sodium acetate buffer (0.1 M, pH 5.0) in a liquid to sample ratio of 1:1 and homogenized in a mixer. The samples were centrifuged in a Thermo IEC Multi/RF with an 8850 rotor (Thermo Fisher Scientific Inc., Waltham, MA, USA) (Thermo Fisat 20,000 g during 30 min at 4°C. The supernatant liquids were aspirated and stored at −80°C. One gram of the remaining pulp was homogenized with 8 ml of acetone and was stirred during 30 min at room temperature. Then the mixture was centrifuged for 10 min at 1,200 g and room temperature. The supernatant solution was stored at −80°C before being analyzed (CitationNilsson et al., 2005).
Measurement of Total Antioxidant Capacity (TAC)
TAC was measured by the ABTS method (CitationRe et al., 1999) and a modification of the ferric-reducing antioxidant power (FRAP) method (CitationBenzie and Strain, 1996) as described elsewhere (CitationNilsson et al., 2005; CitationPeñarrieta et al., 2008). Trolox was used as a standard. The green ABTS•+ radical was prepared by the addition of potassium persulphate, and on the day of analysis, the ABTS•+ solution was diluted with ethanol to an absorbance of 0.70 (±0.02) at 734 nm. After the addition of 1.0 ml of ABTS•+ solution to 100 μl of sample, the mixture was stirred for 30 s and the absorbance at 734 nm and 25°C was recorded for 6 min. The FRAP reagent was a mixture of 0.1 mol/l sodium acetate buffer (pH 3.6), 10 mmol/l TPTZ, and 20 mmol/l ferric chloride (10:1:1, v/v/v). To 900 μl of reagent, 90 μl of water and 30 μl of sample were added. The absorbance readings were performed at 593 nm for 10 min. The final absorbance of each sample was compared with that of a standard curve made using Trolox (100–1,000 μmol/l). The data were expressed as μmol Trolox equivalents per gram of fresh matter. To assess the TAC of reference compounds, they were dissolved in ethanol at 25–180 μmol/l.
Measurement of Total Phenolic Compounds (TPHs)
The TPHs were determined using the Folin-Ciocalteu reagent (CitationSingleton and Rossi, 1965). The reagent, diluted ten times (2.5 ml) was mixed with 2 ml of saturated sodium carbonate (75 g/L) and 50 μl of sample (diluted ten times), and the mixture was kept for 30 min at 45°C. The absorbance at 765 nm was read after cooling to room temperature. A standard curve made from gallic acid (235–1,176 μmol/l) was used. The data were expressed as μmol gallic acid equivalents per gram of fresh matter.
Measurement of Total Flavonoids (TFs)
The TF content was determined according to CitationZhishen et al. (1999). A solution corresponding to 30 μl of sodium nitrite (10%), 60 μl of aluminium chloride hexahydrate (20%), 200 μl of NaOH (1 M), and 400 μl of water was added to 100-μl sample. The absorbance readings at 510 nm were started 5 min after the addition of the sample and were performed every 20 s for 1 min. The final absorbance of each sample was compared with a standard curve made from catechin (69–689 μmol/l). The data were expressed as μmol catechin equivalents per gram of fresh matter.
HPLC
Prior to the HPLC analysis, the extracts were refluxed in 1.5 M HCl in methanol for 2 h at 90°C after the addition of baicalein as an internal standard. Phenolic compounds were separated using a Shimadzu (Shimaduz Corporation, Kyoto, Japan) liquid chromatograph system (LC 10ADVP), comprising a vacuum degasser (DGU 14-A), a solvent delivery module (FCV-10ALVP), an auto-injector (SIL-10ADVP), a column oven (CTO-10ASVP), and a diode-array detector (SPD-M10AVP) as described previously (CitationPeñarrieta et al. 2008). The column was a 3.5-μm Kromasil reversed phase column 150 mm × 4 mm protected by a Kromasil C18 10 mm pre-column (Scantec Lab, Sävedalen, Sweden). The flow rate was 0.8 ml/min and the injection volume was 20 μl. The mobile phase was a binary solvent system consisting of (A) 1% acetic acid/water and (B) methanol and the gradient used was 0 min 40% B, 5 min 65% B, 10 min 90% B, 15 min 40% B until 17 min. The absorbance at 260, 280, 330, and 530 nm was recorded. The compounds were identified by comparing with standards of each identified compound using retention time, the absorbance spectra, and also by running the samples after the addition of pure standards (CitationMacrea, 1982). The chromatographic and spectral features of the standards are shown in . The concentrations were calculated from the peak heights of the internal standard and each compound in the samples and in reference solutions by the following equation (CitationMacrea, 1982):
-
CCS = concentration of the identified compound in the sample,
-
HCS = peak height of the compound in the sample,
-
CISS = concentration of the internal standard added in the sample,
-
HISS = peak height of the internal standard added in the sample,
-
HISSTD = peak height of the internal standard in the reference solution,
-
CISSTD = concentration of the internal standard in the reference solution,
-
CCSTD = concentration of identified compound in the reference solution, and
-
HCSTD = peak height of the identified compound in the reference solution.
TABLE 2 Chromatographic and Spectral Features of Substances Tentatively Identified in Wild Strawberry
Statistical Analysis
The results were expressed as mean values (SD) of six replicates measured over three days for TAC, FRAP, TPHs, and TFs. Linear correlation coefficients were calculated according to the Pearson method. The significance of differences between groups was assessed by the paired t-test and the Wilcoxon's signed ranks test (SPSS, version 11.0).
RESULTS AND DISCUSSION
TAC in Wild Strawberries
The TAC values obtained using ABTS were in the same range in the water-soluble and water-insoluble extracts, the medians being 10.6 and 11.8 μmol/g fw, respectively (). The variation between values from different samples was approximately three-fold in both extracts. Also, using the FRAP method, the values in the water-soluble and water-insoluble extracts were similar, the medians being 11.6 and 13.3 μmol/g fw, respectively. The TAC values obtained after acid hydrolysis of the extracts, which is expected to show the activity of the liberated aglycones, showed a significant increment in the water-soluble fractions in comparison with the nonhydrolyzed samples (). For the water-insoluble fractions, no significant corresponding change in TAC was observed.
TABLE 3 TAC in Water-Soluble and Water-Insoluble Extracts of Wild Strawberry as Measured by the ABTS and FRAP Methods before and after Acid Hydrolysis (SD) (Data for Each Sample Are Expressed as μmol Trolox Equivalents per Gram of Fresh Matter and Are Means from Six Measurements)
TPHs and TFs in Wild Strawberries
The contents of TPH and TF were of similar magnitude in the water-soluble and water-insoluble extracts of wild strawberries, the medians of TPH being 6.9 and 5.6 μmol/g fw, respectively (). The variation between values from different samples was approximately three-fold in both extracts. The TF values were approximately 20% of the TPH values, the median TF being 1.9 and 1.4 μmol/g fw in the two extracts, respectively ().
TABLE 4 Content of TPHs and TFs in Wild Strawberry Samples
Comparison of TAC, TPH, and TF Values with Literature Data
Only a few TAC values measured in wild strawberry are available in the literature (). Using ABTS, 33.2 μmol/g fw was found in wild strawberry (F. vesca) by CitationScalzo et al. (2005) and 34.4 μmol/g fw by FRAP (CitationHalvorsen et al. 2002), and 10.3 μmol/g fw by FRAP and 11.3 μmol/g fw by ABTS was reported by CitationPellegrini et al. (2003). Regarding cultivated strawberries (F. ananassa), the TAC values by ABTS were found to be in the range of 8–20 μmol/g fw in cultivars from Sweden and Italy (CitationOlsson et al., 2004; CitationPellegrini et al., 2003; CitationScalzo et al., 2005) and 25.9 μmol/g fw in American class I Driscoll British variety (CitationProteggente et al., 2002). The observed TAC values by FRAP from cultivated strawberries were in the range of 21.7–33.5 μmol/g fw corresponding to 10.9–16.9 using our method (CitationHalvorsen et al., 2002; CitationKlopotek et al., 2005; CitationProteggente et al., 2002) and in other studies by the FRAP method 6.1–16.3 μmol/g fw (CitationOlsson et al., 2004; CitationPellegrini et al., 2003). Based on these data, it can be concluded that TAC values determined by both FRAP and ABTS methods are somewhat higher in wild strawberry (F. vesca) than in cultivated strawberries (F. ananassa).
TABLE 5 Comparison of Present Data on Wild Strawberries with the Corresponding Data from the Literature
Regarding TPH and TF, TPH values of 6.2–19.4 μmol GAE/g fw were previously found in wild and cultivated strawberries (CitationCheel et al., 2007; CitationChun et al., 2005; CitationHeinonen et al., 1998; CitationProteggente et al., 2002; CitationScalzo et al., 2005), which is similar to the range determined in the present study. Compared to the data in one publication about the TF content in strawberry and other fruits determined with the same method as ours (CitationChun et al., 2005), our value on the TF content of wild strawberries (3.0 μmol CE/g fw) was higher than those in strawberries and all of the other fruits, except the highest value reported for plums (6.6 μmol CE/g fw).
Correlation among Measurements
Statistically significant correlations were observed between the values of ABTS versus FRAP, ABTS versus TPH, FRAP versus TPH in both the water-soluble and water-insoluble extracts (), while for TF versus FRAP, ABTS, or TPH, significant correlations were only observed in the water-soluble fraction. Similar linear correlations between ABTS and FRAP were also observed in studies of other plant foods (CitationBahorun et al., 2004; CitationNilsson et al., 2005; CitationThaipong et al., 2006; CitationVerzelloni et al., 2007). A correlation between FRAP and TPH was also observed in other studies (CitationKähkönen et al., 1999; CitationSaura-Calixto and Goni, 2006) and between ABTS and TPH by CitationDjeridane et al. (2006) and CitationProteggente et al. (2002). A correlation between the values of TPH and TF was previously observed in canihua and vinegars (CitationPeñarrieta et al., 2008; CitationVerzelloni et al., 2007). Among individual compounds, the content of ellagic acid was correlated to the ABTS, FRAP, and TPH values (). Previously, a significant correlation was found between total ellagic acid content and the water-insoluble TAC (ABTS) compounds in strawberries, indicating that this compound was important for this TAC value (CitationOlsson et al., 2004).
TABLE 6 Correlations Between Different Measurements Made in Wild Strawberries (Correlation Coefficient Calculated According to Pearson Method; Data Obtained before Acid Hydrolysis Were Used Unless Indicated)
Content of Individual Phenolic Substances in Wild Strawberries
Seven clear peaks were observed in the hydrolyzed extracts with HPLC using a UV-Vis diode array detector ( and ). The peaks were tentatively identified by comparisons with the retention time and spectra of reference materials, and the interpretations were confirmed by rerunning the samples after adding the standard to the sample. The peaks identified included five phenolic substances, cyanidin (#3), pelargonidin (#4), ellagic acid (#5), quercetin (#6), and kaempferol (#7). For these substances, we found a fair agreement between the UV and visible spectra of the reference and the spectra from the samples when recorded from the peak during the HPLC analyses (). Peak #1 and #2 displayed larger differences between the reference and the recorded UV-Vis spectra. We also observed a peak widening when comparing samples with added reference. Thus, we interpret these differences as a result of derivatization of the phenols. A similar interpretation has previously been suggested by CitationMäättä et al. (2004). The content of each compound (), expressed as the sum in the water-soluble and water-insoluble extracts (μmol/g fw), ranged from 0.007 to 0.02 for quercetin, from 0.004 to 0.02 for kaempferol, from 1.0 to 3.8 for ellagic acid, from 0.004 to 0.03 for pelargonidin, and from 0.1 to 0.6 for cyaniding. Two peaks were identified as gallic acid derivatives and catechin derivatives showing similar UV spectra feature than gallic acid and catechin gallate, respectively.
FIGURE 1 Separation of the phenolic compounds in Fragaria vesca sample P2 (water insoluble fraction) at 280nm. Peak identification is described in
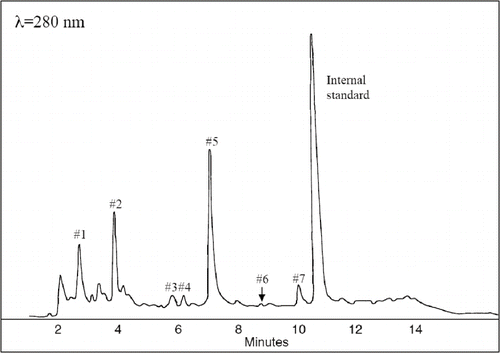
FIGURE 2 Separation of the anthocyaninds compounds in Fragaria vesca sample P2 (water insoluble fraction) at 530 nm. Peak identification is described in
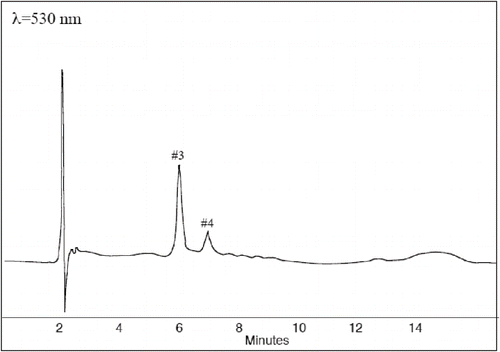
FIGURE 3 Online UV-Vis spectra of the identified compounds in Fragaria vesca in sample P2 (water insoluble fraction).
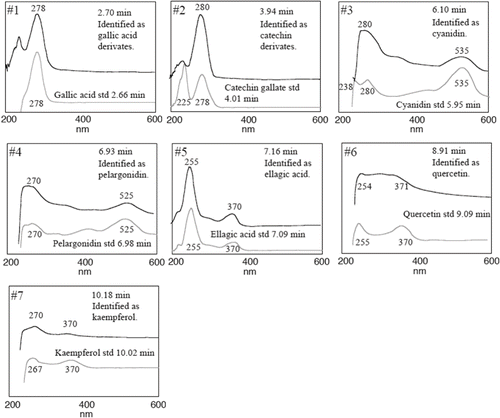
TABLE 7 Phenolic Compounds Present in Wild Strawberry Expressed as μmol per Gram of Fresh Weight
Ellagic acid
We found no previous data about the ellagic acid content in wild strawberries in the literature. The range 1 to 3.8 μmol/g fw of ellagic acid that we found was higher than that reported in different F. ananassa cultivars in the United Kingdom of 0.2–1.2 μmol/g fw (CitationAtkinson et al., 2006); 0.5–3 μmol/g dw; in Swedish cultivars (CitationOlsson et al., 2004), 1.2–1.9 μmol/g dw in cultivars in Finland and Poland (CitationHäkkinen and Törrönen, 2000); in cultivars from the United States, 0.14–1.5 μmol/g fw (CitationMaas et al., 1991); and from Argentina, 0.5–6.8 μmol/g dw (CitationWilliner et al., 2003).
Flavonols
The presence of quercetin and kaempferol is common in cultivated strawberries and in other berries as glycosides (CitationAaby et al., 2007; CitationHäkkinen and Törrönen, 2000; CitationMäättä et al., 2004; CitationOlsson et al., 2004; CitationSeeram et al., 2006). The content reported in the present work showed higher amounts than those reported for quercetin 3-glucuronide, kaempferol 3-glucuronide, and kampferol 3-glycoside in strawberry (F. ananassa cv. Jonsok) and raspberry and cloudberry (CitationMäättä et al., 2004); it was in a similar range as the data obtained by CitationHäkkinen et al. (2000) and CitationMaas et al. (1991).
Anthocyanins
In the present study, the presence of cyanidin and pelargonidin were observed after hydrolysis, in accordance with studies of different berry varieties (CitationCheel et al., 2007; CitationMäättä et al., 2004; CitationLopes–da–Silva et al., 2002; CitationGoiffon et al., 1991). In wild strawberries, the amount of cyanidin was higher than that of pelargonidin, which was found to be characteristic of F. vesca in comparison with other strawberry species (F. chiloensis and F. ananassa) (CitationCheel et al., 2007; CitationHong and Wrolstad, 1990; CitationMäättä et al., 2004).
Gallic acid and catechin derivatives
The gallic acid derivatives previously found in strawberries and other plants are mainly unconjugated ellagitannins, gallotannins, and conjugated forms of gallic acid (CitationSalminen et al., 1999). Catechin derivatives are flavan-3-ols derivatives found as monomers, as well as structural units in proanthocyanidin chains ranging from dimers to larger polymers. In the present work, two peaks with gallyol moiety characteristics in the UV spectra were observed after acid hydrolysis as defined by others (CitationMäättä et al., 2004; CitationSalminen et al., 1999).
Relation of Altitude to the Content of TAC, TPH, TF, and Individual Compounds
The relation between altitude and all measurements was examined by linear and nonparametric correlation analysis. Although several suggestive associations were observed, the only significant association was a negative correlation between altitude and the content of cyanidin. Several reports on the relationship between ultraviolet radiation and the content of phenolic compounds are available. CitationAtkinson et al. (2006) reported a significant increment in ellagic acid content using photosynthetically active radiation in strawberry cultivars. In another study, CitationBieza and Lois (2001) found an accumulation of flavonoids and phenolic compounds in mutant plants after exposure to lethal ultraviolet B levels, and CitationMiddleton and Teramura (1993) suggested that flavonoids may be involved in plant UV-B photoprotection, but only carotenoids were found to be directly linked to photoprotection of the photosynthetic function. Further studies regarding the content of antioxidant compounds in plants growing at high altitude are needed.
ACKNOWLEDGMENTS
This study was supported by the Swedish International Development Agency (SIDA/SAREC) in a collaborative project between Universidad Mayor de San Andrés (Bolivia) and Lund University (Sweden). Additional support was provided by Lund University Hospital, the Påhlsson Foundation, the Swedish Res. Council for Environment, Agr. Sciences and Spatial Planning (FORMAS), and the EU NoE ECNIS (No. 513943).
LITERATURE CITED
- Aaby , K. , Ekeberg , D. and Skrede , G. 2007 . Characterization of phenolic compounds in strawberry (Fragaria × ananassa) fruits by different HPLC detectors and contribution of individual compounds to total antioxidant capacity . J. Agr. Food Chem. , 55 : 4395 – 4412 .
- Atkinson , C. J. , Dodds , P.A.A. , Ford , Y.Y. , Le Mière , J. , Taylor , J.M. , Blake , P.S. and Paul , N. 2006 . Effects of cultivar, fruit and reflected photosynthetically active radiation on Fragaria × ananassa productivity and fruit ellagic acid and ascorbic acid concentrations . Ann. Bot. , 97 : 429 – 441 .
- Bahorun , T. , Luximon-Ramma , A. , Crozier , A. and Aruoma , O.L. 2004 . Total phenol, flavonoid, proanthocyanidin and vitamin C levels and antioxidant activities of Mauritian vegetables . J. Sci. Food Agr. , 84 : 1553 – 1561 .
- Benzie , I.F.F. and Strain , J.J. 1996 . The ferric reducing ability of plasma (FRAP) as a measure of “antioxidant power”: The FRAP assay . Anal. Biochem. , 239 : 70 – 76 .
- Bieza , K. and Lois , R. 2001 . An Arabidopsis mutant tolerant to lethal ultraviolet-B levels shows constitutively elevated accumulation of flavonoids and other phenolics . Plant Physiol. , 126 : 1105 – 1115 .
- Cheel , J. , Theoduloz , C. , Rodríguez , J.A. , Caligari , P.D.S. and Schmeda-Hirshmann , G. 2007 . Free radical scavenging activity and phenolic content in achenes and thalamus from Fragaria chiloensis ssp. chiloensis, F. vesca and F. ananassa cv . Chandler. Food Chem. , 102 : 36 – 44 .
- Chun , O.K. , Kim , D.O. , Smith , N. , Schroeder , D. , Han , J.T. and Lee , Y. 2005 . Daily consumption of phenolics and total antioxidant capacity from fruit and vegetables in the American diet . J. Sci. Food Agr. , 85 : 1715 – 1724 .
- Djeridane , A. , Yousfi , M. , Nadjemi , B. , Boutassouma , D. , Stocker , P. and Vidal , N. 2006 . Antioxidant activity of some Algerian medicinal plants extracts containing phenolics compounds . Food Chem. , 97 : 654 – 660 .
- Goiffon , J.P. , Brun , M. and Bourrier , M.J. 1991 . High-performance liquid chromatography of red fruit anthocyanins . J. Chromatogr. A. , 537 : 101 – 121 .
- Häkkinen , S.H. and Törrönen , A.R. 2000 . Content of Flavonols and selected phenolic acids in strawberries and Vaccinium species: Influence of cultivar, cultivation site and technique . Food Res. Intl. , 33 : 517 – 524 .
- Halvorsen , B.L. , Holte , K. , Myhrstad , M.C.W. , Barikmo , I. , Hvattum , E. , Fagertun , S. , Remberg , S. , Wold , A.B. , Haffner , K. , Bauger⊘d , H. , Frost Andersen , L. , Moskaug , Ø.J. , Jacobs , J.D.R. Jr. and Blomhoff , R. 2002 . A systematic screening of total antioxidants in dietary plants . J. Nutr. , 132 : 461 – 471 .
- Hancock , J.F. and Luby , J.J. 1993 . Genetic resources at our doorstep: The wild strawberries . BioScience , 43 : 141 – 147 .
- Heinonen , M. , Meyer , A.S. and Frankel , E.N. 1998 . Antioxidant activity of berry phenolics on human low-density lipoprotein and liposome oxidation . J. Agr. Food Chem. , 46 : 4107 – 4112 .
- Hong , V. and Wrolstad , R.E. 1990 . Characterization of anthocyanin-containing colorants and fruit juices by HPLC/photodiode array detection . J. Agr. Food Chem. , 38 : 698 – 708 .
- Kähkönen , M.P. , Hopia , A.I. , Vuorela , H.J. , Rauha , J.P. , Pihlaja , K. , Kujala , T.S. and Heinonen , M. 1999 . Antioxidant activity of plant extracts containing phenolic compounds . J. Agr. Food Chem. , 47 : 3954 – 3962 .
- Klopotek , Y. , Otto , K. and Böhm , V. 2005 . Processing strawberries to different products alters contents of vitamin C, total phenolics, total anthocyanins, and antioxidant capacity . J. Agr. Food Chem. , 53 : 5640 – 5646 .
- Lopes-da-Silva , F. , de Pascual-Teresa , S. , Rivas-Gonzalo , J. and Santos-Buelga , C. 2002 . Identification of anthocyanin pigments in strawberry (cv. Camarosa) by LC using DAD and ESI-MS detection. European Food Res . Technol. , 214 : 248 – 253 .
- Maas , J.L , Wang , S.Y. and Galletta , G.J. 1991 . Evaluation of strawberry cultivars for ellagic acid content . HortScience , 26 : 66 – 68 .
- Määttä , K.R. , Kamal-Eldin , A. and Törrönen , A.R. 2004 . Identification and quantification of phenolic compounds in berries of Fragaria and Rubus species (Family Rosaceae) . J. Agr. Food Chem. , 52 : 6178 – 6187 .
- Macrea , R. 1982 . HPLC in food analysis , New York : Academic Press .
- Middleton , E.M. and Teramura , A.H. 1993 . The role of flavonol glycosides and carotenoids in protecting soybean from ultraviolet-B damage . Plant Physiol. , 103 : 741 – 752 .
- Navarro , G. and Maldonado , M. 1994 . Geografía y recursos naturales de Bolivia , La Paz : Academia de Ciencias de Bolivia .
- Nilsson , J. , Pillai , D. , Önning , G. , Persson , C. , Nilsson , Å. and Åkesson , B. 2005 . Comparison of the ABTS and FRAP methods to assess the total antioxidant capacity in extracts of fruit and vegetables . Mol. Nutr. Food Res. , 49 : 239 – 246 .
- Olsson , M.E. , Ekvall , J. , Gustavsson , K.E. , Nilsson , J. , Pillai , D. , Sjöholm , I. , Svensson , U. , Åkesson , B. and Nyman , M.G.L. 2004 . Antioxidants, low molecular weight carbohydrates, and total antioxidant capacity in strawberries (Fragaria x ananassa)—Effects of cultivar, ripening and storage . J. Agr. Food Chem. , 52 : 2490 – 2498 .
- Pellegrini , N. , Serafini , M. , Colombi , B. , Del Rio , D. , Salvatore , S. , Bianchi , M. and Brighenti , F. 2003 . Total antioxidant capacity of plant foods, beverages and oils consumed in Italy assessed by three different in vitro assays . J. Nutr. , 133 : 2812 – 2819 .
- Peñarrieta , J.M. , Alvarado , J.A. , Åkesson , B. and Bergenståhl , B. 2008 . Total antioxidant capacity and content of flavonoids and other phenolic compounds in canihua (Chenopodium pallidicaule): An Andean pseudocereal . Mol. Nutr. Food Res. , 52 : 708 – 717 .
- Proteggente , A.R. , Pannala , A.S. , Paganga , G. , Van Buren , L. , Wagner , E. , Wiseman , S. , Van de Put , F. , Dacombe , C. and Rice-Evans , C. 2002 . The antioxidant activity of regularly consumed fruit and vegetables reflects their phenolics and vitamin C composition . Free Radicals Res. , 36 : 217 – 233 .
- Re , R. , Pellegrini , N. , Proteggente , A. , Pannala , A. , Yang , M. and Rice- Evans , C. 1999 . Antioxidant activity applying an improved ABTS radical cation decolorization assay . Free Radicals Biol. Med. , 26 : 1231 – 1237 .
- Salminen , J.P. , Ossipov , V. , Loponen , J. , Haukioja , E. and Pihlaja , K. 1999 . Characterisation of hydrolyzable tannins from leaves of Betula pubescens by high-performance liquid chromatography-mass spectrometry . J. Chromatogr. A , 864 : 283 – 291 .
- Saura-Calixto , F. and Goni , I. 2006 . Antioxidant capacity of the Spanish mediterranean diet . Food Chem. , 94 : 442 – 447 .
- Scalzo , J. , Politi , A. , Pellegrini , N. , Mezzetti , B. and Battino , M. 2005 . Plant genotype affects total antioxidant capacity and phenolics content in fruit . Nutrition , 21 : 201 – 213 .
- Seeram , N.P. , Lee , R. , Scheuller , H.S. and Heber , D. 2006 . Identification of phenolic compounds in strawberries by liquid chromatography electrospray ionization mass spectroscopy . Food Chem. , 97 : 1 – 11 .
- Singleton , V.L. and Rossi , J.A. Jr. 1965 . Colorimetry of total phenolics with phosphomolybdic-phosphotungstic acid reagent . Amer. J. Enology Viticult. , 16 : 144 – 158 .
- Thaipong , K. , Boonprakob , U. , Crosby , K. , Cisneros-Zevallos , L. and Byrne , H.D. 2006 . Comparison of ABTS, DPPH, FRAP, and ORAC assays for estimating antioxidant activity from guava fruit extracts . J. Agr. Food Chem. , 19 : 669 – 665 .
- Verzelloni , E. , Tagliazucchi , D. and Conte , A. 2007 . Relationship between the antioxidant properties and the phenolic and flavonoid content in traditional balsamic vinegar . Food Chem. , 105 : 564 – 571 .
- Wang , S.Y. and Zheng , W. 2001 . Effect of plant growth temperature on antioxidant capacity in strawberry . J. Agr. Food Chem. , 49 : 4977 – 4982 .
- Wedge , D.E. , Kumudini , M.M. , James , B.M. , Smith , S.H. , Huang , G. and Larcom , L.L. 2001 . Anticarcinogenic activity of strawberry, blueberry, and raspberry extracts to breast and cervical cancer cells . J. Med. Food. , 4 : 49 – 51 .
- Williner , M.R. , Pirovani , M.E. and Güemes , D.R. 2003 . Ellagic acid content in strawberries of different cultivars and ripening stages . J. Sci. Food Agr. , 83 : 842 – 845 .
- Zhishen , J. , Mengcheng , T. and Jianming , W. 1999 . Determination of flavonoid contents in mulberry and their scavenging effects on superoxide radicals . Food Chem. , 64 : 555 – 559 .