Abstract
This study was developed to determine the nutrient distribution within a ‘Tifblue’ rabbiteye (Vaccinium ashei Reade) blueberry. Rooted cuttings were potted into 3.8-liter containers and placed into a completely randomized design on a covered bench. Plants were divided evenly into three groups for low, high, and control fertilization. At the end of the growing season, sample plants were each divided into leaves, upper stems, lower stems, trunk, root ball, and fine roots, and were then dried. Mineral analysis was preformed and mineral distribution determined. Approximately 25% of nitrogen found in blueberry plants was located in the leaves, with the remaining 75% being distributed evenly throughout the more woody partitions. Phosphorus was more evenly distributed, yet the highest concentration was also found in the leaves (0.14% P). Potassium was found at a much higher concentration in the leaves (0.79% K). Mineral distribution varied very little with the rate of fertilization, but varied greatly across plant organs.
INTRODUCTION
Wild rabbiteye blueberries were introduced into cultivation in northeast Florida in 1887 (CitationCochran, 1941). Breeding research, which began in the early 1900s with the efforts of Elizabeth White and Dr. Frederick Coville to domesticate the wild highbush blueberry, resulted in today's cultivated highbush blueberry industry (Whitesbog.org). Further breeding research began on rabbiteye blueberries in the mid 1920s in Georgia (CitationBrightwell et al., 1955). Blueberry cultural practices and pest control research followed the breeding efforts. Therefore, many of the cultural practices and recommendations have been established by region and species.
Young rabbiteye blueberry plants have been found to be very sensitive to fertilizer. CitationAustin and Brightwell (1977) found that inorganic fertilizer can severely damage young plants. In fact, fertilizer recommendations for first year plants range from none (CitationScott et al., 1978) to five small applications of 115–150 grams of 8N-5P2O5-7K2O per plant (CitationBrooks, 1970). CitationSpiers (1982) found that organic matter incorporated before planting and irrigation positively affected growth, but fertilization was usually detrimental to plant growth of young rabbiteye blueberries. Countless papers have been written on the elemental content and effects of fertilization on leaf tissue as a basis for maintaining the health of the blueberry plant. The purpose of this research was to examine the macronutrient distribution throughout the other rabbiteye blueberry plant fractions.
MATERIALS AND METHODS
Rooted cuttings were purchased and potted into 3.8-liter plastic pots with a mixture of ground pinebark:peatmoss:sand, 1:1:1 by volume. Pots were placed on a metal structure 1 m wide × 4 m long with 22 cm between plants to allow for growth. The structure was built with metal pipe with a wire mesh bottom for sufficient drainage. Plants were held 1 m off the ground and covered 1 m above plant height with bird netting. Rooted cuttings were allowed to grow for a year in pots with no fertilization and watered as needed. Six replications of individual plants were fertilized at two rates. A high rate consisted of 28.35 g 14 N-8 P205-8 K2O every 2 months (March/May/July/September) and a low rate consisted of 28.35 g 14 N-8 P205-8 K2O every 4 months (March/July). Fertilization rates were increased to 56.70 g/plant to compensate for the plant growth.
At the end of each season, entire plants were divided into sections: leaves, upper stems, lower stems, trunk, root ball, and fine roots. Each part was dried and their weight recorded. Whole plant samples were constructed by removing 1/10 of each fraction sample and combined. Plants not harvested were repotted into larger pots to accommodate growth for the following year. Control plants were divided before any fertilization was applied. Mineral analysis was preformed by the Mississippi State University Soils Lab. Percentage of nitrogen, phosphorus, potassium, calcium, and magnesium was determined.
Data was analyzed by SAS v 9.1 (SAS Institute, Cary, NC, USA). Comparisons among means were detected using analysis of variance (ANOVA). The means were separated by Least Significant Difference (LSD) at P = 0.05 level.
RESULTS AND DISCUSSION
Nitrogen
A significant difference in distribution was found between years, so each analysis is displayed separately (). In year 1, there was no significant difference found between rates of fertilization and the control, yet in year 2 the fertilized plants had significantly higher rates of nitrogen throughout the plant than did controls. After 1 year of fertilization, nitrogen was almost evenly distributed throughout the plants, but by year 2 the nitrogen was more localized, with the most nitrogen found in the leaves (1.84%) and then in the small (1.35%) and large (1.46%) roots. The trunk of the blueberry was found to have the least amount of nitrogen with 0.93% in year 2. Nitrogen is a constituent of many molecules within the plant including chlorophyll. Nitrogen is also a very mobile element within the plant. As older leaves yellow and die, the N is exported to the younger developing leaves and shoots (CitationHopkins, 1995). It is, therefore, not surprising that the greatest amount of N is found in the leaves.
TABLE 1 Macronutrient Distribution in ‘Tifblue’ Rabbietye Blueberry
Phosphorus
Phosphorus (P) is found largely as phosphate esters and utilized by the plant in roles related to photosynthesis, intermediary metabolism nucleotides that make up DNA and RNA, as well as phospholids present in membranes. P is also found in the form of ATP, ADP, and phosphorylated sugars and phosphorylated organic acids, which play a role in energy metabolism (CitationHopkins, 1995). Therefore, P is found more evenly distributed throughout the entire blueberry plant. There was no significant difference in distribution of P between years, therefore, analysis was combined. Overall, a higher concentration of P was found in fertilized plants than in non-fertilized plants. The highest concentration of P within the plant was found in the leaves (0.14%), followed by the larger roots (0.11%), root ball (.010%), and the stem (0.09%).
Potassium
Potassium (K) activates a number of enzymes involved in photosynthesis and respiration (CitationHopkins, 1995). Potassium is also a principle factor in plant movements, such as stomatal guard cells opening and closing and the daily changes in orientation of leaves. Hence, finding K at the highest concentration in the leaves would be expected. Potassium was not significantly higher in fertilized plants than in control plants in 2001. The highest concentration of K was found in the stem. It is suspected that the leaves would have been higher than the stems in 2001, but there were not sufficient leaves available for the mineral analysis. In 2002, the K concentration was significantly greater in the leaves (0.79%) than in the other portions of the plant (0.24–0.16%). Also, in 2002, the high rate of fertilization yielded higher K within the plant than did the control or the lower rate of fertilization.
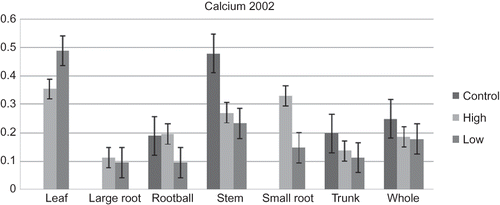
Calcium
In 2001, there was no significant increase in calcium (Ca) concentration in fertilized plants compared to control plants. The highest concentration of Ca was found in the stems in 2001; but we suspect that the leaves would have had a higher concentration of Ca had there been sufficient leaves for sampling. In 2002, the leaves (0.42%) had a higher concentration of Ca, with the stems (0.34%) having the next highest concentration. Since Ca is important to dividing cells by playing a role in mitotic spindle development and calcium pectate forming the middle lamella of cell plates between cells, it is not surprising that Ca was found primarily in the leaves and stem portions of the plant. These portions are the primary sites for meristematic activity.
For Ca concentrations, there was a significant interaction between fertilization rate and plant part (). In control plants, the stems had the majority of the calcium. In plants with the low rate of fertilization, the leaf followed by the stem held the majority of Ca. In the high rate of fertilization, the leaf and the small roots held the majority of the Ca.
FIGURE 1 Percent calcium in ‘Tifblue’ rabbiteye blueberry as affected by fertilization rate and plant part (n = 6).
Magnesium
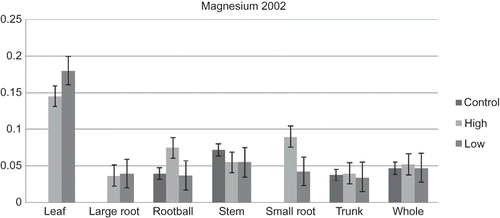
Magnesium (Mg) was similar to Ca, in that Mg showed no significant increase in concentration in fertilized plants, compared to control plants. Also, the highest concentration of magnesium was found in the stems in 2001, and again it is suspected that the leaves would have had a higher concentration of magnesium had there been sufficient leaves for sampling. In 2002, the leaves (0.163%) had a higher concentration of Mg with the stems (0.062%) and roots (0.055% and 0.049%) having decreasing concentrations. Magnesium has many important functions within a plant. It is critical for photosynthesis because it is the central ion in the porphyrin moiety of the chlorophyll molecule (CitationHopkins, 1995). Magnesium is also utilized to stabilize ribosomal structure and to activate enzymes, including both critical enzymes for photosynthetic carbon fixation.
A significant interaction between fertilization rates and plant parts () for Mg concentrations was found. The stems of control plants held the largest concentration of magnesium. With the low rate of fertilization, Mg was found mostly in the leaves, but otherwise was relatively evenly distributed throughout the plant. Plants receiving a high rate of fertilization again had the majority of Mg in the leaves, but the roots had the next highest concentrations.
FIGURE 2 Percent magnesium in ‘Tifblue’ rabbiteye blueberry as affected by fertilization rate and plant part (n = 6).
CONCLUSIONS
Approximately 25% of nitrogen found in blueberry plants was located in the leaves, with the remaining 75% being distributed evenly throughout the more woody partitions. Phosphorus was more evenly distributed, yet the highest concentration was also found in the leaves (0.14% P). Potassium was found at a much higher concentration in the leaves (0.79% K). Mineral distribution varied very little with the rate of fertilization, but varied greatly across plant organs.
Notes
This article not subject to US copyright law.
LITERATURE CITED
- Austin , M.E. and Brightwell , W.T. 1977 . Effect of fertilizer application on yield of rabbiteye blueberries . J. Amer. Soc. Hort. Sci. , 102 : 36 – 39 .
- Brightwell , W.T. , Woodard , O.J. , Darrow , G.M. and Scott , D.H. 1955 . Observations on breeding blueberries for the Southeast . Proc. Amer. Soc. Hort. Sci. , 65 : 274 – 278 .
- Brooks , J.C. 1970 . Blueberries—Production guide for North Carolina . N.C. Agr. Ext. Ser. Ext. Cir. , : 474
- Cochran , H. 1941 . Blueberries with special reference to Florida culture . Fla. State Dep. Agric. Bull. , : 33
- Hopkins , W.G. 1995 . “ Plants and inorganic nutrients ” . In Introduction to plant physiology , Second , New York , NY : John Wiley & Son Inc .
- Scott , D.H. , Draper , A.D. and Darrow , G.M. 1978 . Commercial blueberry growing , 13 – 24 . 2254 Farmers Slate : U.S. Dept. of Agr .
- Spiers , J.M. 1982 . Fertilization, incorporated organic matter and early growth of rabbiteye blueberries . J. Amer. Soc. Hort. Sci. , 107 : 255 – 257 .
- The History of Whitesbog. Historic Architectural Survey and Preservation Planning project for the Village of Whitesbog, Burlington and Ocean Counties, NJ, by the Historic Conservation & Interpretation, Inc. 25 May 2009. http://www.whitesbog.org/whitesboghistory/history1.htm (http://www.whitesbog.org/whitesboghistory/history1.htm)