
Abstract
In this work, fruit-derived products were enriched with a fructooligosaccharide, inulin, obtained from tubers of Jerusalem artichoke (Helianthus tuberosus). The products developed included juices and jams from various fruits and were analyzed in terms of chemical, microbiological, and sensorial properties right after production and again after storage. The comparison of the results before and after storage would allow establishing the conservation ability of the products developed. The results obtained allowed concluding that the products obtained contained a high content of inulin, which is a prebiotic compound with important benefits for gut health.
INTRODUCTION
Diet has a pronounced influence on human wellbeing, either at the physical or psychological levels. Nowadays, industrialized countries face significant challenges related to public health, such as the reduction of costs related to diseases, the need to offer the aging population a higher quality of life, or to provide consumers with a wider choice of healthier “ready to eat” foods. Since early times, humans have attributed to nutrition a functional role in health and well-being (Alkerwi, Citation2014).
The diet includes functional foods as a mean of improving several functions of the body aimed at providing a better health and well-being. The last decade has seen an increase in the development of food ingredients, such as probiotics and prebiotics, which promise to improve gut health and confer benefits beyond nutritional value (Adebola et al., Citation2014).
Prebiotics are indigestible food ingredients that act as substrates for probiotic growth in vivo (Huebner et al., Citation2007). Nowadays, examples of indigestible carbohydrates used as prebiotics include disaccharides, fructooligosaccharides, oligosaccharides, and polysaccharides (Adebola et al., Citation2014; Saarela et al., Citation2003).
The daily intake of fructooligosaccharides (FOS) is beneficial to human health due to their prebiotic effect, acting as anticarcinogenic, antimicrobial, hypolipidemic, and hypoglycaemic agents. Moreover, they can also improve the absorption of minerals and have proven valuable in fighting diseases, such as osteoporosis or diabetes (Guiné et al., Citation2010).
Inulin is a naturally occurring fructooligosaccharide that has been commonly used as a prebiotic (Akın et al., Citation2007). Inulin is a carbohydrate synthesized by many plants consisting of fructose. This nutrient is considered a soluble dietary fiber and is called a prebiotic because it is a nutrient that serves as food for intestinal bacteria. It is resistant to the action of gastric enzymes, not undergoing digestion in the stomach, reaching the intestine intact where it influences the bowel function. Despite being a sugar it can be used by diabetics because it does not alter glycaemia (Kaur and Gupta, Citation2002).
Excessive sucrose intake is the leading cause of obesity and diabetes. According to Yu et al. (Citation2014), epidemiological data have continually established a strong positive association between the consumption of sugars and the development of type 2 diabetes mellitus. Malik et al. (Citation2010) reported that a single serving of a sugar-sweetened beverage per day increases the risk of diabetes by about 15%.
Fructose is a monosaccharide found naturally in fruits, which is added as a sweetener to beverages and processed snacks (Couch et al., Citation2013). Fructose, due to low energy, slow absorption, and fast metabolic transformation, is beneficial for persons suffering from obesity or diabetes. While high fructose benefits glucose control (Cozma et al., Citation2012), high fructose intakes could have potentially negative consequences increasing the risk factors for cardiovascular diseases, since intakes of the carbohydrates are known to increase fatty acid and triglyceride synthesis (Sánchez-Lozada et al., Citation2008).
This work aims to present a study that focuses on the development of fruit-derived products enriched with inulin obtained from the Jerusalem artichoke.
MATERIALS AND METHODS
Materials
The raw materials used for this study were apple cv. Golden Delicious (Malus domestica), orange cv. Valencia (Citrus sinensis), peach cv. Granada (Prunus persica), wild cherry (Prunus cerasus), blueberry cv. Bluecrop (Vaccinium corymbosum), blackberry (Rubus fruticosus), white mulberry (Morus alba), and Jerusalem artichoke (Helianthus tuberosus).
For the preparation of the concentrates the fruits were cut and pressed, and the resulting concentrate was obtained by centrifugation. This procedure was also adopted for obtaining the artichoke concentrate.
The pulps were obtained by removing the peel and seeds when applicable.
Sample Preparation
Eight different fruit juices with variable contents of artichoke concentrate were produced for this study, as shown in . The ingredients were mixed with water to obtain a homogeneous solution completing a volume of 1 L that was heated at 90°C for 15 min, followed by pasteurization for 20 min at 92°C.
TABLE 1 Formulation of Fruit Juices Studied Supplemented with Artichoke Concentrate
The products were analyzed right after preparation. Then, the samples that were stored in the refrigerator at around 4°C, with no exposure to sunlight. The analyses were repeated after 30 days and again after 60 days.
Also, four fruit jams with high inulin content were prepared according to the general formulation in . The artichoke pulp was added in variable concentrations and so was the fructose (pure), while the percentage of fruit pulp was constant in all cases. For these, the mixtures were heated at 95°C for 5 min and the jars were then pasteurized at 92°C for 20 min. The storage was under the same conditions as above.
TABLE 2 Formulation of Fruit Jams Studied Supplemented with Artichoke Pulp
Physical-Chemical Analyses
The determination of carbohydrates and reducing sugars was done according to standard methodologies (AOAC, Citation2000). The spectrophotometry by UV method (absorbencies at 340 nm) was used for the determination of sucrose, fructose, and glucose (Davim, Citation2007).
Microbiological Analyses
The method used in this study for microbiological analyses was the method of plate incorporation and scattering. The culture medium was solidified in petri dishes, and dilutions were made from the emulsified material. One drop (about 0.05 ml) of the dilution was placed in the center of a petri dish and spread; this was then allowed to dry for 1–2 h before turning it upside down. Finally, it was incubated at 30°C (Davim, Citation2007).
Sensory Analyses
Sensory analysis is a tool for quality assurance and is an integral part of market research. There are, in a generic way, four types of sensory attributes in food: appearance, odor, flavor, and texture attributes. The measuring instrument of a sensory analysis laboratory is the panel, which consists of trained assessors (selected), untrained (consumers), or specialists. In this research, a panel of 30 untrained tasters was used, and the attributes analyzed in a 0–100 scale were color intensity, aroma intensity, density/consistency, fruit aroma, sweet taste, acid taste, and overall assessment.
RESULTS AND DISCUSSION
Physical-Chemical Composition
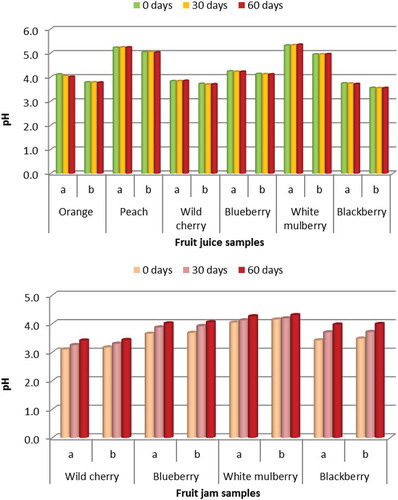
The results in showed that the pH in the fruit juices analyzed was slightly higher in the version a (with 80 g of artichoke concentrate) when compared with the version b (40 g of artichoke concentrate); therefore, the addition of a higher amount of artichoke concentrate contributed for a slight decrease in acidity. Furthermore, it was observed that pH did not vary during storage for the 2 months considered in the study. Finally, comparing the different varieties of juice developed, those that were more acid were orange, wild cherry, and blackberry, whereas those with less acid were peach and white mulberry. also showed that for the jams the pH was lower for the wild cherry jam and higher for the white mulberry jam, and in this case there is a variation in pH during storage, although not very intense.
FIGURE 1 Measured pH of the different juices (top) and jams (bottom) studied according to storage time: before storage, after 30 days, and after 60 days.
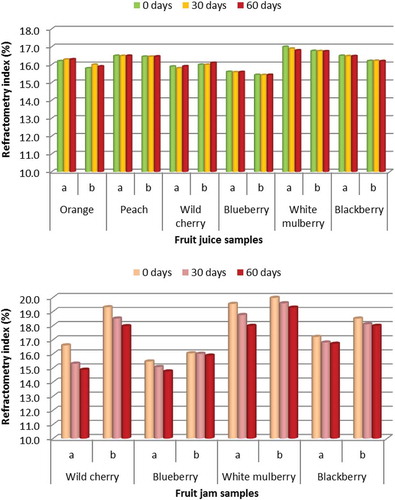
revealed that the refractometry index, which measures the total soluble solids in the samples, was not affected by storage in the case of the juices; but on the other hand, for the jams it decreased during storage. The mulberry juice presented higher pH, being less acid, and higher refractometry index, being sweeter.
FIGURE 2 Measured refractometry index of the different juices (top) and jams (bottom) studied according to storage time: before storage, after 30 days, and after 60 days.
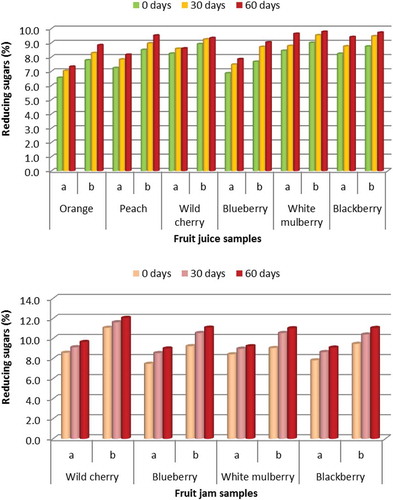
The results in and showed that the total sugars and reducing sugars increased during storage for the juices as well as the jams. The results indicated that in all samples the major part of sugars corresponds to reducing sugars, which generally represent more than half of total sugars. Before storage, the samples that presented the smaller fraction of reducing sugars were the orange juice (a) with a higher amount of artichoke concentrate (49% reducing sugars) and the white mulberry jam (b) with a higher percentage of artichoke pulp (59% reducing sugars). After 2 months of storage the samples that presented the smaller fraction of reducing sugars were the orange juice (a), which had 46% reducing sugars, and the white mulberry jam (a) with 66% reducing sugars. The samples that showed the higher amounts of reducing sugars were the wild cherry juice (b) before storage (72%) and the blackberry juice (b) after storage (65%), whereas for the jams they were before storage the wild cherry (a) and (b) with 82% and after storage the same samples with 87% and 89%, respectively, for versions (a) and (b). The results further showed that two months of storage slightly decreased the amount of reducing sugars by 3% on average in the fruit juices and increased by 8% on average in the fruit jams. Finally, when comparing versions (a) and (b) in the fruit juices, the total sugars were higher when the juices contained a higher amount of artichoke concentrate, version (a), and the reducing sugars were also higher in the same version. For the jams, total sugars and reducing sugars were higher in version (b), which contained the higher amount of artichoke pulp. Therefore, the addition of a higher percentage of artichoke increased total sugars as well as reducing sugars. Reducing sugars have an aldehyde group or are capable of forming one in solution through isomerism, and include monosaccharides, such as glucose, fructose, and galactose. Still, some disaccharides, like lactose and maltose, also have a reducing form. On the other hand, the disaccharide sucrose, in which the anomeric carbons of the two units are linked together, is a non-reducing sugar since neither of the rings is capable of opening (Osborn, Citation2003).
FIGURE 3 Measured total sugars content of the different juices (top) and jams (bottom) studied according to storage time: before storage, after 30 days, and after 60 days.
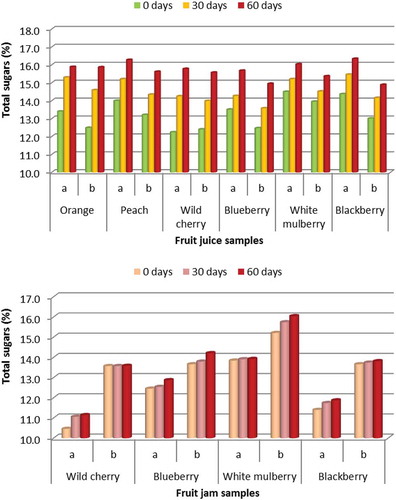
FIGURE 4 Measured reducing sugars content of the different juices (top) and jams (bottom) studied according to storage time: before storage, after 30 days, and after 60 days.
shows the results for the inulin (oligofructose + sucrose) in the fruit juices and jams during the 2 months of storage. It could be observed that the addition of a higher amount of concentrate of Jerusalem artichoke improved the products composition by increasing the concentration of oligofructose. All samples of juice in version (a), with a higher quantity of artichoke concentrate, showed greater amounts of oligofructose when compared with the corresponding versions (b). For example, before storage, samples (a) had on average 8% more inulin than samples (b), whereas after 30 days of storage that difference was on average 7% and after 60 days of storage it was 9%. For the samples of jam, the same trend was observed, and the versions with a higher percentage of artichoke pulp, versions (b), presented higher amounts of inulin, and in this case the difference was more significant: 18% more on average in all moments of analysis (0, 30, or 60 days of storage). Finally, it is important to note that there were no significant differences between the content of inulin in the jams before and after storage, around 9%. On the other hand, the contents of inulin in the juices increased with storage by about 23%.
TABLE 3 Quantified Amount of Inulin in the Fruit Juices and Jams before and after Storage
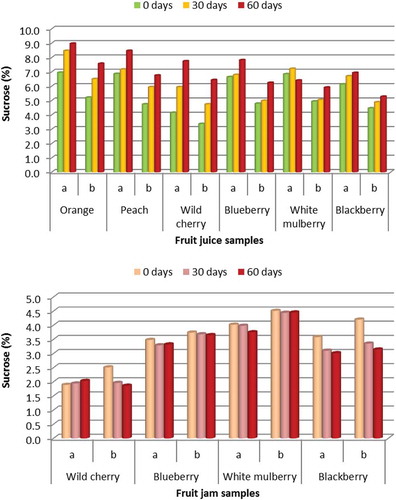
shows the amount of sucrose, a non-reducing sugar, in the samples of juices and jams during storage. For the juices, sucrose slightly increased during storage, and was generally higher in versions (a), with a higher amount of artichoke concentrate. For the jams, the trends were not so obvious, and in this case the storage tended to maintain or diminish the sucrose content, and no noticeable differences were observed among the two versions: (a) and (b) with different amounts of artichoke pulp.
FIGURE 5 Measured sucrose content of the different juices (top) and jams (bottom) studied according to storage time: before storage, after 30 days, and after 60 days.
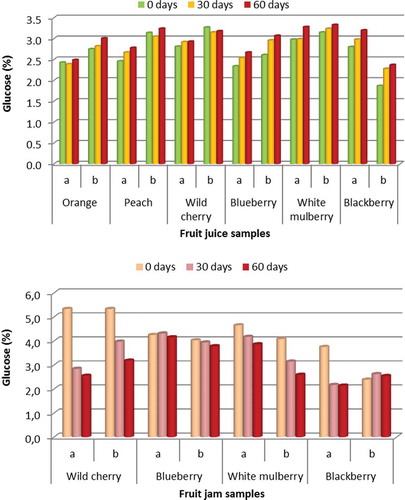
and show the reducing sugars, fructose and glucose, respectively. The results in indicate that fructose increased during storage for all samples of juice, while it decreased for the samples of jam. The same could be observed in for glucose. From the viewpoint of the composition of the different types of sugars, the samples with the best features are the peach, white mulberry, and blackberry juices. These contain a higher amount of Jerusalem artichoke concentrate: 9.79%, 9.73%, and 9.71%, respectively, for peach, white mulberry, and blackberry juices. Besides the high amount of oligofructose, they contain high fructose content and an advantageous fructose/glucose ratio. Renuka et al. (Citation2009) studied the fortification of selected fruit juice beverages (including orange juice) with fructooligosaccharides (FOS), a low calorie prebiotic, and the results indicated that sucrose, which is usually used as a sweetener in fruit juice beverages, could be partially substituted with FOS without significantly affecting the overall quality. Krasaekoopt and Watcharapoka (Citation2014) studied the effect of addition of inulin and galactooligosaccharide (GOS) on the survival of microencapsulated probiotics in fruit juice and found that the level of encapsulated probiotics containing GOS was high in orange juice during storage.
FIGURE 6 Measured fructose content of the different juices (top) and jams (bottom) studied according to storage time: before storage, after 30 days, and after 60 days.
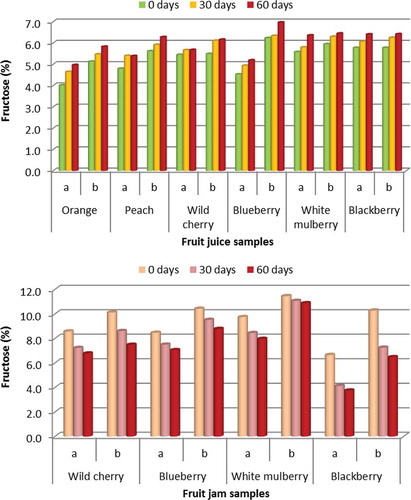
FIGURE 7 Measured glucose content of the different juices (top) and jams (bottom) studied according to storage time: before storage, after 30 days, and after 60 days.
Microbiological Results
The results of the microbiological analyses obtained for the juices and jams showed that after 3 days of incubation at 30°C the petri dishes showed no colony formation in all cases. This was confirmed 1 week later and also after storage periods of 1 and 2 months. Thus, one can conclude that the pasteurization carried out was efficient at ensuring the destruction of mesophilic microorganisms (especially fungi and yeasts). Pala and Toklucu (Citation2013) reported the microbial stability of UV-C processed orange juice during refrigerated storage.
Sensory Evaluation
The sensory characteristics of both orange juices can be compared in . Sample (a) contained a greater proportion of Jerusalem artichoke concentrate than sample (b). However, the difference in composition did not cause noticeable differences in terms of quality perception, except for the color intensity, which is higher in version (b). Still, there is a slight preference for product (b), detectable by the slightly higher classification assigned to the global appreciation, although the tasters have not identified noticeable differences in aspects, such as sweetness, acidity, aroma, or density. shows the results for the peach juices. It was noted that, with regard to sensory properties of both samples, the acid flavor is dominant. Also, in this case the difference in composition did not significantly alter the perception of the panelists, who rated both products very similarly. In are shown the results for the wild cherry juices. In general, samples (a) and (b) were quite similar, and therefore the addition of a higher amount of Jerusalem artichoke concentrate did not influence the juice sensory characteristics. represents the sensorial profile of the blueberry juices, and once again the results showed that no noticeable preference was identified by the panelists. In fact, sample (a) was slightly preferred in relation to aroma intensity, sweetness, or density, while sample (b) was slightly preferred in relation to the other attibutes. For the white mulberry juices (), the results also indicated that the addition of a higher amount of artichoke concentrate did not alter the sensorial characteristcs, with sample (a) gathering scores very similar to sample (b). Finally the results for the blackberry juices in revealed that, despite quite similar scores in the different sensorial attributes evaluated, the panelists slightly preferred sample (b), with less amount of artichoke concentrate, as seen by the scores of the global appreciation.
FIGURE 8 Sensorial characteristics of the juices studied: (A) orange, (B) peach, (C) wild cherry, (D) blueberry, (E) white mulberry, and (F) blackberry.
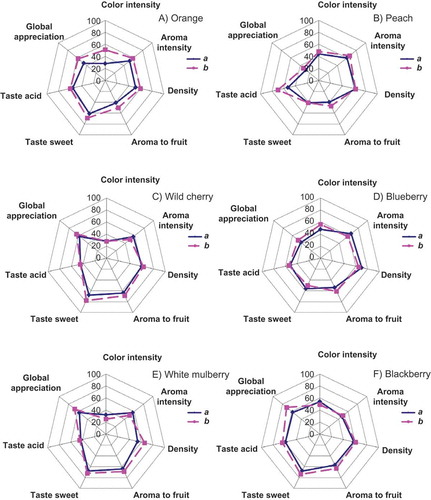
The graphs in also showed that the color intensity was higher for the blueberry and blackberry juices. Reque et al. (Citation2014) studied the cold storage of blueberry juice and the corresponding anthocyanin stability and they observed a loss of anthocyanins during cold storage of blueberry juice and concluded that their study improved knowledge about blueberry bioactive stability in domestic conservation.
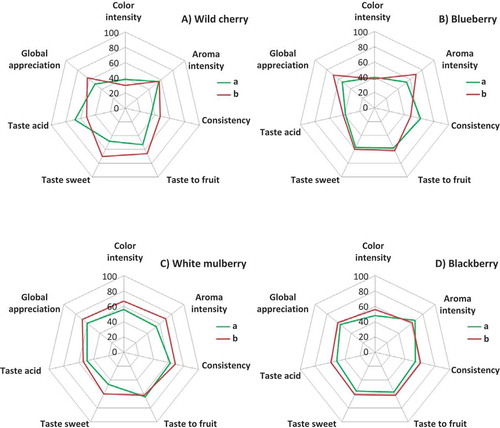
The graphs in show the sensorial profiles obtained for the different jams prepared in this research. In general, versions (b), with a higher percentage of artichoke pulp, have slightly higher scores, thus indicating the preference of the panelists. This is particularly perceptible for the wild cherry and white mulberry jams. Still the blueberry jam was preferred in attributes, such as aroma intensity and global appreciation, and the blackberry jam in all attributes except the aroma intensity. In general, it was observed that the heat treatment damaged color intensity, and particularly for wild berry, blueberry, and blackberry jams. This could be attributed to some degradation of anthocyanins when subjected to high temperature, which is decisive for the color of the product. Wang and Xu (Citation2007) evaluated the thermal degradation of the anthocyanins in blackberry juice and concentrates and concluded that this follows first-order kinetics, and the effect of temperature can be represented by an equation of the Arrhenius type. The wild fruits are quite rich in natural anthocyanins (Salvatierra et al., Citation2010), and in this way the effect of temperature on their degradation causes a noticeable loss of color (Aramwit et al., Citation2010). White mulberry jam presented higher scores for color intensity, which is expected given that it is a clearer jam, and thus not so much susceptible to color change due to thermal degradation of phenolic compounds responsible for the color.
FIGURE 9 Sensorial characteristics of jams studied: (A) wild cherry, (B) blueberry, (C) white mulberry, and (D) blackberry.
CONCLUSIONS
The results of this study show that the products obtained contained a high content of inulin and oligofructose, while the amount of sucrose (non-reducing sugars) was lower than the quantity of reducing sugars (fructose and glucose).
Through the microbiological analyses carried out, it was concluded that the thermal process the products have undergone (pasteurization) increased their shelf life, and for the two-month period of storage no important loss of quality was observed.
The sensory analysis conducted showed that some products were organoleptically accepted by the panel, while some other products should be further developed in order to improve the sensory characteristics that were evaluated with lower scores.
LITERATURE CITED
- Adebola, O.O., O. Corcoran, and W.A. Morgan. 2014. Synbiotics: The impact of potential prebiotics inulin, lactulose and lactobionic acid on the survival and growth of lactobacilli probiotics. J. Func. Foods 10:75–84.
- Akın, M.B., M.S. Akın, and Z. Kırmacı. 2007. Effects of inulin and sugar levels on the viability of yogurt and probiotic bacteria and the physical and sensory characteristics in probiotic ice-cream. Food Chem. 104(1):93–99.
- Alkerwi, A. 2014. Diet quality concept. Nutrition 30(6):613–618.
- AOAC. 2000. Official methods of analysis. 17th ed. Association of Official Analytical Chemists, Washington.
- Aramwit, P., N. Bang, and T. Srichana. 2010. The properties and stability of anthocyanins in mulberry fruits. Food Res. Intl. 43(4):1093–1097.
- Couch, S.C., J.L. Crandell, A.S. Shah, L.M. Dolan, A.T. Merchant, A.D. Liese, J.M. Lawrence, C. Pihoker, and E.J. Mayer-Davis. 2013. Fructose intake and cardiovascular risk factors in youth with type 1 diabetes: SEARCH for diabetes in youth study. Diabetes Res. Clin. Prac. 100(2):265–271.
- Cozma, A.I., J.L. Sievenpiper, R.J. de Souza, L. Chiavaroli, V. Ha, D.D. Wang, A. Mirrahimi, M.E. Yu, A.J. Carleton, M. Di Buono, A.L. Jenkins, L.A. Leiter, T.M.S. Wolever, J. Beyene, C.W.C. Kendall, and D.J.A. Jenkins. 2012. Effect of fructose on glycemic control in diabetes: A systematic review and meta-analysis of controlled feeding trials. Diabetes Care 35(7):1611–1620.
- Davim, S.E. 2007. Desenvolvimento de alimentos funcionais enriquecidos com concentrado e polpa de tubérculos de alcachofra de jerusalém. Trabalho Complementar de Curso. ESAV, Viseu, Portugal.
- Guiné, R.P.F., M.J. Lima, and M.J. Barroca. 2010. Functional components of foods, p. 59–135. In: R.P.F. Guiné. Food, Diet and Health. Past, Present and Future Tendencies. Nova Science Publishers, Inc., New York.
- Huebner, J., R.L. Wehling, and R.W. Hutkins. 2007. Functional activity of commercial prebiotics. Intl. Dairy J. 17(7):770–775.
- Kaur, N., and A.K. Gupta. 2002. Applications of inulin and oligofructose in health and nutrition. J. Biosci. 27(7):703–714.
- Krasaekoopt, W., and S. Watcharapoka. 2014. Effect of addition of inulin and galactooligosaccharide on the survival of microencapsulated probiotics in alginate beads coated with chitosan in simulated digestive system, yogurt and fruit juice. LWT–Food Sci. Technol. 57(2):761–766.
- Malik, V.S., B.M. Popkin, G.A. Bray, J.-P. Després, W.C. Willett, and F.B. Hu. 2010. Sugar-sweetened beverages and risk of metabolic syndrome and type 2 diabetes: A meta-analysis. Diabetes Care 33(11):2477–2483.
- Osborn, H.M.I. 2003. Carbohydrates. Academic Press, Amsterdam, Netherlands.
- Pala, Ç.U., and A.K. Toklucu. 2013. Microbial, physicochemical and sensory properties of UV-C processed orange juice and its microbial stability during refrigerated storage. LWT–Food Sci. Technol. 50(2):426–431.
- Renuka, B., S.G. Kulkarni, P. Vijayanand, and S.G. Prapulla. 2009. Fructooligosaccharide fortification of selected fruit juice beverages: Effect on the quality characteristics. LWT–Food Sci. Technol. 42(5):1031–1033.
- Reque, P.M., R.S. Steffens, A.Jablonski, S.H. Flôres, A. de O. Rios, and E.V. de Jong. 2014. Cold storage of blueberry (Vaccinium spp.) fruits and juice: Anthocyanin stability and antioxidant activity. J. Food Compos. Anal. 33(1):111–116.
- Saarela, M., K. Hallamaa, T. Mattila-Sandholm, and J. Mättö. 2003. The effect of lactose derivatives lactulose, lactitol and lactobionic acid on the functional and technological properties of potentially probiotic Lactobacillus strains. Intl. Dairy J. 13(4): 291–302.
- Salvatierra, A., P. Pimentel, M.A. Moya-Leon, P.D.S. Caligari, and R. Herrera. 2010. Comparison of transcriptional profiles of flavonoid genes and anthocyanin contents during fruit development of two botanical forms of Fragaria chiloensis ssp. chiloensis. Phytochemistry 71(16):1839–1847.
- Sánchez-Lozada, L.G., M. Le, M. Segal, and R.J. Johnson. 2008. How safe is fructose for persons with or without diabetes? Am. J. Clin. Nutr. 88(5):1189–1190.
- Wang, W.D., and S.-Y. Xu. 2007. Degradation kinetics of anthocyanins in blackberry juice and concentrate. J. Food Eng. 82(3):271–275.
- Yu, J.H., M.-S. Shin, J.R. Lee, J.H. Choi, E.H. Koh, W.J. Lee, J.-Y. Park, and M.-S. Kim. 2014. Decreased sucrose preference in patients with type 2 diabetes mellitus. Diabetes Res. Clin. Prac. 104(2):214–219.