
ABSTRACT
The present investigation reports an elucidation of genetic diversity among 12 promising Indian cashew nut cultivars, including 9 local selections and 3 hybrids on the basis of morphometric and yield parameters as well as random amplified polymorphic DNA (RAPD) markers. Dice dissimilarity coefficient was used to discriminate cultivars with respect to gross phenotypic characters such as plant growth, flowering, fruit, and nut characters. DNA from these cultivars were subjected to polymerase chain reaction (PCR) using 35 decamer oligonucleotide primers of which 15 primers were able to generate informative polymorphism (average 79.187%). The unweighted pair group method using arithmetic average (UPGMA) dendrogram segregated the cashew cultivars into two main clusters at 0.53 Jaccard’s similarity coefficient. Five different primers were identified with the ability to discriminate eight cultivars based on a unique band pattern. Although both morphometric descriptors and RAPD markers proved their effectiveness for distinguishing the different cultivars in cashew germplasm of India, the superiority of the latter was explicit being more informative as to genotypic discrimination and establishing genetic relationships.
Introduction
Cashew (Anacardium occidentale L.) of family Anacardiaceae, order Sapindales, is a fruit-cum-nut crop of world importance and is an important tropical plant species native to tropical America. It is a predominantly cross-pollinated plant with entomophilous pollination (Nambiar and Pillai, Citation1985). Though Brazilian in origin, the plant has flourished in India, which has emerged as the largest producer, processor, and exporter of cashew (FAOSTAT, Citation2002). Cashew plants were initially transported into India by the Portuguese between 1563 and 1578 (Rao et al., Citation1998) and the first introduction of cashew in India was made in Goa from where it spread to other parts of the country. Cultivation of cashew in India is confined mainly to the peninsular areas as it has adapted well to the coastal locations in the States of Odisha, West Bengal, Andhra Pradesh, Kerala, Karnataka, Goa, Maharashtra, and Tamil Nadu. India is not only the largest area holder of this crop but it has also a creditable record in earning foreign exchange by exporting cashew kernels. The major international buyers of cashew from India are the USA, UK, UAE, Netherlands, Saudi Arabia, Italy, Middle East, Australia, Japan, German, Austria, Canada, and France. Unfortunately, cashew production is constrained by low and variable nut yields, poor nut quality, and susceptibility to fungal diseases and pests, particularly due to powdery mildew and Helopeltis, respectively, despite efforts initiated since 1950 towards improving this crop for agronomic attributes, such as nut yield and quality through breeding (Rao et al., Citation1998).
Proper varietal identification and characterization of cashew is essential for their clear-cut germplasm maintenance as well as strengthening the breeding strategy. Cashew has a chromosome number of 2n = 42; however, the ploidy is unclear (Purseglove, Citation1968). Genetic improvement of Indian cashew nut is limited by the lack of knowledge of genotypic diversity of the indigenous germplasm. Conventionally, identification and genetic characterization in cashew have been based entirely on morphological characters (Swamy et al., Citation1998). Breeding of cashew is mostly based on traditional methods of selection of useful traits, which is based on morphological attributes, such as nut weight, nut size, sex ratio, length of panicle, and yield performance (Mneney et al., Citation2001). However, large phenotypic variation in the populations has been reported in the coastal regions of India (Rao et al., Citation1998). Although morphological characteristics are still extremely useful, the efficiency of selection may be reduced by environmental effects or developmental stages on measured traits and these are often faced with low penetrance and heritability. Information on the cultivars other than the released cultivars is mainly anecdotal, and local cultivars having different synonyms that have the same original material, which creates confusion among different local cultivars of the cashew grown in different regions, and also different cultivars sometimes appear under the same vernacular name, which makes identification difficult. Such problems are exaggerated in tree crops because of a long juvenile period, information confined to only the maternal parent, and anecdotal information on the cultivars. Thus, differentiation of cultivars through morphological features is inefficient and inaccurate. Interpretation of genetic diversity on the basis of biochemical characters has several limitations too. Biochemical markers, such as isozyme and protein patterns, are influenced by the developmental stage of the plant as well as environmental conditions; moreover, they offer limited polymorphism and often do not allow discrimination among closely related cultivars. Many of these drawbacks of morphological and biochemical markers can be overcome through direct identification of cultivars using DNA-based molecular markers. DNA markers are practically unlimited in number, remain unaffected by environmental and growth conditions, are highly heritable, exhibit enough polymorphism to discriminate cultivars, and are simply inherited. Therefore, they can be more useful in identifying cultivars at early stages of growth and can substantiate to confer legal protection in order to prevent their unauthorized commercial exploitation. Not only could the DNA-based genetic markers be useful for varietal identification in cashew but also they could facilitate estimation of genetic diversity and relatedness between landraces, selections, and hybrids. Such markers are expected to play an important role in future cashew improvement programs.
Random amplified polymorphic DNA (RAPD) technique (Welsh and McClelland, Citation1990; Williams et al., Citation1990), based on polymerase chain reaction (PCR) has been used to generate markers, which have been used extensively because their application does not need any prior information about the target sequences on the genome. The RAPD method has advantages over other kinds of DNA-based genetic markers, such as SSR and SNP; the former being relatively quick, easy-to-perform, comparatively cheap, highly informative, and needs no information of template DNA sequence and synthesis of specific markers. Despite questions about its reproducibility, its utility in diversity analysis, mapping, and genotype identification has been exploited in many plant species (Hemanth and Vasanthaiah, Citation2009; Ishtiaq et al., Citation2008; Jena et al., Citation2010b; Karihaloo et al., Citation2003; Ravishankar et al., Citation2000) and also Tanzanian cultivars (Mneney et al., Citation2001) and Indian cultivars (Dhanaraj et al., Citation2002; Samal et al., Citation2003) of cashew. Thus, RAPD could be an efficient technique to unravel the intraspecific relationships among different cultivars of cashew. Currently, inadequate data is available on DNA fingerprinting of cashew, particularly in India. The present investigation is, therefore, aimed at (i) estimating the genetic divergence among 12 promising Indian cashew cultivars cultivated in the State of Odisha by using morphometric characters and RAPD markers and (ii) developing unique RAPD markers to facilitate identification of different cashew cultivars.
Materials and methods
Plant material
Twelve different cashew cultivars used in this research were obtained from the cashew orchard of Orissa University of Agriculture and Technology, Bhubaneswar, Odisha, India ( and ). The plants were selected on the basis of their consistency in behavior for the last 3 years at their growing region for morphological observations as well as for collection of leaf samples for molecular characterization.
Table 1. Cashew varieties used for morphometric and molecular characterization.
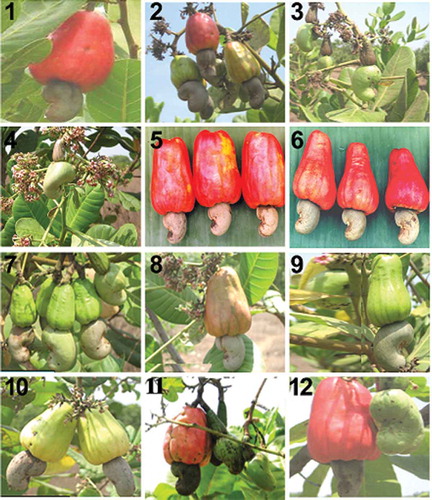
Figure 1. Fruit (apple with nut) morphology of 12 cashew varieties selected for RAPD analysis. Numbers (1–12) correspond to the varieties of cashew as given in and the lane numbers in .
Morphometric characterization
Data on morphological characters, such as plant height, girth, canopy spread, flossing, flowering initiation, number of lateral per sq. meter, number of flowering lateral per sq. meter, panicle length, apple color, apple weight, nuts per panicle, nut weight, kernel weight, shelling percentage, and nut yield per plant, were recorded for 3 consecutive years, i.e., 2009–11. Fifteen individuals of each genotype were selected for statistical analysis of morphometric characters. The results were analyzed for statistical significance by one way analysis of variance (ANOVA). At 95% confidence interval p ≤ 0.05 were considered to be significant. Pairwise-dissimilarity matrices based on morphometric data were determined using Dice’s dissimilarity coefficient (Dice, Citation1945). The quantitative and yield data obtained in the morphometric analysis were then pooled to create a single data matrix and used to estimate genetic dissimilarity and to construct an unweighted pair group method using arithmetic average (UPGMA) dendrogram among populations using the computer program, NTSYS-PC (version 2.02) (Rohlf, Citation1993). The generated dendrogram () grouped the cultivars on the basis of Dice’s dissimilarity coefficient (Dice, Citation1945) using UPGMA cluster analysis (Sneath and Sokal, Citation1973).
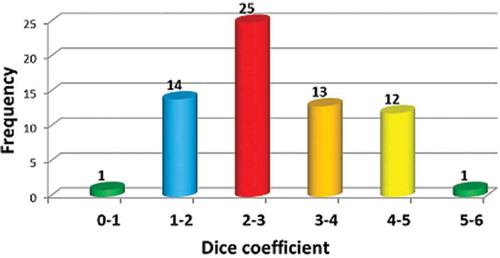
Figure 2. Frequency distribution of Dice’s coefficient based on morphometric descriptors.
Isolation of genomic DNA
Fresh young emerging leaves of each of the 12 cashew cultivars were collected individually and were frozen in liquid nitrogen for transportation to the laboratory and subsequently stored at –80 °C until processed. DNA was extracted as per the method described by Jena et al. (Citation2010a) with minor modifications. Modifications were made to obtain high quality and quantity DNA by minimizing its co-isolation with polyphenols and polysaccharide by using an improved extraction buffer (1.6% w/v CTAB, NaCl 1.5 M, Tris HCl pH 8.0 (100 mM), EDTA pH 8.0 (20 mM), 2% v/v PVP K-30 [Hi-Media Laboratories, Mumbai, India], 0.5% v/v β-mercaptoethanol). DNA concentration and quality of DNA was determined using a UV-Vis spectrophotometer (Thermo-Spectronic Genesis-2, Waltham, MA, USA) by measuring the absorbance at 260 and 280 nm. The purity of DNA was determined by the ratio of absorbance at A260/A280. Again, DNA concentrations were determined by comparing the fluorescent intensity of standard DNA (λ DNA/EcoRI digest, Bangalore Genei, Bangalore, India) after electrophoresis in 0.8% agarose gel followed by ethidium bromide staining (Sambrook et al., Citation1989).
Primer screening
Initially, 35 decamer oligonucleotide primers, corresponding to OPA Series from Operon Technologies (Alameda, CA, USA) and RPI-C Series from Bangalore Genei (Bangalore, India), were initially screened using seven cashew cultivars to determine the suitability of each primer for the study. Primers were selected on the basis of their ability to detect distinct, clearly resolved, and polymorphic amplified products within the cultivars of cashew for further analysis. The primers that gave either negative or weak/complex banding patterns were discarded, while those giving reproducible patterns were adopted for further detailed characterization.
RAPD analysis
To carry out RAPD analysis, our procedure outlined in Samal et al. (Citation2012) was followed with slight modifications. PCR was performed on each DNA sample in a final volume of 25 µl reaction mixture containing 1× PCR buffer (10 mMTris HCl pH 8.3; 50 mM KCl, 0.01% gelatin), 1.5 mM MgCl2, 200 µM dNTP each, 1U of Taq DNA polymerase (Bangalore Genei, Bangalore, India), 0.5 µM of single primer, 30 ng of template DNA, and the rest sterile nuclease and protease-free water. DNA amplification was carried out in a thermocycler (Bio-Rad, Universal Hood 11, Hercules, CA, USA) programmed to include a pre-denaturation step at 94 °C for 4 min, followed by 40 cycles of denaturation at 94 °C for 1 min, annealing at 37 °C for 1 min, and extension at 72 °C for 2 min. After the last cycle, a final extension at 72 °C for 5 min was added to allow complete extension of all amplified fragments. After completion of the cycling program of reactions the samples were held at 4 °C. PCR products were separated on 1.5% agarose gel stained with ethidium bromide (0.8 µg.ml−1). Running buffer containing Tris-base, boric acid, and EDTA (TBE), pH 8.0 was used for preparing gels and electrophoresis. Wells were loaded with 15 µl of amplified sample and 2.5 µl of 6× loading dye. Electrophoresis was conducted at 70 V for 4 h and the gel with amplified fragments were observed and photographed under GELDOC XR SYSTEM (Bio-Rad). A medium range DNA ruler was used as a molecular marker (Bangalore Genei, Bangalore, India) to estimate the size of the fragments and also the amplification product sizes were evaluated using the software Quantity One (Bio-Rad). After carrying out primer screening, 15 different primers were selected based on the robustness of the amplicons and the clarity and storability of banding patterns. RAPD analysis of a total of 12 different cashew cultivars were conducted using 15 selected primers.
Data analysis
All distinct bands data were scored visually as 1 and 0 on the basis of their presence and absence, separately for each individual and each primer. All of the bands, whether monomorphic or polymorphic, were used for similarity calculation in order to avoid over-estimation of distance (Gherardi et al., Citation1998). Efficiency of discrimination was assessed in terms of the number of polymorphic markers generated and the ability to generate unique bands. The polymorphic information content (PIC) was calculated by applying the formula: [PIC = 1 − ∑ni=1 fi2], where fi is the frequency of the ith allele and the summation extends over n alleles. Pairwise-similarity matrices based on RAPD data were determined using Jaccard’s similarity coefficient (JSC) (Sneath and Sokal, Citation1973). The scores obtained in the RAPD analysis using all of the primers were then pooled to create a single data matrix and used to estimate genetic similarity, polymorphic loci, and to construct an UPGMA dendrogram among populations using a computer program, NTSYS-PC (version 2.02) (Rohlf, Citation1993). The generated dendrogram grouped the cultivars on the basis of Jaccard’s similarity coefficient (Jaccard, Citation1908) using UPGMA cluster analysis (Sneath and Sokal, Citation1973). Resolving power (Prevost and Wilkinson, Citation1999) was used to identify the set of primers that would distinguish cultivars more efficiently. Resolving power (Rp) of a primer was calculated as sum of band informativeness of all bands produced by a primer. The robustness and validity of clustering pattern was tested by bootstrap analyses of 1000 bootstrap samples using the software WINBOOT (Yap and Nelson, Citation1996).
Results and discussion
Morphological characterization
Phenotypic variations among plant cultivars are viewed as an index of genetic diversity in a crop population. Twelve cashew cultivars were analyzed for their morphological characters. A high degree of variation was observed among cultivars with respect to plant height, girth, canopy spread, flossing, flowering initiation, number of laterals per sq. meter (m−2), number of flowering laterals (m−2), panicle length, apple color, apple weight, number of nuts per panicle, nut weight, kernel weight, shelling, and yield per plant, etc. ( and ). Variation was observed in plant height (1.93–2.48 m), plant girth (6.04–9.43 cm), average canopy spread (ACS) E-W (2.08–3.46 m), ACS N-S (1.69–3.14 m), flossing (1 Jan.–3 Dec.), first flowering initiation (1 Jan.–4 Dec.), total number of laterals m−2 E-W (11.92–15.25), flowering laterals m−2 E-W (11.67–14.75), total number of laterals m−2 N-S (12.75–16.00), flowering laterals m−2 N-S (12.33–14.25), panicle length (13.0–22.5 cm), apple weight (23.71–42.14 g), average nuts per panicle (1.42–2.25), nut weight (6.23–9.44 g), kernel weight (1.63–3.02 g), shelling (24.5–32.4%), and average yield per plant (2.8–10.9 kg).
Table 2. Morphometric characterization of cashew varieties.
The maximum nut weight (9.44 g), yield/plant (10.9 kg), kernel weight (3.02 g), flowering laterals m−2 (14.25), early flossing (1 Jan.), and minimum ACS N-S (1.49 m) was observed in ‘Amrutha’, while the lowest yield (2.80 kg), kernel weight (1.63 g), and shelling (24.5%) were reported in ‘BPP-4’. The maximum apple weight (42.14 g), nut per panicle (2.25), early flowering initiation (1 Jan.), lowest canopy spread (2.08 cm), and plant height (1.93 m) were recorded in the ‘Vengurla-4’. Early flowering (1 Jan.), minimum number of laterals m−2 E-W (11.92) and minimum number of laterals m−2 N-S (12.75) were recorded in a single cultivar, Ullal-3. The lowest flowering laterals m−2 E-W (12.33 cm), flowering laterals m−2 N-S (12.33), and also lowest nut per panicle (1.42) was demonstrated in a single cultivar, Ullal-4. The highest number of laterals m−2 E-W, number of laterals m−2 N-S, and early flowering initiation (1 Jan.) was observed in the cultivar, H-1598. The minimum apple weight (23.71 g), panicle length (13.0 cm), maximum plant height (2.48 m), and canopy spread N-S (3.44 m) were recorded in ‘Chintamani-1’. The highest plant girth (9.43 cm) and lowest nut weight (6.23 g) were demonstrated in only ‘Madakkathara-1’, while maximum shelling (32.4%) and minimum plant girth (6.04 cm) were observed in ‘UN-50’.
Genetic diversity and relationship based on morphological data
The genetic dissimilarity matrix () was analyzed based on morphological descriptors using UPGMA clustering algorithms for deriving a dendrogram that depicted the pattern of genetic relationships among cashew cultivars. The minimum and maximum dissimilarity values were 0.662 and 5.224, respectively, with a mean of 2.853. A pairwise comparison revealed an inter-cultivar dissimilarity index for Chintamani-1 versus Vengurla-4 (5.224), which was comparatively higher than all other cultivar pairs, closely followed by Chintamani-1 versus Ullal-4 (4.988). On the other hand, inter-cultivar dissimilarity index for Chintamani-1 versus Madakkathara-1 (0.662) cultivar pair was the lowest among cultivar pairs, closely followed by Vengurla-4 versus Amrutha (1.156).
Table 3. Pairwise-dissimilarity matrices based on morphometric descriptors in 12 cashew cultivars determined using dice’s dissimilarity coefficient.
A histogram prepared using the observed pairwise Dice’s coefficient between the cultivars is presented (). These Dice’s average dissimilarity estimates were mostly clustered in frequency class 2-3 and in this class 25 pairs of cultivars were found. Similarly, 14 pairs of cultivars constituted the frequency class 1-2 and 13 pairs of cultivars were in the frequency class 3-4. Pairwise dissimilarity estimates of 12 pairs of cultivars were represented in the frequency class 4-5, whereas only one pair of cultivars was included in the frequency class 0-1 and 5-6.
A dendrogram constructed on the basis of Dice’s dissimilarity coefficient broadly separated all 12 cashew cultivars into two main clusters at 3.53 dissimilarity coefficient (). ‘UN-50’, ‘Chintamani-1’, ‘Madakkathara-1’, ‘Madakkathara-2’, ‘BPP-4’, ‘Vengurla-1’, and ‘BPP-6’ formed Cluster I, while the remaining five cashew germplasms were grouped in Cluster II. Within Cluster I, ‘UN-50’, ‘Chintamani-1’, and ‘Madakkathara-1’ formed sub-cluster IB and the remaining four (‘Madakkathara-2’, ‘BPP-4’, ‘Vengurla-1’, and ‘BPP-6’) were grouped in sub-cluster IA. In sub-cluster IB, ‘Chintamani-1’ and ‘Madakkathara-1’ were grouped separately with the minimum level of genetic dissimilarity 0.66 thereby reflecting their closest relatedness. In sub-cluster IA, ‘Madakkathara-2’ and ‘BPP-4’ formed sub-sub-cluster IA1 and the rest, ‘Vengurla-1’ and ‘BPP-6’, grouped together to form sub-sub-cluster IA2. In Cluster II, ‘Vengurla-4’, ‘Amritha’, and ‘H-1598 (Kanaka)’ formed the sub-cluster IIA. The remaining two cashew cultivars (Ullal-4 and Ullal-3) constituted the sub-cluster IIB. In sub-cluster IIA, Kanaka alone formed sub-sub cluster IIA1 and the other two cashew cultivars (Vengurla-4 and Amrutha) grouped together to form sub-sub-cluster IIA2 with a relatively low level of dissimilarity coefficient, i.e., 1.156.
Figure 3. Dendrogram depicting genetic relationship among cashew varieties based on morphometric characters using Dice’s dissimilarity coefficient.
Molecular characterization
Characterization of crop genetic diversity is the key to success of conservation of elite genetic resources as well as for developing the desirable cultivars via genetic improvement (Archak et al., Citation2003; Barik et al., Citation2007; Jena et al., Citation2010b, Citation2010c; Krishna and Singh, Citation2007; Ravishnakar et al., Citation2000; Samal et al., Citation2012; Weising et al., Citation2005). In this study, the modified DNA extraction protocol of Jena et al. (Citation2010a) allowed obtaining a high quality DNA, which was confirmed by the electrophoresis with 0.8% agarose gels where no degradation was observed.
Amplicon profiling and DNA polymorphism
In this study, DNA from 12 different cashew cultivars were amplified using 35 RAPD primers. The primer screening identified 15 primers that revealed reproducible polymorphic DNA amplification patterns in all cultivars (). The remaining 20 primers were also able to show amplification but the intensity of the band fluorescence intensity was too low to be taken into consideration. The reproducibility of amplification products was tested on template DNA from three independent extractions of three randomly chosen replicates of each accession using leaf samples in different seasons. Fifteen RAPD primers generated a total of 169 amplified bands ranging in size from 100–3000 base pairs, of which 134 (79.289%) were found to be polymorphic and the remaining 35 fragments were monomorphic. The number of bands varied with primer, ranging from 5 (OPA-8) to 17 (RPI-8) with a mean of 11.266 total bands and 8.933 polymorphic bands per primer (). Among all of the primers, RPI-8 produced the highest number of bands (17) of which 13 bands were polymorphic, while RPI-7 revealed the highest polymorphism (93.333%) albeit having produced a total of 15 bands. On the other hand, the primers RPI-1, RPI-2, RPI-3, RPI-4, RPI-5, RPI-6, RPI-9, RPI-10, RPI-11, RPI-13, RPI-18, OPA-2, and OPA-8 generated 6, 8, 6, 11, 7, 6, 10, 11, 6, 13, 9, 10, and 4 polymorphic bands, respectively. The banding patterns of 12 cashew cultivars using RPI-7 primer are displayed in . A high percentage of polymorphism (average 79.187) is a reflection of a wide range of genetic variation among the cashew accessions examined. The present findings seem to be relatively similar when compared to the reports of previous RAPD studies on two important fruit crops under Family Anacardiaceae, including cashew (Archak et al., Citation2003; Asolkar et al., Citation2011; Samal et al., Citation2003; Thimmappaiah et al., Citation2009) and Indian mango cultivars (Fitmawati et al., Citation2010; Hameedunnisa et al., Citation2014; Jena et al., Citation2010b).
Figure 4. DNA fingerprinting of cashew varieties obtained by RAPD analysis using primer RPI-7. Lane M indicates medium range DNA ruler (Bangalore Genei-Merck, Bangalore, India); digits along the margin represent molecular weight of ruler DNA in base pairs (bp). Lanes 1–12 correspond to the cashew varieties as given in and .
Table 4. The extent of DNA polymorphism in 12 cashew cultivars generated by 15 different RAPD primers.
Genetic diversity and relationship
Jaccard’s pairwise similarity analysis depicted a good degree of genotypic diversity existing in cashew cultivars studied. The minimum and maximum similarity values were 0.44 and 0.79, respectively, with a mean of 0.575. Pairwise comparison of DNA profiles revealed the inter-cultivar similarity index for BPP-6 versus Ullal-4 (0.79), which was the highest among all other cultivar pairs, closely followed by UN-50 versus Chintamani-1 and UN-50 versus BPP-4 (0.77). On the other hand, intercultivar similarity index for UN-50 versus BPP-6 (0.44) cultivar pair was comparatively lower than all other cultivar pairs, closely followed by Chintamani-1 versus BPP-6, Vengurla-1 versus BPP-4, and BPP-4 versus BPP-6 (0.46). The most diverse cultivars, namely, UN-50 versus BPP-6 are developed and released from two different State Agricultural Universities for cultivation in the State of Karnataka and Andhra Pradesh of India, respectively. These two cultivars were diverse from each other with respect to nut quality, pomological and morphometric characters, which was corroborated by RAPD analysis. ‘UN-50’ was characterized by obovate shape, smooth and glossy skin and red colored apple, absence of the apple ridges, kidney-shaped nut, round-shaped nut apex, suture projection of the nut lined with apex, low export grade nut, and lowest shelling percentage, whereas ‘BPP-6’ possesses features, such as cylindrical shape, rough and dull skin and yellow colored apple, entire ridges of the apple, oblong-shaped nut, intermediate-shaped nut apex, suture projection of the nut in front of the apex, highest export grade, and intermediate shelling percentage. A similar range of genetic similarities of 0.38–0.78 was reported from earlier studies on Indian mango cultivars using RAPD analysis (Jena et al., Citation2010b). Primer RPI-8 had the highest Rp (20.667) followed by the primer OPA-2 (18.512). The primer RPI-1 gave the maximum PIC (0.746) followed by RPI-6 (0.732) and was able to discriminate the cashew cultivars efficiently. Previous studies have suggested different numbers and sequences of primers for their usefulness for the identification of cashew cultivars (Archak et al., Citation2003; Samal et al., Citation2003). These Jaccard’s average similarity estimates were mostly clustered in frequency class 50–60, and in this class 29 pairs of cultivars were represented. Pairwise similarity estimates of 22 pairs of cultivars constituted the frequency class 60–70, 11 genotype pairs formed the frequency class 40–50, whereas only 4 pairs of cultivars were included in the frequency class 70–80 (data not shown).
A dendrogram constructed on the basis of Jaccard’s similarity coefficient () and validated by the bootstrap analysis separated all 12 cashew cultivars into two main clusters at 0.53 similarity coefficient (). ‘UN-50’, ‘Chintamani-1’, ‘BPP-4’, and ‘Madakkathara-1’ formed Cluster I while the remaining eight cashew germplasms were grouped in Cluster II. All four cultivars of Cluster I were important cultivars released by the State Agricultural Universities located in South India. These cultivars are characterized by a moderate number of canopy per branch, late fruiting, and medium-size fruit. Within Cluster I, Madakkathara-1 alone formed sub-cluster IA and demonstrated Jaccard’s similarity of 0.59 with the remaining three cultivars (BPP-4, Chintamani-1, and UN-50), which were grouped in sub-cluster IB. In sub-cluster IB, Chintamani-1 and UN-50 were grouped together at a relatively high similarity coefficient of 0.77 being separated from BPP-4 at 0.76; these two cultivars are released by Karnataka Agriculture University and characterized by obovate type of apple shape, red and yellow apple color, angular apple base, kidney-shaped nut with higher nut weight. In Cluster II, Amritha and Ullal-3 formed the sub-cluster IIB with 0.56 similarity coefficient at which the remaining six cashew cultivars constituted the sub-cluster IIA. These two cultivars are characterized by red apple color, heavy nut weight, and rounded-shape nut base. In sub-cluster IIA, Vengurla-1 and Vengurla-4 formed sub-sub-cluster IIA1 at 0.57 similarity coefficient and the other four cashew cultivars grouped together to form sub-sub-cluster IIA2. These two cultivars are released by Dr. Balasaheb Sawant Konkan Krishi Vidyapeeth, Vengurla, Maharashtra (India) and are characterized by the same fruiting time, smooth and glossy skin, red-colored apple, highly juicy apple, high shelling percentage, and shallow apple cavity at the apex. In sub-sub-cluster IIA2, H-1598 alone formed an out-group and demonstrated Jaccard’s similarity coefficient of 0.62 with ‘BPP-6’, ‘Ullal-4’, and ‘Madakkathara-2’, while ‘BPP-6’ and ‘Ullal-4’ grouped with the lowest level of genetic distance (at highest similarity coefficient of 0.79), thus reflecting the closest relatedness. Interestingly, these two cultivars are released from different agricultural universities of different States of India and are characterized by yellow-colored apple, intermediate apple weight, rounded apple base, deep apple cavity, entire ridges on apple, and high nut weight. We also obtained the same result using the neighbor-joining (NJ) method using Darwin software (data not shown). The present results are in close conformity with the RAPD studies in woody tree species (Casas et al., Citation1999; Jena et al., Citation2010b; Ravishankar et al., Citation2000). The grouping of cashew cultivars through principal components analysis (PCA) also resulted in similar trends as observed through three-dimensional cluster analysis ().
Table 5. Jaccard’s similarity coefficient generated by 15 RAPD primers in 12 cashew varieties.
Figure 5. UPGMA tree based on Jaccard’s similarity coefficient revealing clustering of cashew varieties based on RAPD data. Bootstrap values are indicated at the corresponding node for each cluster on dendrogram using Winboot (Yap and Nelson, Citation1996).
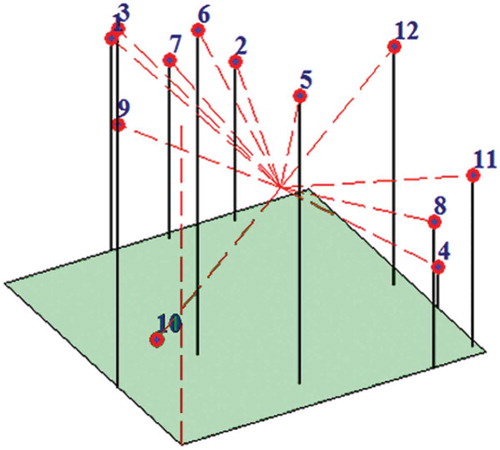
Figure 6. Three-dimensional scaling by principal component analysis (PCA) of cashew varieties using Jaccard’s similarity coefficient generated from RAPD profile data. Numbers (1–12) denoting the plotted data points represent the respective cashew varieties as listed in .
Comparison of morphometric and molecular analysis
Morphometric and molecular analysis were performed to assess the genetic diversity among the different cashew cultivars on the basis of dissimilarity and similarity coefficients, respectively. Despite evidence of diversity using either type of analysis, there was a considerable extent of discordance between them. A dendrogram constructed on the basis of Dice’s dissimilarity coefficient of morphometric data broadly separated all the cultivars into two main clusters. Cluster I consisted of seven cultivars and Cluster II was composed of five cultivars. Vengurla-4, Amritha, H-1598 (Kanaka), Ullal-4 and Ullal-3 revealed a low diversity and, hence, were grouped within one single major cluster (Cluster II) while being diverse from Vengurla-1, BPP-6, and Madakkathra-2, which were placed in Cluster I. However, basing on molecular analysis, all eight cultivars demonstrated a close genetic similarity, thus they were able to be included in the same Cluster II. Similarly, ‘Vengurla-1’ (Cluster I) and ‘Vengurla-4’ (Cluster II) revealed a moderate level of genetic dissimilarity (2.483) at a morphological level, but based on RAPD analysis, these two were placed within the same major cluster ‘Cluster II’ because they demonstrated comparatively closer relatedness (0.68) and, hence, less genetic diversity. Based on morphometric data, ‘BPP-6’ of Cluster I and ‘Ullal-4’ of Cluster II demonstrated a moderate level of dissimilarity coefficient (2.455), but it was interesting to note from RAPD analysis that they revealed the highest similarity (0.79) and thus were placed in a single cluster ‘Cluster II’. Likewise, ‘BPP-4’ and ‘BPP-6’ demonstrated a very low dissimilarity coefficient (1.903) based on morphometric markers and were placed in the same ‘Cluster I’, whereas at the molecular level they revealed a much lower level of similarity coefficient (0.46) and, hence, were placed in two different clusters; ‘BPP-4’ was included in Cluster I, while ‘BPP-6’ found its place in Cluster II.
According to phenometric parameters, ‘H-1598 (Kanaka)’ formed sub-sub-cluster IIA1 and demonstrated a moderate level of closeness (dissimilarity coefficient 1.38) with two cultivars, namely, Vengurla-4 and Amrutha. Interestingly, based on molecular parameters, ‘H-1598 (Kanaka)’ also formed one out-group in sub-sub-cluster-IIA2 but demonstrated a higher genetic distance (similarity coefficient 0.50) from either Vengurla-4 or Amrutha, instead a closer genetic similarity (similarity coefficient 0.62) with three other cultivars, namely, BPP-6, Ullal-4, and Madakkathara-2.
Based on morphometric data in sub-cluster IB, Chintamani-1 and Madakkathara-1 were grouped separately with the minimum level of genetic dissimilarity (0.66) thereby reflecting their closest relatedness, but these two cultivars displayed only a moderate level of genetic similarity (0.57) at a molecular level and, hence, they were placed in two different sub-clusters; the former in sub-cluster IB while the latter was in sub-cluster IA. Likewise, the cultivars that have similar morphometric characters can be largely different from each other at the genetic level as evident in ‘Madakkathara-1’, which formed an out group at a molecular level.
Jaccard’s average similarity based on RAPD data exhibited a pairwise similarity estimate of 11 pairs of cultivars, which formed the lowest similarity class (40–50%) and thus identified as more diverse varietal pairs. Contrarily, Dice’s average dissimilarity based on morphometric data revealed only one pair of cultivars being included in the highest dissimilarity class (5-6). On the other hand, data obtained from molecular analysis was used to include four pairs of cultivars in the highest similarity class (70–80%) and thus represented the closest varietal pair whereas morphometry-based pairwise dissimilarity estimated only one pair of cultivars to be included in the lowest dissimilarity class (0-1) reflecting maximum genetic similarity.
A combination of morphometric and RAPD markers sufficed to assess diversity among 12 cashew cultivars. The reason for low correlation between morphological and molecular dendrograms may be the effects of environmental conditions on morphological characters (Kumar, Citation1999). According to Smith and Smith (Citation1989) and Hamrick and Godt (Citation1989), the use of phenotypic traits is not necessarily conclusive to estimate the genetic distance among individuals of a population because the degree of divergence between them at the morphological level is not always correlated with a similar degree of genetic difference. In comparison, molecular markers have been viewed as a superior tool for generating a more convincing estimate of genetic relationships for being able to provide a better coverage of the genome. The incongruities in grouping based on morphological and molecular data were reported in Hordeum vulgare (Papa et al., Citation1998), Rhenum sp. (Person et al., Citation2000), Pueraria mirifica (Suwanvijitr et al., Citation2010), Brassica napus (Burlacu et al., Citation2011), H. vulgare L. (Kanbar, Citation2011), and Mentha sp. (Shinwari et al., Citation2011). Despite the low correlation between dendrograms based on matrices obtained by morphometric and molecular analysis performed in the present work, it can be observed that some cultivars were placed in the same group in both dendrograms. For instance, four cultivars, namely, UN 50, Chintamani-1, BPP-4, and Madakkathra-1 were included in the major Cluster-I in dendrograms generated from both types of analysis. Similarly, Vengurla-4, Amritha, Ullal-3, and Ullal-4 were accommodated in major Cluster-II. It was also interesting to note that the cultivar, H-1598 (Kanaka), formed an outgroup in either dendrograms. The low correlation between RAPD dendrogram and morphological dendrogram had also been reported in European barley cultivars (Schut et al., Citation1997), synthetic hexaploid wheat and their parents (Lage et al., Citation2003), and squash (Ferriol et al., Citation2004). The correspondence in grouping based on morphological and molecular data were reported in Elaeagnus angustifolia (Asadiar et al., Citation2012). Castiglione et al. (Citation1993) used RAPD markers to estimate genetic distance between all the commercial poplar clones tested, including those which were unable to be discriminated basing on morphological traits alone. According to Bachmann (Citation1992), phenotypic disparities are not necessarily correlated with the number of underlying gene mutations, and differences in gross morphological features are not always reflections of different genetic events. In our study, the uses of morphometric attributes alone were unreliable for evaluating the genetic diversity and relatedness among cashew cultivars; instead genetic variation could be better elucidated using a more informative method based on DNA markers.
Genotype identification based on unique RAPD markers
RAPD markers were used for the identification of cashew cultivars. Primers, such as RPI-1, RPI-4, RPI-5, and RPI-8, exhibited moderate polymorphism, but amplified unique and rare bands. Further, 8 out of a total 12 genotypes were identified by the presence or absence of a unique DNA band. The genotypes ‘Madakkathara-1’, ‘Chintamani-1’, ‘Madakkathara-2’, ‘BPP-4’, ‘Ullal-4’, ‘Vengurla-4’, and ‘UN-50’ were identified by the presence of a unique band. A single genotype identified by the absence of a specific band was ‘Amritha’. It was interesting to note that the primer RPI-4 was able to generate single unique bands for three different cultivars, namely, Chintamani-1, Madakkathara-2, and BPP-4. Details of the genotype-specific band generated by different primers are presented in . A similar type of presence/absence of unique DNA band was reported for rice and mango genotypes (Viruel et al., Citation2005; Pandit et al., Citation2007; Raghunathachari et al., Citation2000). In the present study, RPI-1, RPI-4, RPI-5, RPI-7, and RPI-8 were recognized as efficient primers, which would be useful for molecular characterization of other cashew nut accessions in the future. This kind of marker tagging will contribute to the efficient selection and hybridization aimed at genetic improvement of cashew nuts. The results validate the usefulness of RAPD for studies on identification, genetic variability, accession conservation, and domestication of Indian cashew cultivars.
Table 6. Unique RAPD markers differentiating cashew varieties.
Unfortunately, a problem often experienced with RAPD amplification is its poor reproducibility resulting in variable molecular patterns, which are known to be highly influenced by experimental conditions (Devos and Gale, Citation1992; Wolff et al., Citation1993). Since the final PCR product is derived from exponential amplification of the template DNA, minor differences in amplification efficiencies can result in sizable differences in the overall product pattern and yield (Aitchitt et al., Citation1998). Therefore, it would be imperative to optimize the PCR protocol in order that highly repeatable and interpretable results could be generated, particularly when RAPD is used as a diagnostic tool for distinguishing plant cultivars. RAPD analysis can be optimized by varying several components of the PCR, such as type and concentration of thermostable DNA polymerase, dNTPs, MgCl2, primer, and DNA template concentration, and other thermocycling reaction factors, namely, denaturation time and temperature, durations and ‘ramping’ of denaturation, primer annealing, primer extension, as well as the number of amplification cycles. With a view to developing a reliable fingerprinting method for cultivar identification, we had investigated thoroughly each one of these PCR components used for generating RAPD profiles from genomic DNA of mango (Mangifera indica L.) (Jena et al., Citation2010b; Samal et al., Citation2012). The alterations in the different parameters evaluated had varying degrees of repercussions on the RAPD patterns and its reproducibility.
Hence, in the present study, several permutations and combinations of parameters influencing DNA isolation from cashew leaves and PCR amplification were tested and finally a fully-optimized protocol, giving excellent reproducible and reliable results, was developed and this was adopted for further experiments on RAPD analysis of cashew. The results of this research study clearly indicate that RAPD markers can be successfully employed to assess genetic relatedness among the cultivars. Compared to allied molecular techniques like RFLPs, AFLP, etc., RAPD is less expensive, less-tedious, and quicker; therefore, it is more convenient for use in research centers. There were no duplicates observed among the 12 cashew accessions cultivated in Odisha by RAPD markers. Diverse local selections, based on RAPD reports, namely, UN-50, Chintamani-1, BPP-6, Vengurla-1, and BPP-4 could serve as expedient parents towards the development of outstanding cashew cultivars linked with different traits. As cashew improvement programs are recently being launched in the Indian subcontinent, analysis of genetic relationships based on informative polymorphism resulting from RAPD banding data could be useful for plant improvement, descriptions of new cultivars, and also for assessment of cultivar purity in certification programs of fruit crops in general and cashew nut in particular.
Conclusion
In essence, the present study is a rewarding attempt for morphometric as well as molecular characterization of Indian local selections and hybrids of cashew aimed at estimation of genetic diversity among them. In our investigation, both morphological descriptors and RAPD markers proved their effectiveness for distinguishing the different cultivars in cashew germplasm. Distribution of the similarity or dissimilarity coefficients provided an indicator of the efficiency with which techniques detected variation. Dice dissimilarity coefficient based on morphological descriptors displayed a normal distribution, while JSCs based on RAPD were skewed towards higher similarity, the latter indicating a superior discrimination. Owing to their ability to generate higher similarity coefficient values, RAPD primers are endowed with a better ability to differentiate the cashew cultivars more precisely as compared to morphological descriptors. The molecular analysis based on an amplification signal employing RAPD markers is considerably stronger to authentically elucidate genetic relationships. Hence, the latter approach involving molecular marker analysis can have a key role in securing plant cultivar rights as the need to protect proprietary germplasm is likely to be reinforced in the future. This finding will considerably facilitate marker validation for agronomically important characters, genome mapping, molecule cataloging, and recombination breeding programs for development of outstanding new cultivars of cashew in particular and fruit-n-nut crops in general. Further, such analysis of genetic relationships among cashew cultivars could certainly be useful not only for new cultivar descriptions, evaluation of genetic purity essential in plant certification programs, and protection of IPR, but also could facilitate investigations aimed at genetic improvement of cashew via marker-assisted selection and breeding.
Literature cited
- Aitchitt, M., M. Thangavelu, and S.H. Mantell. 1998. The reproducibility of RAPD profiles: Effect of PCR components on RAPD analysis of date palm DNA, p. 225–233. In: Proceedings of 1st international conference on date palm. Al-Ain University, Al-Ain, United Arab Emirates.
- Archak, S., A.B. Gaikward, D. Gautam, E.V.V.B. Rao, K.R.M. Swamy, and J.L. Karihaloo. 2003. Comparative assessment of DNA fingerprinting techniques (RAPD, ISSR and AFLP) for genetic analysis of cashew (Anacardium occidentale L.) accessions of India. Genome 46:362–369.
- Asadiar, L.S., F. Rahmani, and A. Siami. 2012. Assessment of genetic variation in Russian olive (Elaeagnus angustifolia) based on morphological traits and random amplified polymorphic DNA (RAPD) genetic markers. J. Med. Plants Res. 6:1652–1661.
- Asolkar, T., A. Rao Desai, and N.P. Singh. 2011. Molecular analysis of cashew genotypes and their half-sib progeny using RAPD marker. Biotechnol. Bioinf. Bioeng. 1(4):495–504.
- Bachmann, K. 1992. Phenotypic similarity and genetic relationship among populations of Microseris bigelovi (Asteraceae: Lactuceae). Bot. Acta 105:337–342.
- Barik, D.P., L. Acharya, A.K. Mukherjee, and P.K. Chand. 2007. Analysis of genetic diversity among selected grasspea (Lathyrus sativus L.) genotypes using RAPD markers. Z. Naturforsch. C. 62:869–874.
- Burlacu (Arsene), M.C., A.E. Calistru, and C. Leonte. 2011. Evaluation of the genetic diversity among some oil seed rape Brassica napus cultivars revealed by RAPD markers compared with morphological traits evaluation. Luc. Ştiinţif. 54:Nr.1.
- Casas, A.M., E. Lgartus, G. Balaguer, and M.A. Moreno. 1999. Genetic diversity of Prunus rootstocks analyzed by RAPD markers. Euphytica 110:139–149.
- Castiglione, S., G. Wang, G. Damiani, C. Bandi, S. Bisoffi, and F. Sala. 1993. RAPD fingerprints for identification and for taxonomic studies of elite poplar (Populus spp.) clones. Theor. Appl. Genet. 87:54–59.
- Devos, K.M., and M.D. Gale. 1992. The use of random amplified polymorphic DNA markers in wheat. Theor. Appl. Genet. 84:567–572.
- Dhanaraj, A.L., E.V.V.B. Rao, K.R.M. Swamy, M.G. Bhat, P.D. Theertha, and S.N. Sondur. 2002. Using RAPDs to assess the diversity in Indian cashew (Anacardium occidentale L.) germplasm. J. Hort. Sci. Biotech. 77:41–47.
- Dice, L.R. 1945. Measures of the amount of ecologic association between species. Ecology 26:297–302.
- FAOSTAT. 2002. Agriculture Data. <http://apps.fao.org>.
- Ferriol, I.M., B. Pico, C.P. Fernandez, and F. Nuez. 2004. Molecular diversity of germplasm collection of squash (Cucurbita moschata) determined by SRAP and AFLP markers. Crop Sci. 44:653–644.
- Fitmawati, A. Hartana, and S.P. Bambang. 2010. Diversity of Indonesian mango (mangifera indica) cultivars based on morphological and RAPD markers. Sabro J. Breeding Genet. 42(2):83–94.
- Gherardi, M., B. Mangin, B. Goffinet, B.D. Bonnet, and T. Huguet. 1998. A method to measure genetic distance between allogamous populations of alfalfa (Medicago sativa) using RAPD molecular markers. Theor. Appl. Genet. 96:406–412.
- Hameedunnisa B., M.T. Reddy, S. Malathi, B.P. Reddy, G. Narshimulu, J. Nagaraju, and E.A. Siddiq. 2014. Morphological and microsatellite analysis of intravarietal variability in ‘Cherukurasam’ cultivar of mango (Mangifera indica L.). Jordan J. Agr. Sci. 10(3):24–37.
- Hamrick, J.L., and Godt, M.J. 1989. Allozyme diversity in plant species, p. 43–63. In: A.D.H. Brown, M.T. Clegg, A.L. Kahler, and B.S. Weir (eds.). Plant population genetics, breeding and genetic resources. Sinauer Association, Sunderland, MA.
- Hemanth, K.N.V., and N. Vasanthaiah. 2009. Paternity analysis of mango (Mangifera indica L.) hybrids with their parents. Int. J. Fruit Sci. 9:1–10.
- Ishtiaq, A.R., T. Nabila, U.M. Aman, A.M. Saeed, and Y.Z. Mehboob-ur-Rehman. 2008. Assessment of genetic diversity among mango (Mangifera indica L.) genotypes using RAPD markers. Sci. Hort. 117:297–301.
- Jaccard, P. 1908. Nouvellesrecherchessur la distribution florale. Bull. Soc. Vaudoise Sci. Nat. 44:223–270.
- Jena, R.C., K.C. Samal, and B.K. Das. 2010a. Optimization of DNA isolation and PCR protocol for RAPD analysis of Mangifera indica L. J. Agr. Technol. 6:559–571.
- Jena, R.C., K.C. Samal, P.K. Chand, and B.K. Das. 2010b. Molecular characterization of 12 mango germplasm using RAPD markers. Plant. Tiss. Cult. Biotech. 20:91–99.
- Jena, R.C., K.C. Samal, S.K. Narela, and A. Priyadersini. 2010c. DNA fingerprinting of some promising rice (Oryza sativa L.) accessions from India using RAPD markers. Int. J. Intg. Biol. 10:142–146.
- Kanbar, A. 2011. Discriminating between Barley (H. vulgare L.) genotypes using morphological and ISSR markers. Am.-Eu. J. Sustain. Agr. 5:318–324.
- Karihaloo, J.L., Y.K. Dwivedi, S. Archak, and A.B. Gaikwadm. 2003. Analysis of genetic diversity of Indian mango cultivars using RAPD markers. J. Hort. Sci. Biotech. 78:285–289.
- Krishna, H., and S.K. Singh. 2007. Biotechnological advances in mango (Mangifera indica L.) and their future implication in crop improvement: A review. Biotechnol. Adv. 25:223–243.
- Kumar, L.S. 1999. DNA markers in plant improvement. Biotechnol. Adv. 17:143–183.
- Lage, J., M.L. Warburton, J. Crossa, B. Skovmad, and S.B. Andersen. 2003. Assessment of genetic diversity in synthetic hexaploid wheat and their Triticum dicoccum and Aegilops tauschii parents using AFLPs and agronomic traits. Euphytica 134:305–317.
- Mneney, E.E., S.H. Mantell, and M. Bennett. 2001. Use of random amplified polymorphic DNA (RAPD) markers to reveal genetic diversity within and between populations of cashew (Anacardium occidentale L.). J. Hort. Sci. Biotech. 76:375–383.
- Nambiar, M.C., and P.K.T. Pillai. 1985. Cashew, p. 409–438. In: T.K. Bose (ed.). Fruits of India: Tropical and subtropical. Naya Prokash, Calcutta, India.
- Papa, R., G. Attene, G. Barcaccia, A. Ohgata, and T. Konishi. 1998. Genetic diversity in landrace populations of Hordeum vulgare L. from Sardinia, Italy, as revealed by RAPDs, isozymes and morphological traits. Plant Breed. 117:523–530.
- Pandit, S.S., S. Mitra, A.P. Giri, K.H. Pujari, and P.B. Patil. 2007. Genetic diversity analysis of mango cultivars using inter simple sequence repeat markers. Curr. Sci. 93:1135–1141.
- Person, H.A., K. Rumpunen, and L.K. Mollerstedt. 2000. Identification of culinary rhuarb (Rheum spp.) cultivars using morphological characterization and RAPD markers. J. Hort. Sci. Biotech. 75:684–689.
- Prevost, A., and M.J. Wilkinson. 1999. A new system of comparing PCR primers applied to ISSR fingerprinting of potato cultivars. Theor. Appl. Genet. 98:107–112.
- Purseglove, J.W. 1968. Tropical crops: Dicotyledons. Longman Scientific and Technical Press, Harlow, England.
- Raghunathachari, P., V.K. Khanna, U.S. Singh, and N.K. Singh. 2000. RAPD analysis of genetic variability in Indian scented rice germplasm (Oryza sativa L.). Curr. Sci. 79(7):994–998.
- Rao, E.V.V.B., K.R.M. Swamy, and M.G. Bhat. 1998. Status of cashew breeding and future priorities. J. Planta. Crops 26:103–114.
- Ravishankar, K.V., A. Lalitha, M.R. Dinesh, and L. Anand. 2000. Assessment of genetic relatedness among mango cultivars of India using RAPD markers. J. Hort. Sci. Biotech. 75:198–201.
- Rohlf, F.J. 1993. NTSYS pc numerical taxonomy and multivariate system, Version 2.1. Exeter Publ. Ltd., Setauket, New York.
- Samal, K.C., R.C. Jena, S.S. Swain, B.K. Das, and P.K. Chand. 2012. Evaluation of genetic diversity among commercial cultivars, hybrids and local mango (Mangifera indica L.) genotypes of India using cumulative RAPD and ISSR markers. Euphytica 185:195–213.
- Samal, S., G.R. Rout, and P.C. Lenka. 2003. Analysis of genetic relationships between populations of cashew (Anacardium occidentale L.) by using morphological characterization and RAPD markers. Plant Soil Environ. 49:176–182.
- Sambrook, J., E.F. Fritsch, and T. Maniatis. 1989. Agarose gel electrophoresis of DNA and pulse field gel electrophoresis, p. 5.1–5.86. In: Molecular cloning: A laboratory manual, 3rd ed. Cold Springer Harbor Laboratory Press, Cold Spring Harbor, NY.
- Schut, J.W., X. Qi, and P. Stam. 1997. Association between relationships measures based on AFLP markers, pedigree data and morphological traits in barley. Theor. Appl. Genet. 95:1162–1168.
- Shinwari, Z.K., S. Sultan, and T. Mahmood. 2011. Molecular and morphological characterization of selected Mentha species. Pakistan J. Bot. 43:1433–1436.
- Smith, J.S.C., and O.S. Smith. 1989. The description and assessment of distances between inbred lines of maize. II. The utility of morphological, biochemical and genetic descriptors and a scheme for the testing of distinctiveness between inbred lines. Maydica 34:151–161.
- Sneath, P.H.A., and R.R. Sokal. 1973. Numerical taxonomy. Freeman, San Francisco, CA.
- Suwanvijitr, T., J. Kaewmuangmoon, W. Cherdshewasart, and C. Chanchao. 2010. Morphometric and genetic variation in Puerariamirifica cultivars across Thailand. Pakistan J. Bot. 42:97–109.
- Swamy, K.R.M., E.V.V.B. Rao, and M.G. Bhat. 1998. Catalogue of minimum descriptors of cashew (Anacardium occidentale L.) germplasm accessions—II. National Research Centre for Cashew, Karnataka, Puttur.
- Thimmappaiah, S.W.G., D. Shobha, and G.S. Melwyn. 2009. Assessment of genetic diversity in cashew germplasm using RAPD and ISSR markers. Sci. Hort. 120:411–417.
- Viruel, M.A., P. Escribano, M. Barbieri, M. Ferri, and J.L. Hormaza. 2005. Fingerprinting, embryo type and geographic differentiation in mango (Mangifera indica L.) (Anacardiaceae) with microsatellites. Mol. Breed. 15:383–393.
- Weising, K., H. Nybom, K. Wolff, and G. Kahl. 2005. DNA fingerprinting in plants, principles, methods and applications, 2nd ed. Taylor and Francis Group, Boca Raton, FL. ISBN 0-8493-1488-7.
- Welsh, J., and M. McClelland. 1990. Fingerprinting genomes using PCR with arbitrary primers. Nucl. Acids Res. 18:7213–7218.
- Williams, J.G.K., A.R. Kubelic, K.J. Livak, J.A. Rafalski, and S.V. Tingey. 1990. DNA polymorphisms amplified by arbitrary primers are useful as genetic markers. Nucl. Acids Res. 18:6531–6535.
- Wolff, K., E.D. Schoen, and R.J. Peters-Van. 1993. Optimizing the generation of random amplified polymorphic DNAs in Chrysanthemum. Theor. Appl. Genet. 86:1033–1037.
- Yap, V. and R.J. Nelson. 1996. WinBoot: A program for performing bootstrap analysis of binary data to determine the confidence limits of UPGMA-based dendrograms. IRRI, Philippines.