
ABSTRACT
Traditionally, farmers determine when a crop is ready for harvest by observing sensible attributes. They inspect the color or other physical observables which their crops exhibit and make decisions based on these observations and their past experience. This research presents for the first time a mathematical method employing Fourier-transform infrared spectroscopy to quantify the maturation or ripeness of Cameo apple based on the changes in concentrations of selected constituent components (e.g., glucose) in the apple fruit. Cameo apple fruit samples were collected from a single tree every 15 days during the last 60 days of the apple fruit maturation cycle and then analyzed with Fourier-transform infrared spectroscopy. The vibrational bands from the Fourier-transform infrared spectra were assigned to specific functional group. The peak intensities of the vibrational bands corresponding to glucose molecule were normalized and plotted against the number of days remaining before the apple fruit maturity and were observed to show a linear relationship. This relationship can be used to calculate the time required for the apple fruit to reach maturity and also to calculate the concentration of constituent components at any stage of its growth cycle.
Introduction
The apple is the fourth most important fruit crop after citrus, grapes, and banana, and one of the most commercially important horticultural crops grown in temperate parts of the world (Ferree and Warrington, Citation2003). Most cultivated apples belong to Malus × domestica (also known as Mentzelia pumila) in the Rosaceae family. The commercial apple is a hybrid species with a complex history of inter- and intraspecific hybridization. Malus × domestica contains over 7500 cultivars that have originated from different countries in the world (Way et al., Citation1991). Many cultivars have desirable characteristics which make them suitable for cultivation under specific conditions, but only a few dozen of these are grown commercially on a global scale (Way et al., Citation1991). According to Pereira-Lorenzo et al. (Citation2009), the important traits to be considered while determining fruit maturity are fruit size, shape, color, acidity, sweetness, and flavor.
The Cameo is a cultivar of apple, discovered by chance by the Caudle family in a Dryden (Cameo, Citation2017) Washington orchard in 1987. Its parentage is uncertain; it may be a cross between a Red Delicious and a Golden Delicious since it was found near orchards growing those fruits; moreover, it appears similar to the original Delicious cultivar (Cameo, Citation2017). According to the growers at Cornell Orchards (Ithaca, New York), it is a good variety for storing and stays crisp and juicy well into the winter. Cameo apple fruit growth and maturation take place from the beginning of summer until the end of fall. As the apple matures, it increases in weight and changes color from green to red. The color of the fruit’s skin is the primary factor that must be considered while determining its ripeness for harvesting.
The spectral features in Fourier-transform infrared spectroscopy (FTIR) are related to specific chemical groups, which is useful in determining molecular information about a test specimen. The major advantage of this technique is the simplicity of sample preparation which makes it less demanding in terms of time and reagent use than other methods, like chromatographic techniques. Vibrational spectroscopy techniques, such as FTIR and FT-Raman, have been used to follow the evolution of different compounds during the growth and maturation of olive fruit (Lopez-Sanchez et al., Citation2010). In a recent publication (Gohain Barua et al., Citation2010), steady-state fluorescence spectra of chili seeds at raw and ripe states were studied and a spectral signature of ripening was obtained. They suggest that collecting fluorescence spectra for a variety of crops during their respective growing seasons should make it possible to follow the development of a crop’s signature biomedical and biophysical properties which may be profitably exploited to determine the optimum harvest time. 1H–NMR and 12C–NMR techniques have been used (Chaughule et al., Citation2002) to monitor qualitative changes in the sugar fructose and glucose found in the sapota fruit. (Jha and Garg, Citation2010) provided a nondestructive prediction of the quality of intact apples using near-infrared spectroscopy. Raman and FTIR spectroscopy were (Szymańska-Chargot et al., Citation2011) used to assess structural differences between celluloses within apples. Lin et al. (Citation2005) applied FTIR spectroscopy to discriminate between eight Alicyclobacillus strains in apple juice. The potential of FTIR spectroscopy as an analytical technique for determining the concentrations of sugars and organic acids in apple juice was investigated (Tewari et al., Citation1999). Veraverbeke et al. (Citation2005) applied FTIR and Raman spectroscopy to evaluate the natural wax and related surface quality of apple fruit.
Researchers have been applying different spectroscopic techniques on fruits for various purposes, but report on prediction of ripening or maturation of any fruit or crop is still missing. Furthermore, extension of the spectroscopic approaches to the Cameo apple is attractive, since no specific study on temporal variation of FTIR spectra of apples is available in the literature to date. The present work is an approach toward the formulation of a general mathematical model for quantification of maturation or ripening process of any crop or fruit based on the changes in concentrations exhibited by selected constituent components of the crop.
Materials and methods
Cameo apple fruit was collected from the Cornell Orchards, 709 Dryden Road, Cornell University, Ithaca, NY, USA. The fruits were collected from the same tree every 15 days for 60 days, from 21 Aug. to 24 Oct. 2014. This 15-day period between samplings is herein referred to as a ‘growth period.’ shows the progression of growth and maturity of the fruit—based on color—at each sampling date. The fruit was washed with distilled water, cored, cut into small pieces, and liquefied in a blender. The liquid sample was then collected from the blender for FTIR analysis.
Table 1. Sample collection dates (every 15 days) growth stage of the samples based on the observed color of the fruit and number of days remaining before complete maturity.
FTIR spectra were recorded on a Bruker Tensor 27 FTIR spectrometer which was equipped with a room temperature DTGS (deuterated tri-glycine sulfate) detector. Measurements were performed using a Pike Miracle ATR with a germanium crystal. Measurements were taken with scan number 32, resolution of 4 cm–1, and a very good signal-to-noise ratio. The signal-to-noise ratio in the spectrum is proportional to the square root of the acquisition time (scan number). The atmospheric noise and spectrum of the clean ATR element filled with distilled water was recorded and used as a spectral background. This background response spectrum was subtracted from each sample spectrum. The water background was chosen to avoid the overlapping of strong absorption bands from water with the absorption bands from other compounds. FTIR spectra were recorded on each sampling date and are shown in and in respect of the day until the fruit maturity ().
Figure 1. Fourier-transform infrared spectra in the range 650–1800 cm–1 of Cameo apple fruit at five different stages of its maturation process. The five different stages 1, 2, 3, 4, and 5 are corresponding to 60, 45, 30, 15, and 0 days, respectively, until the fruit maturity. The figure shows that the intensity of each peak increases during each 15-day growth period which indicates that the concentrations of each constituent component increase continually throughout the growth cycle. The rate at which the intensity increases was highest during the first growth period (days between stage 1 and 2) and continually decreased during the growth cycle.
Figure 2. Fourier-transform infrared spectra in the range 2000–4000 cm–1 of Cameo apple fruit at different stages of its maturation process. The five different stages 1, 2, 3, 4, and 5 are corresponding to 60, 45, 30, 15, and 0 days, respectively, until the fruit maturity. The figure shows that the intensity of each peak increases during each 15-day growth period which indicates that the concentrations of each constituent component increase continually throughout the growth cycle. The rate at which the intensity of each peak increases was highest during the first growth period (days between stage 1 and 2) and continually decreased during the growth cycle.
The geometric growth rate for each peak on the FTIR spectrum is computed as follows:
In the above equation, the peak intensity at the end of each growth period is divided by the peak intensity from 15 days before. The average value of geometric growth rate for all peaks over each of the four growth periods were plotted against the day remaining before the fruit maturity.
The most intense peak on the FTIR spectrum for the Cameo apples studied herein was at 1056.81 cm–1 () corresponding to glucose peaks. The intensity values for these glucose peaks were normalized by dividing the intensity value at each sampling date (from the spectra 1, 2, 3, 4, and 5 in ) by the highest measured peak intensity (from the spectrum 5 in ). These normalized intensity data were used to develop a plot to make a correlation between Cameo apple fruit maturity time and the intensity of FTIR spectra.
Results and discussion
FTIR spectra of Cameo apple fruit of five different sampling times are shown in and . Spectra are classified according to the days until the fruit maturity, as quantified in with the sampling date. To the weak band at 3509.51 cm–1 in the FTIR spectrum, one could assign the O–H stretching vibration. As no doublet at a separation of approximately 70 cm–1 is evident, the N–H stretching vibration is ruled out (Colthup et al., Citation1964; Gohain Barua et al., Citation2008). A strong and broad band in the region 3700–3100 cm–1 is usually due to O–H stretching vibrations in water (Colthup et al., Citation1964). Although the FTIR spectrum of water was subtracted from the sample spectra, low-intensity peak activity for water is still visible at 3501.51 cm–1. The medium-intensity band at 3088.43 cm–1 corresponds to C–H stretching vibration of the olefin compound (Colthup et al., Citation1964). The medium-intensity band at 2937.9 cm–1, the strong band at 1151.06 cm–1, and the highest-intensity band at 1056.81 cm–1 are the characteristic bands of glucose molecule (Ibrahim et al., Citation2006; Mohamed et al., Citation2011) and these bands arise due to C–H asymmetric stretching, C–O stretching, and C–O, C–C–C asymmetric stretching vibrations, respectively. The methyl group absorbs weakly at 2870 ± 10 cm–1 (Colthup et al., Citation1964); therefore, the C–H symmetric stretch of the methyl group could be attributed to the weak band at 2888.98 cm–1 (Lin et al., Citation2005). The very weak band at 2341.21 cm–1 can be assigned to the P–H stretching vibration. (Colthup et al., Citation1964). The very weak band at 1724.26 cm–1 is assigned to C = O stretching vibration of ester group because the C = O stretching frequency for normal format esters is at 1725–1720 cm–1 (Colthup et al., Citation1964). The medium strong band at 1414.1 cm–1 is due to the deformation vibrations of O–C–H, C–O–H, and C–C–H present in fructose—as observed in the FTIR spectra of strawberry jam (Mohamed et al., Citation2011). The medium strong band at 1341.97 cm–1 is due to the C–H deformation vibrations of amino acid groups—as a band at 1341 cm–1 was attributed to serine (an amino acid) (Colthup et al., Citation1964; Taoutaou et al., Citation2010). Another medium strong band at 1253.73 cm–1 is assigned to citric acid—as this band has also appeared in the FTIR spectra of strawberry jam (Mohamed et al., Citation2011). The Si–O–alkyl group gives rise to a strong band at 1100–1000 cm–1 (Colthup et al., Citation1964). The Si–O stretching vibration could be attributed to the strong band at 1102.98 cm–1. The very strong band at 1076.77 cm–1 is likely due to CO, CC, and CCO stretching vibrations of the sucrose molecule (Mohamed et al., Citation2011). The medium strong bands at 818.06 cm–1, 863.02 cm–1, and 921.69 cm–1 can be assigned to C–H deformation vibrations of fructose and C–H stretching and CH3 rocking vibrations of pectin (a polysaccharide), respectively (Colthup et al., Citation1964; Mohamed et al., Citation2011). The very strong band at 1012.81 cm–1 can be assigned to C–O stretching vibrations of esters as observed in the FTIR spectra of apple juice (Colthup et al., Citation1964; Mohamed et al., Citation2011). The medium strong band 771.9 cm–1 is assigned to skeletal bending of the galactose ring (a monosaccharide sugar) (Pereira et al., Citation2003). The band at 701.45 cm–1—a characteristic band of β-carotene—was seen in the FTIR spectra of apricot sheets (Mohamed et al., Citation2011) and is attributed to β-carotene which is very abundant in plants and fruits (Beta-Carotene., Citation2017).
The geometric growth rates for each peak except the peaks at 2341.21 cm–1 and 1724.26 cm–1 are shown in . The peaks at 2341.21 cm–1 and 1724.26 cm–1 are much less intense and their intensity variation over different growth period is indistinguishable. The average geometric growth rate for all peaks over each of the four growth periods is plotted against the days remaining before the fruit maturity is shown in and fits a perfect third-order polynomial. The geometric growth rates of each peak during a given growth period have a very low standard deviation. Each peak in the FTIR spectra corresponds to a specific constituent component of the sample. Thus, if the geometric growth rate is known for any of the selected constituent components, then that known growth rate can be applied to all constituent components with reasonably high accuracy. The intensity of each peak in the FTIR spectrum increases during each 15-day growth period which indicates that the concentrations of each selected constituent component increase continually throughout the growth cycle. The rate at which the intensity increases was highest during the first growth period and continually decreased during the growth cycle.
Table 2. The geometric growth rates for each vibrational peak in the FTIR spectra of Cameo apple fruit during each growth period (15-day period between sampling).
Figure 3. Plot of average geometric growth rate for all Fourier-transform infrared spectra peaks during the four growth periods. The Cameo apple fruits were collected in every 15 days for 60 days, from 21 Aug. to 24 Oct. 2014. This 15-day period between samplings is herein referred to as a growth period. The geometric growth rate for each component on the spectrum is defined as the ratio between peak intensity at the end of each growth period is divided by the peak intensity from 15 days before. The plot of average geometric growth rate follows a perfect third-order polynomial equation, with
. Here, x and y represent the days until the fruit maturity and the average geometric growth rate, respectively.
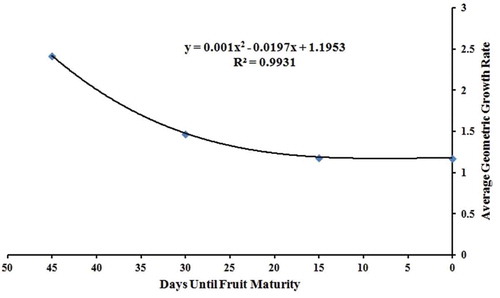
The growth rate for the most intense glucose peak on the FTIR spectrum for the Cameo apples was initially high—2.5 for the first 15 days of observation—but it decreased rapidly to just 1.5 for the following 15 days. As the fruit approached maturity, the growth rate decreased more slowly until it was apparently constant.
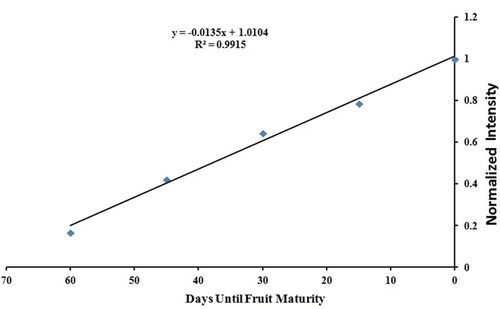
plots the normalized glucose peak intensity at each sampling time. The normalized peak intensities show a strong linear relationship with time. This relationship is expressed as follows:
Figure 4. Plot of normalized intensities of Fourier-transform infrared peak at 1056.81 cm–1––corresponding to glucose molecule, against each sampling time. The intensity values for this glucose peak were normalized by dividing the intensity value at each sampling time by the highest measured peak intensity. The Cameo apple fruits were collected in every 15 days for 60 days, from 21 Aug. to 24 Oct. 2014 which is herein referred to as sampling time. The normalized peak intensities follow a strong linear relationship with time as with
. Here, x and y represent the days until the fruit maturity and the normalized FTIR peak intensity for glucose, respectively. The negative slope of this function arises because time t is numbered as a ‘countdown to maturity.’
where t is the number of days until maturity. The negative slope of this function arises because time t is numbered as a ‘countdown to maturity.’ Here, is the intensity value at each sampling date (from the spectra 1, 2, 3, 4, and 5 in ) and
the highest measured peak intensity (from the spectrum 5 in ). While additional research is required to generalize this equation to all Cameo apples (or more broadly, to different fruits), apple cultivators could use a relationship like this to determine the time remaining for a given apple crop to reach maturity.
It is worthwhile to mention here that intensity of the peaks on the FTIR spectrum is directly proportional to the concentration of the corresponding constituent components. Therefore, FTIR peak intensity can be referred in alternation of concentration of the corresponding component. The normalized glucose peak intensity is a unit-less number describing the ratio between the glucose concentration at the time of measurement and the desired concentration at harvest time. This ratio can be determined by measuring the glucose concentration at any point during the growth of the fruit by any applicable measurement method and dividing that concentration by the desired mature-state glucose concentration. Once obtained, the normalized glucose intensity can be used with Equation (2) to determine the number of days left until the fruit is fully mature. Alternatively, if the desired glucose concentration in the apple crop at maturity is unknown but the time left in the growth cycle is known, then measuring the glucose concentration at any two times during the growth cycle could provide an estimate of the final glucose concentration in the mature fruit by using the following equation:
where is the concentration of glucose at the end of the growth cycle and
and
are glucose concentrations (or peak intensities) at two different times (
and
) during the growth cycle. Effectively, if a farmer knows the glucose concentration at any two times in his Cameo crop’s growth cycle, then he can forecast the glucose concentration at a given date of harvest using Equation (3).
Conclusion
This research presents a novel use for FTIR spectroscopy techniques to quantify the maturation progress of apple fruits. The vibrational band analysis of FTIR spectra expresses the chemical composition and maturity of the Cameo apple. Using the relationship between peak response and time until fruit maturity (Equation 2), it is possible to calculate the time required for the fruit to reach maturity. Conversely, if the amount of time remaining until harvest is known and the concentration of glucose is measured at two times during the growth cycle, then it is possible to accurately forecast the concentration of glucose at harvest time using Equation (3).
Additionally, this research shows that the geometric growth rates of the concentrations for every component measured with FTIR were very nearly the same. This suggests that any method which can measure the growth rate of a single component may then be used to generalize the growth rates of all other components. If the frequency of observation is increased and additional food crops are studied, it may be possible to construct a generalized mathematical model quantifying the growth rates or ripening of any crops. Such a model would allow for accurate estimates of the growth rates of important food components having nutritional or biomedical utility.
Acknowledgments
S. Hazarika offers his sincere thanks to the University Grant Commission (UGC), New Delhi, India for awarding the Raman postdoctoral fellowship 2014–2015. This work made use of the Cornell Center for Materials Research Facilities supported by the National Science Foundation under Award Number DMR-1120296. We thank Eric C. Shatt, manager of Cornell Orchards, for his help in providing the apple samples.
References
- Beta-Carotene. 2017. Wikipedia. 16 Apr. 2017. http://en.wikipedia.org/wiki/Beta-Carotene.
- Cameo (apple). 2017. Wikipedia. 16 Apr. 2017. https://en.wikipedia.org/wiki/Cameo_(apple).
- Chaughule, R.S., P.C. Mali, R.S. Patil, G.D. Joshi, and Y.M. Lo. 2002. Magnetic resonance spectroscopy study of Sapota fruit at various growth stages. Innov. Food Sci. Emer. Tech. 3:185–190. doi: 10.1016/S1466-8564(02)00003-6.
- Colthup, N.B., L.H. Daly, and S.E. Wiberly. 1964. Introduction to Infrared and Raman Spectroscopy. 2nd ed. Academic Press, New York & London.
- Ferree, D.C., and I.J. Warrington. 2003. Apples––botany, production, and uses. 1st ed. CABI, UK.
- Gohain Barua, A., S. Hazarika, J. Sarmah Pathak, and C. Kalita. 2008. Spectroscopic investigation of the seeds of chili (Capsicum annum L.). Int. J. Food Sci. Nutr. 59:671–678. doi: 10.1080/09638280701623810.
- Gohain Barua, A., S. Hazarika, J. Sarmah Pathak, and S. Manhas. 2010. Spectral signature of ripening in the seeds of chili (Capsicum annum L.). Spectrosc. Lett. 43:163–166. doi: 10.1080/00387010903284307.
- Ibrahim, M., M. Alaam, H. El-Haes, A.F. Jalbout, and A. De Leon. 2006. Analysis of the structure and vibrational spectra of glucose and fructose. Eclet. Quim. 31:15–21. doi: 10.1590/S0100-46702006000300002.
- Jha, S.N., and R. Garg. 2010. Non-destructive prediction of quality of intact apple using near infra-red spectroscopy. J. Food Sci. Technol. 47:207–213. doi: 10.1007/s13197-010-0033-1.
- Lin, M., M. Al-Holy, S.S. Chang, Y. Huang, A.G. Cavinato, D.H. Kang, and B.A. Rasco. 2005. Rapid discrimination of alicyclobacillus strains in apple juice by Fourier transform infrared spectroscopy. Int. J. Food Microbiol. 105:369–376. doi: 10.1016/j.ijfoodmicro.2005.04.018.
- Lopez-Sanchez, M., M. Jose Ayora-Canada, and A. Molina-Diaz. 2010. Olive fruit growth and ripening as seen by vibrational spectroscopy. J. Agr. Food Chem. 58:82–87. doi: 10.1021/jf902509f.
- Mohamed, G.F., M.S. Shaheen, S.K.H. Khalil, A.M.S. Hussein, and M.M. Kamil. 2011. Application of FTIR spectroscopy for rapid and simultaneous quality determination of some fruit products. Nat. Sci. 9:21–31.
- Pereira, L., A. Sousa, H. Coelho, A.M. Amado, and P.J.A. Ribeiro-Claro. 2003. Use of FTIR, FT-Raman and 13C-NMR spectroscopy for identification of some seaweed phycocolloids. Biomol. Eng. 20:223–228. doi: 10.1016/S1389-0344(03)00058-3.
- Pereira-Lorenzo, S., A.M. Ramos-Cabrer, and M. Fischer. 2009. Breeding apple (Malus × domestica Borkh). In: Mohan S.J. and Priyadarshan P.M. (eds.). Breeding plantation tree crops: Temperate species. Springer, USA.
- Szymańska-Chargot, M., J. Cybulska, and A. Zdunek. 2011. Sensing the structural differences in cellulose from apple and bacterial cell wall materials by Raman and FT-IR spectroscopy. Sensors. 11:5543–5560. doi: 10.3390/s110605543.
- Taoutaou, A., C. Socaciu, D. Pamfil, F. Fetea, E. Balazs, C. Botez, A. Chis, D. Briciu, and A. Briciu. 2010. A. Fourier-transform infrared spectroscopy applied for studying compatible interaction in the pathosystem phytophtora infestans-solanum tuberosum. Not. Bot. Hort. Agrobot. Cluj. 38:69–75.
- Tewari, J., M. Joshi, A. Gupta, R. Mehrotra, and S. Chandra. 1999. Determination of sugars and organic acid concentration in apple juices using infrared spectroscopy. J. Sci. Ind. Res. India. 58:19–24.
- Veraverbeke, E.A., J. Lammertyn, B.M. Nicola, and J. Irudayaraj. 2005. Spectroscopic evaluation of the surface quality of apple. J. Agric. Food Chem. 53:1046–1051. doi: 10.1021/jf0486848.
- Way, R.D., H.S. Aldwinckle, R.C. Lamb, A. Rejman, S. Sansavini, T. Shen, R. Watkins, M.N. Westwood, and Y. Yoshida. 1991. Apples (Malus), p. 1–63. In: Moore J.N. and Ballington J.R. (eds.). Genetic resources of temperate fruit and nut crops: Acta horticulture. International Society of Horticultural Sciences, Wageningen. Netherlands.