
ABSTRACT
Phenolic content and antioxidant capacity of five Yellow European plums (Prunus domestica) were studied using heat reflux extraction. Fresh plums were extracted at 50°C and 70°C, while freeze dried plums were extracted at 50°C, 60°C, and 70°C. Quantification of phenolic compounds such as ascorbic acid, neochlorogenic acid, and chlorogenic acid, was performed using high performance liquid chromatography. Antioxidant activity was determined by evaluating the scavenging ability of 2,2-diphenyl-1-picrylhydrazyl (DPPH) and ferric (Fe3+) free radicals. Total phenolic content and ferric reducing antioxidant potential were highest for freeze dried samples extracted at 60°C whereas extraction at 70°C resulted in the lowest yield. Neochlorogenic acid was the predominant phenolic compound in each plum genotype followed by ascorbic acid and chlorogenic acid. This study demonstrates that there is an adequate amount of health promoting phytochemicals within European plums, hence extraction of these compounds have potential for use towards functional food, nutraceutical, and pharmaceutical industries.
Introduction
Free radicals are generated through natural body processes and by extrinsic factors such as radiation, pollution, and ultraviolet light (Krishnaswamy et al., Citation2013). Excessive formation of free radicals in the body can lead to the depletion of antioxidants, causing oxidative stress (Routray, Citation2014). Oxidative stress is associated with the numerous diseases such as heart disease, diabetes, and certain types of cancer (Manohar et al., Citation2017). To mitigate the negative effects of oxidative stress, an adequate amount of antioxidants must be provided through a proper diet since they quench free radicals, thereby hindering oxidation. Epidemiological studies have shown that there is an inverse relationship between antioxidant intake and the occurrence of degenerative diseases (Graf et al., Citation2005; Pandey and Rizvi, Citation2009; Pham-Huy et al., Citation2008; Yao et al., Citation2004). Hence, fruits and vegetables, with high phenolic content, may contain the necessary antioxidants to scavenge free radicals and protect cells from oxidative stress. Plums are one fruit which have shown to contain numerous phenolic compounds and antioxidants.
Plums are an abundant food crop with an estimated global production of 11.5 million tonnes in 2013, with Asia and Europe being the largest contributors producing 7.5 and 2.9 million tons respectively (FAO, Citation2011). In Canada, the plum production in 2013 was approximately 3,917 tons with Ontario and British Columbia producing 3,828 tons combined (Statistics Canada, Citation2016). Most commercially grown plums in Canada are either of European or Japanese types. European plums are traditionally blue-black in color; however, through conventional breeding, yellow skinned European plums can be developed. These Yellow European Plums have been called YEPs (Dowling, Citation2014). Traditional European plums contain a high amount of phenolic acids, flavonoids, carotenes, vitamins with high antioxidant activity, higher than both oranges and strawberries (Arion et al., Citation2014; Tokuşoğlu, Citation2011). In spite of lacking the typical blue-black color, YEPs also have high phenolic and antioxidant content (Dowling, Citation2014). The predominant phenolic compounds present in YEPs are isomers of caffeoylquinic acid which include neochlorogenic acid, cryptochlorogenic acid, and chlorogenic acid (Slimestad et al., Citation2009). Neochlorogenic acid is the most abundant phenolic compound in YEPs and has been reported to be one of the best scavengers of free radicals (Murcia et al., Citation2001). YEPs are also rich in hydroxycinnamic acids which also work as free radical scavengers and metal chelators (Murcia et al., Citation2001). Plums and their dried counterpart, prunes, have been the focus of many studies with respect to their health promoting properties, which have reported promising results in the areas of gastrointestinal symptoms (Piirainen et al., Citation2007), bladder health (Cremin et al., Citation2001), bone marrow restoration (Rendina et al., Citation2012), and cognitive development (Shukitt-Hale et al., Citation2009). Hence, the extraction of these antioxidants and phenolic compounds from plums can be utilized in industries such as functional foods, pharmaceuticals, and nutraceuticals. Extraction is an important step in the recovery of bioactive compounds from plant and food matrices. Conventional extraction methods such as heat reflux and soxhlet, remove the bioactive compound from a food source through the use of solvents, such as methane, hexane, and ethanol, along with heat and agitation (Singh and Orsat, Citation2015). Heat reflux extraction is frequently used for the extraction of phenolic compounds as it is a simple and inexpensive process (Singh and Orsat, Citation2015).
The aim of this study was to determine the phenolic content and antioxidant capacity of YEPs, and to quantify phenolic compounds, specifically ascorbic acid, neochlorogenic acid, and chlorogenic acid. The effect of genotype (V99261, V94021, V91074, V98197, and V95141), temperature (50°C, 60°C, and 70°C), and treatment (fresh and freeze dried) on total phenolics and antioxidant activity, using heat reflux extraction, were also evaluated.
Materials and methods
Fruits and chemicals
Five genotypes of YEPs, V99261, V94021, V91074, V98197, and V95141 (Supplementary Figures A to E), were studied. The chemical characteristics of each genotype are summarized in . All genotypes were bred and maintained in the research station at Vineland, Ontario. Fresh plums were stored at 4°C until analyzed. Fresh, pitted plums were frozen at −25°C for 24 hours and then dried in a freeze dryer (Martin Christ GmbH, ALPHA 1- 2LDplus Freeze Dryer, Osterode, Germany) for 48 hours. The freeze-dried plums were ground into a fine powder, using a blender (Magic Bullet Single Shot, MB-IM301/3–02), for further analysis. Folin-Ciocalteu reagent, sodium bicarbonate (NaHCO3), gallic acid, 2,2-diphenyl-1-picrylhydrazyl (DPPH), 2,4,6-Tri(2-pyridyl)-s-triazine (TPTZ), formic acid, ammonium formate, and neochlorogenic acid were purchased from Sigma-Aldrich (Sigma-Aldrich Canada Co., Oakville, Ontario, Canada), whereas methanol, ascorbic acid, sodium acetate, sodium hydroxide (NaOH), hydrochloric acid (HCl), ferric chloride, and chlorogenic acid were obtained from Fisher Scientific (Fisher Scientific Company, Ottawa, Ontario, Canada).
Table 1. Chemical characteristics of each genotype studied.
Preparation of methanolic plum extracts
Fresh plum samples were prepared by homogenizing each genotype using a mortar and pestle. Two grams of fresh and dried plum was mixed with 20 mL of methanol. The fresh samples were then placed in separate water baths set at 50ºC and 70°C for 90 minutes where the dried samples were placed in water baths at 50°C, 60°C, and 70°C for 90 minutes. The homogenates were then centrifuged (Servall Enclosed Superspeed Centrifuge, Type SS-4, Norwalk, USA) at 10,000 rpm for 10 minutes and the supernatants were collected and filtered through a 0.45 µm filter and stored at 3°C for further analysis. This filter pore size was chosen as it rejects molecules of weights greater than 1000 MW which is ideal for the separation of polyphenols which have a molecular weight between 164.2 to 448.4 MW (Nawaz et al., Citation2006).
Determination of total phenolic content
Total phenolic content was determined using a modified protocol of Singh et al. (Citation2011) . One mL of methanolic plum extract was mixed with 7.5 mL double distilled water and 0.5 mL Folin-Ciocalteu reagent. After approximately 5 minutes, 1 mL of 5% NaHCO3 solution was added and the solution was vortexed and stored in the dark at room temperature for 90 minutes. The sample absorbance was measured at 765 nm with a spectrophotometer (Biochrom visible spectrophotometer, Ultrospec 100 pro, Cambridge, England). Total phenolic content was determined using a standard curve from various concentrations (0.02, 0.04, 0.06, 0.1, 0.2 mg/mL) of gallic acid prepared in methanol. The amount of total phenolic content was expressed in terms of gallic acid equivalents (GAE) in mg per g of plum (fresh weight) (Equation 1).
Where ‘y’ is the sample absorbance at 765 nm and ‘x’ is the gallic acid concentration in mg/mL.
Scavenging activity on 2,2-diphenyl-1-picrylhydrazyl radicals
The free radical scavenging activity of plum extracts on DPPH radicals was measured according to a modified method proposed by Singh et al. (Citation2011). Fifty µL of methanolic extract was added to 1.5 mL DPPH solution (3.94 mg/100 mL methanol). Free electrons present in DPPH get paired off in presence of antioxidants and the absorption decreases as the result of extinction of DPPH’s purple color. Decolorisation was determined by measuring the absorption at 517 nm in the spectrophotometer after 20 min. Scavenging activity on DPPH radicals was expressed as the percentage (%) inhibition using following equation:
Where Abscontrol is the absorption of the blank sample at 517 nm and Abssample is the absorption of methanolic plum extract at 517 nm.
Determination of ferric reducing antioxidant potential
The ferric reducing antioxidant potential (FRAP) method measures antioxidants ability to reduce colorless ferric complex (Fe3+-tripyridyltraizine) to blue colored ferrous complex (Fe2+-tripyridyltraizine) at a low pH. The change in the samples absorbance is directly proportional to the reducing power of the antioxidants present (Dowling, Citation2014). The method used to measure FRAP of the antioxidants present in the methanolic plum extracts was a modified Routray et al. (Citation2014). Fresh FRAP reagent was prepared daily using 300 mM sodium acetate buffer (pH 3.7), 10 mM TPTZ prepared in 40 mM HCl, and 20 mM ferric chloride mixed in a 10:1:1 volume ratio respectively. Twenty microliters of methanolic extract was mixed with 300 µL of double distilled water and 2 mL of FRAP reagent and incubated in a 37°C water bath for 30 minutes. Following incubation, the absorbance of the sample was read in a spectrophotometer (BIO-RAD Microplate Reader, Model 3550, Tokyo, Japan) at 595 nm. A standard curve was plotted using various concentrations of ascorbic acid prepared in methanol (0.02, 0.04, 0.06, 0.1, 0.2 mg/mL) versus its absorbance at 595 nm. The standard curve for ascorbic acid (Equation 3) was used in the quantification of FRAP activity, reported in terms of ascorbic acid equivalent in mg per g fresh sample.
Where ‘y’ is the absorbance at 595 nm and ‘x’ is the ascorbic acid concentration in mg AAE/g sample.
High performance liquid chromatography analysis
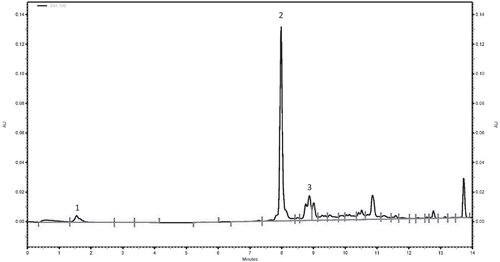
High performance liquid chromatography (HPLC) was used to quantify ascorbic acid, neochlorogenic acid, and chlorogenic acid in the methanolic extracts, as these are the most predominant compounds present in plums (Chun et al., Citation2003a; Piga et al., Citation2003; Slimestad et al., Citation2009). A Beckman Coulter System Gold instrument was used and consisted of a 166 UV detector, set at 280 nm, 126 solvent pump, and a 508 refrigerated autosampler, set at 12°C. Phenolic compounds were separated using a reverse phase C18 Gemini-NX (5µm, 150 mm x 4.6 mm) column (Phenomenex, Inc., Torrance, CA, USA), fitted with a 4 mm x 3 mm Gemini-NX guard column (Phenomenex, Inc., Torrance, CA, USA). The mobile phase was composed of solvent buffer A (10 mM formic acid in water, pH 3.5, with NaOH) and buffer B (5 mM ammonium formate in methanol) and the solvent gradient was as follows: 0–1 min 100% buffer A, 1–5 min 0–30% buffer B, 5–8.5 min 30–70% buffer B, 8.5–14 min 70–100% buffer B. Twenty microliters of sample was injected using a flow rate of 1 mL/minute where the phenolic compounds were then detected at 280 nm. Chromatographic analysis was performed using 32 Karat Software (Version 1.3). Chromatographic peaks were identified as phenolic compounds present based on their retention times of standards which were observed to be 1.8 minutes for ascorbic acid, 7.9 minutes for neochlorogenic acid, and 8.8 minutes for chlorogenic acid ( and ). Standard solutions (0.1 mg/mL) for each compound were prepared in the methanol and diluted to various concentrations between 2.5 and 100 µg/mL. Phenolic compounds were quantified in the extracts using the respective standard curves () which were plotted as area under the curve versus concentration (µg/mL).
Table 2. Phenolic compounds and their corresponding equations for the quantification of total phenolics with retention time.
Figure 1. HPLC chromatogram of fresh plum methanolic extract. Ascorbic acid (peak 1), Neo-chlorogenic acid (peak 2), and Chlorogenic acid (peak 3).
Statistical analysis
All experimental combinations to determine total phenolic content and antioxidant activity of extracted samples were conducted and analyzed in triplicate. Total values for phenolic content and antioxidant activity are presented in this paper as the mean ± standard deviation of three replicates. The results of extracted samples were analyzed under a 2x3x5 factorial design (treatment x temperature x genotype). Tukey honestly significant difference (HSD) test and analysis of variance (ANOVA) was conducted to determine the significance of genotype, treatment, and temperature on phenolic content and antioxidant activity. All statistical design and analysis were conducted using JMP software version 11 (SAS Institute Inc., Cary, NC, USA).
Results and discussion
Determination of total phenolics
Total phenolic content for both fresh and freeze dried fruits from the five genotypes studied are listed in . Total phenolic content for fresh plums ranged from 3.17 to 7.61 mg GAE/g FW. A study conducted by Kim et al. (Citation2003) reported a similar range of phenolic content between 1.25 to 3.73 mg GAE/g FW for 11 cultivars of Japanese and European plums. In a similar study, Chun et al. (Citation2003b) observed a range of 1.38 to 6.85 mg GAE/g FW for 11 cultivars of fresh Japanese and European plums. Dowling (Citation2014) and Rupasinghe et al. (Citation2006) both evaluated the phenolic content of YEPs and reported ranges of 1.00 to 2.07 mg GAE/g FW and 0.86 to 4.13 mg GAE/g FW respectively, which is consistent with the range found in this study. Gil et al. (Citation2002) studied the phenolic content of various stone fruits such as nectarines, plums, and peaches. They found the total phenolic content in fresh plums to be between 0.42 and 1.09 mg/g FW, which was higher than yellow flesh nectarines (0.18–0.54 mg/g FW), and yellow flesh peaches (0.21–0.61 mg/g FW). The plums studied by Gil et al. (Citation2002) had similar phenolic content to white flesh nectarines (0.14–1.02 mg/g FW), and white flesh peaches (0.28–1.11 mg/g FW). The 5 genotypes of plums studied contain a similar range of total phenolics to other Japanese and European plums, while some of them also contained higher levels than other stone fruits such as peaches and nectarines. The freeze dried plums yielded a significantly higher phenolic content, 23.27 to 54.08 mg GAE/g DW, compared to the fresh plums, since freeze drying creates a porous sample, allowing for increased solvent penetration, thereby increasing extraction yield (Routray et al., Citation2014; Stacewicz-Sapuntzakis, Citation2013). Dowling (Citation2014) also found that drying plums through various treatments resulted in an increase of bio-availability of phenolic content by approximately 200 per cent.
Table 3. Total phenolic content of fresh and freeze dried yellow European plums at various heat reflux extraction temperatures.
For most genotypes, an increase in extraction temperature resulted in an increase of phenolic content (). For fresh and freeze dried plums, there was no significant difference between extraction at 50°C and 70°C whereas extraction at 60°C yielded the highest amount of phenolic compounds for freeze dried plums. This trend can be observed since extraction at temperatures greater than 70°C often leads to degradation and oxidation of sensitive compounds (Dai and Mumper, Citation2010). Spigno et al. (Citation2007) found similar results in that extraction at 60°C resulted in higher phenolic yields from grape marc than that at 45°C. Vatai et al. (Citation2009) also found that an increase in temperature from 20°C to 60°C increased the yield of phenolic compounds from elder berry and grape marc. There was also a significant difference between the phenolic content of each genotype. V98197 showed higher content for both fresh and freeze dried samples followed by V95141, V94021, V91074, and V97261. Genotype V97261 had the lowest phenolic content for both fresh and freeze dried treatment. This can be attributed to its large size and chemical composition. The variation of phenolic content between each genotype demonstrates the genetic variability of each plum (Rupasinghe et al., Citation2006). ANOVA analysis of total phenolics for fresh and freeze dried plums are summarized in supplementary Tables S1 and S2 respectively. For fresh plums, the coefficient of determination (R2) was 0.714 which is in reasonable agreement with the adjusted R2 which was 0.5331, since the difference is less than 0.2. The p-value for the model (0.0047) is significant which indicates that it could be used to predict phenolic content in fresh YEPs. Genotype (p = 0.0004) was the only significant factor whereas temperature and its interaction term (genotype*temperature) was not (p > 0.05). For freeze dried plums, the R2 value generated was 0.91 which is in agreement with the adjusted R2 value of 0.868. The model term was also significant (p < 0.0001), indicating that the model generated may be used to determine total phenolic content in freeze dried extracts. Genotype, temperature, and their interaction term (genotype*temperature) were all significant factors on the yield of total phenolics (p < 0.0001, p = 0.0468, and p = 0.0084 respectively). Similarly, genotype and temperature also showed significant differences in total phenolics of the freeze dried samples.
HPLC analysis
One of the objectives of this study was to quantify the various phenolic compounds present in YEPs. Hence, by using HPLC, several compounds were detected in the methanolic plum extracts, specifically ascorbic acid, neochlorogenic acid, and chlorogenic acid (). The compounds were identified and assigned according to their chromatographic peaks and retention times (). and illustrate that YEPs are a rich source of phenolic compounds, primarily neochlorogenic acid, while ascorbic acid and chlorogenic acids were present in low amounts. Temperature and treatment showed no effect on yield of the specific compounds for each genotype. These findings are in agreement with previous studies which reported that neochlorogenic acid was the predominant compound in various cultivars of plums and other stone fruits (Goldner et al., Citation2015; Jaiswal et al., Citation2013; Murcia et al., Citation2001; Piga et al., Citation2003; Slimestad et al., Citation2009; Tomás-Barberán et al., Citation2001).
Table 4. HPLC analysis of total ascorbic acid, neo-chlorogenic acid, and chlorogenic acid content in fresh and freeze dried YEPs.
Genotypes V98197 and V95141 were observed to have the highest amount of ascorbic, neochlorogenic, and chlorogenic compounds over the other genotypes studied. Genotype V94021 also proved to have comparable content of compounds at 50ºC and 60°C. This trend was also observed in the analysis of total phenolic content for all genotypes (), where V98197 and V94021 contained the highest content of phenolic compounds for each treatment. Both genotypes V98197 and V94021 have also contained high amounts of compounds of compounds when dried into prunes, making them a suitable choice for product development (Brar et al., Citation2017, Unpublished data). The identification of phenolic compounds in YEPs may be of interest to those in the food and pharmaceutical industries as antioxidants are often an expensive commodity. Hence, YEPs serve as a renewable source for these extracted compounds for use in functional foods and other nutraceutical applications.
Determination of radical scavenging activity
Scavenging activity is a measure of the ability of the antioxidants present to bind with free radicals. A higher inhibition percentage is the result of higher antioxidant capacity. The scavenging activity of the fresh plums ranged from 14.43 to 50.93%, where the freeze dried plums ranged between 40.06 to 89.99% (). Freeze drying resulted in a significant increase of scavenging activity amongst the genotypes, compared to fresh plums, as freeze drying increases the bioavailability of the antioxidants present (Routray et al., Citation2014). Similar results were found by Routray et al. (Citation2014) where freeze drying resulted in the largest inhibition percentage in dried blueberry leaves over microwave and hot air drying. Murcia et al. (Citation2001) conducted a study evaluating the antioxidant properties of various Mediterranean fruits where they reported that plums had the highest inhibition percentage (97%) over apricots (93%), oranges (86%), peaches (87%), and strawberries (39%). Melicháčová et al. (Citation2010) reported cherries to have a DPPH inhibition percentage of 2.4 to 9.9% which is lower than the range found for the YEP genotypes studied. When compared to other stone fruits such as nectarines and peaches, it was reported that plums had a higher antioxidant capacity (Gil et al., Citation2002).
Table 5. Antioxidant scavenging activity of DPPH free radical for fresh and freeze dried yellow European plums at various heat reflux extraction temperatures.
Extraction temperature did not have any effect on the antioxidant capacity for both fresh and freeze dried samples. All fresh samples yielded relatively similar antioxidant capacities, with a slight increase in antioxidant capacity when extracted at 70°C. As expected, due to the genetic variability between each genotype where genotypes V94021 and V91074 showed no significant difference between each other, V98197 and V95141 also exhibited no significant difference. Genotype V97261 yielded the lowest antioxidant scavenging activity for both fresh and freeze dried, which can be attributed to its large size. For freeze dried samples, an increase in extraction temperature slightly decreased the scavenging activity. This trend can be attributed to prolonged exposure at high temperatures which may degrade heat sensitive compounds and antioxidants. From ANOVA analysis of fresh extracts (Supplementary Table S1) the coefficient of determination was 0.8264 which is in agreement with the adjusted R2 value of 0.7223. The model developed was significant (p = 0.0003), indicating that it can be used to determine antioxidant scavenging activity for different parameters. Genotype and temperature were also significant factors (p < 0.0001 and p = 0.0215 respectively), while their interaction term (genotype*temperature) was not (p = 0.8469). ANOVA analysis of freeze dried extracts (Supplementary Table S2) generated a coefficient of determination of 0.9798 which is in agreement with the adjusted R2 value of 0.9649. Because of the generated R2 values and the model term being significant (p < 0.0001), this model may be used to determine DPPH scavenging activity in freeze dried extracts. Genotype, temperature, and their interaction term were all significant (p < 0.0001 for all), which was also observed in .
Determination of ferric reducing antioxidant potential
FRAP assay was the second method used to determine antioxidant capacity in the methanolic plum extracts. FRAP measures the ability of antioxidants to reduce the ferric complex (Fe3+) to the ferrous complex (Fe2+) via color and absorbance change. FRAP was quantified using a modified Routray et al. (Citation2014) method, where FRAP was expressed as ascorbic acid equivalents (AAE), since it is a potent antioxidant (Routray et al., Citation2014). FRAP for fresh samples ranged between 156.05 to 284.13 mg AAE/g FW where freeze dried extracts ranged between 619.95 to 1359.71 mg AAE/g DW (). Rupasinghe et al. (Citation2006) and Dowling (Citation2014) reported similar ranges, between each other, for FRAP activity of fresh European plums between 1.05 to 4.24 mg AAE/g FW and 1.21 to 2.29 mg AAE/g FW respectively, which is lower than the range found for the YEP genotypes in this study. For all genotypes, freeze drying resulted in a significant increase of FRAP over fresh extracts. This trend can be observed since drying increases the bioavailability of antioxidants present. For most freeze dried extracts, FRAP activity increased with an increase in temperature from 50 to 60°C; however, decreased when temperature was increased to 70°C. This trend was also observable for total phenolics () and DPPH scavenging activity (). A similar observation was made by Routray et al. (Citation2014) where FRAP activity increased when the drying temperature of blueberry leaves increased from 45°C to 60°C; however, decreased when increased to 75°C. While temperature exhibited no effect on the FRAP activity in fresh extracts, 60°C was significantly different than extraction at 50°C and 70°C for freeze dried extracts. There was also no significant difference between each genotype for FRAP activity. Supplementary Table S1 lists the results from ANOVA analysis of fresh extracts. For FRAP, the R2 value generated was 0.7476 which is in general agreement with the adjusted R2 value of 0.634. The model generated was significant (p = 0.0002), which signifies that it could be used to determine FRAP activity in fresh extracts. Genotype was the only significant factor (p < 0.0001), where temperature and its interaction term were not significant (p = 0.9488 and p = 0.8573 respectively). ANOVA analysis of freeze dried extracts (Supplementary Table S2) generated a coefficient of determination of 0.9458 which is in agreement with the adjusted R2 value of 0.9206. Because of the generated R2 values, and the model term being significant (p < 0.0001), this model may be used to determine FRAP activity in freeze dried extracts. Genotype, temperature, and their interaction term were all significant (p < 0.0001 for all), in which the same trend was also observed in .
Table 6. Ferric complex (Fe3+) reducing antioxidant potential (FRAP) of fresh and freeze dried yellow European plums at various heat reflux extraction temperatures.
Correlation between phenolic content and antioxidant activity
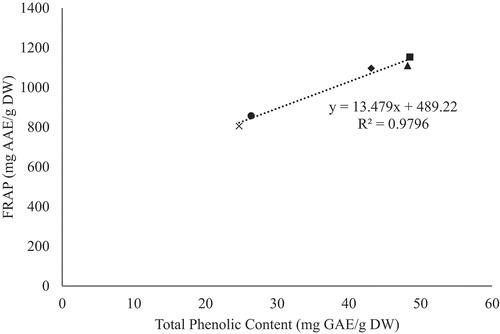
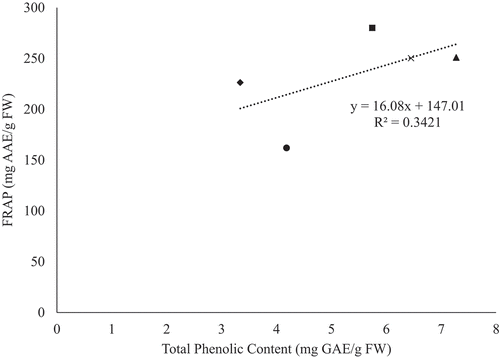
The antioxidants, present in fruits and vegetables, possess properties such as free radical scavenging, metal chelating, and hydrogen donation, which can be attributed to their phenolic content (Arion et al., Citation2014; Piluzza and Bullitta, Citation2011). Hence, determining the correlation between total phenolic content (TPC) and antioxidant activity, in YEPS, is suggestive of its antioxidant properties. The correlation between TPC and antioxidant activity, for all freeze dried genotypes, is illustrated in and . It can be observed that there is a positive correlation between TPC and DPPH scavenging activity (R2 = 0.8974), as well as FRAP activity (R2 = 0.9796). This observation indicates that phenolic rich genotypes contain strong antioxidant properties. Previous studies have also observed similar results in that an increase in TPC has led to an increase in antioxidant activity in onions (R2 = 0.96) (Manohar et al., Citation2017), White Carpathians plums (R2 = 0.893) (Rop et al., Citation2009), and peaches and nectarines (R2 > 0.9) (Gil et al., Citation2002). A similar study, conducted by Rupasinghe et al. (Citation2006), also observed a strong correlation (R2 = 0.96) between TPC and antioxidant activity in YEPS, which they attributed to their phenolic compounds.
Figure 2. Correlation between total phenolic content and DPPH scavenging activity for freeze dried genotypes.
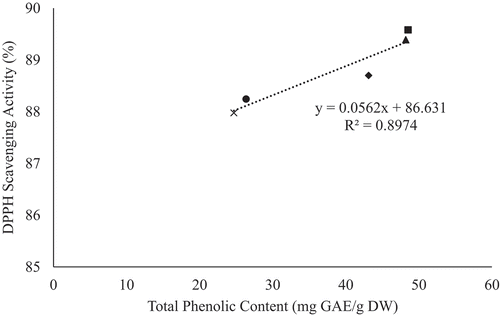
Figure 3. Correlation between total phenolic content and FRAP activity for freeze dried genotypes.
In contrast, the correlation between TPC and antioxidant activity, for all fresh genotypes, were observed to have poor correlation for both DPPH (R2 = 0.3774) and FRAP (R2 = 0.3421) activity ( and ). This observation could be due to the genotypic variation amongst the YEPs studied, as well as detection of unrelated reactions during the antioxidant assays. Poor correlation between TPC and antioxidant activity could also be attributed to other substances present in the sample, other than phenols, which may have been oxidized by the Folin-Ciocalteu reagent (e.g. iron, adenosine, oleic acid, and proteins) when determining total phenolic content (Fatiha et al., Citation2012). Moreover, the DPPH assay method may provide false interpretations of antioxidant content due to its ability to be decolorized by reducing agents present (e.g. ascorbic acid) and reactions other than electron transfer (Prior et al., Citation2005).
Figure 4. Correlation between total phenolic content and DPPH scavenging activity for fresh genotypes.
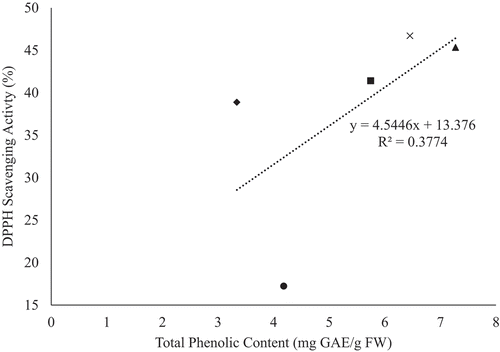
Figure 5. Correlation between total phenolic content and FRAP activity for fresh genotypes.
Conclusions
Plums are a rich source of phenolic compounds and antioxidants which provide many health benefits, while also having potential value to various nutraceutical industries. Total phenolic content and antioxidant capacity of five Yellow European Plum genotypes were studied through the heat reflux extraction. Fresh and freeze dried YEPs were extracted at 50, 60, and 70°C where freeze dried samples exhibited the highest amount of total phenolic content and antioxidant activity in the plum genotypes, by increasing the bioavailability of the nutrients. Extraction at 60°C yielded the highest amount of total phenolics, DPPH scavenging activity, and FRAP activity. Neochlorogenic acid was shown to be the predominant phenolic compound among all genotypes. Since the study only quantified three phenolic compounds, future work could focus on quantification of other predominant phytochemicals and anthocyanins in plums such as catechin and cyanidin-3-glucoside.
research_paper1-supplementary_file.docx
Download MS Word (10.3 MB)Acknowledgments
The authors would like to thank OMAFRA for a research grant through OMAFRA-UofG program to Dr. Subramanian and the support of Ontario Tender Fruit Marketing Board (OTFMB) and Niagara Peninsula Fruit and Vegetable Grower’s Association (NPFVGA). The authors appreciate the technical help and guidance provided by Ms. Carolyn Dowling-Osborn.
Funding
This work was supported by the Ontario Ministry of Agriculture, Food and Rural Affairs.
Supplemental data
Supplemental data for this article can be accessed at publisher’s website.
Additional information
Funding
Related Research Data
References
- Arion, C.M., J. Tabart, C. Kevers, M. Niculaua, R. Filimon, D. Beceanu, and J. Dommes. 2014. Antioxidant potential of different plum cultivars during storage. Food Chem. 146:485–491. doi:10.1016/j.foodchem.2013.09.072.
- Brar, H.S., A. DiNardo, J. Subramanian, G.R. Nair, and A. Singh. 2017. Unpublished Data.
- Canada, S., 2016. Table 001-0009 - Area, production and farm gate value of fresh and processed fruits, by province, annual [WWW Document]. URL http://www5.statcan.gc.ca/cansim/a26?lang=eng&id=10009 ( accessed 11.17. 16).
- Chun, O.K., D.O. Kim, and C.Y. Lee. 2003b. Superoxide radical scavenging activity of the major polyphenols in fresh plums. J. Agric. Food Chem. 51:8067–8072. doi:10.1021/jf034740d.
- Chun, O.K., D.-O. Kim, H.Y. Moon, H.G. Kang, and C.Y. Lee. 2003a. Contribution of individul polyphenolics to total antioxidant capacity of plums. J. Agric. Food Chem. 51:7240–7245. doi:10.1021/jf0343579.
- Cremin, P., S. Kasim-Karakas, and A.L. Waterhouse. 2001. LC/ES-MS detection of hydroxycinnamates in human plasma and urine. J. Agric. Food Chem. 49:1747–1750. doi:10.1021/jf000764y.
- Dai, J., and R.J. Mumper. 2010. Plant phenolics: extraction, analysis and their antioxidant and anticancer properties. Molecules. 15:7313–7352. doi:10.3390/molecules15107313.
- Dowling, C. 2014. The Polyphenolic Composition and Antioxidant Capacity of Yellow European Plums (Prunus domestica L.) and Novel Golden Prunes. Guelph, ON, University of Guelph, MSc. Thesis.
- FAO. 2011. Food and Agriculture Organization of the United Nations - Statistics Division [WWW Document]. URL http://faostat.fao.org/beta/en/#compare ( accessed 11.17.16).
- Fatiha, B., M. Khodir, D. Farid, R. Tiziri, B. Karima, O. Sonia, and C. Mohamed. 2012. Optimisation of solvent extraction of antioxidants (phenolic compounds) from Algerian Mint (Mentha spicata L). Pharmacogn. Commun. 2:72–86. doi:10.5530/pc.2012.4.1.
- Gil, M.I., F.A. Tomás-Barberán, B. Hess-Pierce, and A.A. Kader. 2002. Antioxidant capacities, phenolic compounds, carotenoids, and vitamin C contents of nectarine, peach, and plum cultivars from California. J. Agric. Food Chem. 50:4976–4982. doi:10.1021/jf020136b.
- Goldner, K., S.V. Michaelis, M. Neumüller, and D. Treutter. 2015. Phenolic contents in fruit juices of plums with different skin colors. J. Appl. Bot. Food Qual. 88:322–326. doi:10.5073/JABFQ.2015.088.046.
- Graf, B.A., P.E. Milbury, and J.B. Blumberg. 2005. Mini-review flavonols, flavones, flavanones, and human health: epidemiological evidence. J. Med. Food. 8:281–290. doi:10.1089/jmf.2005.8.281.
- Jaiswal, R., H. Karakose, S. Ruhmann, K. Goldner, M. Neumuller, D. Treutter, and N. Kuhnert. 2013. Identification of phenolic compounds in plum fruits (Prunus salicina L. and Prunus domestica L.) by high-performance liquid chromatography/tandem mass spectrometry and characterization of varieties by quantitative phenolic fingerprints. J. Agric. Food Chem. 61:12020–12031. doi:10.1021/jf402288j.
- Kim, D.O., O.K. Chun, Y.J. Kim, H.Y. Moon, and C.Y. Lee. 2003. Quantification of polyphenolics and their antioxidant capacity in fresh plums. J. Agric. Food Chem. 51:6509–6515. doi:10.1021/jf0343074.
- Krishnaswamy, K., V. Orsat, Y. Gariépy, and K. Thangavel. 2013. Optimization of microwave-assisted extraction of phenolic antioxidants from grape seeds (Vitis vinifera). Food Bioprocess Technol. 6:441–455. doi:10.1007/s11947-012-0800-2.
- Manohar, C.M., Xue, J., Murayyan, A., Neethirajan, S., Shi, J., 2017. Antioxidant activity of polyphenols from Ontario grown onion varieties using pressurized low polarity water technology. J. Funct. Foods 31, 52–62. doi:10.1016/j.jff.2017.01.037.
- Melicháčová, S., M. Timoracká, J. Bystrická, A. Vollmannová, and J. Čéry. 2010. Relation of total antiradical activity and total polyphenol content of sweet cherries (Prunus avium L.) and tart cherries (Prunus cerasus L.). Acta Agric. Slov. 95:21–28. doi:10.2478/v10014-010-0003-3.
- Murcia, M.A., A.M. Jiménez, and M. Martínez-Tomé. 2001. Evaluation of the antioxidant properties of Mediterranean and tropical fruits compared with common food additives. J. Food Prot. 64:2037–2046. doi:10.4315/0362-028X-64.12.2037.
- Nawaz, H., J. Shi, G.S. Mittal, and Y. Kakuda. 2006. Extraction of polyphenols from grape seeds and concentration by ultrafiltration. Sep. Purif. Technol. 48:176–181. doi:10.1016/j.seppur.2005.07.006.
- Pandey, K.B., and S.I. Rizvi. 2009. Plant polyphenols as dietary antioxidants in human health and disease. Oxid. Med. Cell. Longev. 2:270–278. doi:10.4161/oxim.2.5.9498.
- Pham-Huy, L.A., H. He, and C. Pham-Huy. 2008. Free radicals, antioxidants in disease and health. Int. J. Biomed. Sci. 4:89–96. doi:10.1073/pnas.0804252105.
- Piga, A., A. Del Caro, and G. Corda. 2003. From plums to prunes: influence of drying parameters on polyphenols and antioxidant activity. J. Agric. Food Chem. 51:3675–3681. doi:10.1021/jf021207+.
- Piirainen, L., K. Peuhkuri, K. Bäckström, R. Korpela, and S. Salminen. 2007. Prune juice has a mild laxative effect in adults with certain gastrointestinal symptoms. Nutr. Res. 27:511–513. doi:10.1016/j.nutres.2007.06.008.
- Piluzza, G., and S. Bullitta. 2011. Correlations between phenolic content and antioxidant properties in twenty-four plant species of traditional ethnoveterinary use in the Mediterranean area. Pharm. Biol. 49:240–247. doi:10.3109/13880209.2010.501083.
- Prior, R.L., X. Wu, and K. Schaich. 2005. Standarized methods for the determination of antioxidant capacity and phenolics in foods and dietary supplements. J. Agric. Food Chem. 53:4290–4302. doi:10.1021/jf0502698.
- Rendina, E., Y.F. Lim, D. Marlow, Y. Wang, S.L. Clarke, S. Kuvibidila, E.A. Lucas, and B.J. Smith. 2012. Dietary supplementation with dried plum prevents ovariectomy-induced bone loss while modulating the immune response in C57BL/6J mice. J. Nutr. Biochem. 23:60–68. doi:10.1016/j.jnutbio.2010.10.010.
- Rop, O., T. Jurikova, J. Mlcek, D. Kramarova, and Z. Sengee. 2009. Antioxidant activity and selected nutritional values of plums (Prunus domestica L.). Typical of the White Carpathian Mountains. Sci. Hortic. (Amsterdam). 122:545–549. doi:10.1016/j.scienta.2009.06.036.
- Routray, W. 2014. Effect of different extraction methods, environmental and post-harvest factors on yield of phenolic compounds from blueberry leaves. Montreal, QC, McGill University, PhD Thesis.
- Routray, W., V. Orsat, and Y. Gariepy. 2014. Effect of different drying methods on the microwave extraction of phenolic components and antioxidant activity of highbush blueberry leaves. Dry. Technol. 32:1888–1904. doi:10.1080/07373937.2014.919002.
- Rupasinghe, H.P.V., S. Jayasankar, and W. Lay. 2006. Variation in total phenolics and antioxidant capacity among European plum genotypes. Sci. Hortic. (Amsterdam). 108:243–246. doi:10.1016/j.scienta.2006.01.020.
- Shukitt-Hale, B., W. Kalt, A.N. Carey, M. Vinqvist-Tymchuk, J. McDonald, and J.A. Joseph. 2009. Plum juice, but not dried plum powder, is effective in mitigating cognitive deficits in aged rats. Nutrition. 25:567–573. doi:10.1016/j.nut.2008.10.018.
- Singh, A., Orsat, V., 2015. Key Considerations in the Selection of Ingredients and Processing Technologies for Functional Foods and Nutraceutical Products, p. 79-111. In: J.I. Boyce (ed.). Nutraceutical and Functional Food Processing Technology. John Wiley & Sons, Ltd, Saint-Hyacinthe.
- Singh, A., K. Sabally, S. Kubow, D.J. Donnelly, Y. Gariepy, V. Orsat, and G.S.V. Raghavan. 2011. Microwave-assisted extraction of phenolic antioxidants from potato peels. Molecules. 16:2218–2232. doi:10.3390/molecules16032218.
- Slimestad, R., E. Vangdal, and C. Brede. 2009. Analysis of phenolic compounds in six Norwegian plum cultivars (Prunus domestica L.). J. Agric. Food Chem. 57:11370–11375. doi:10.1021/jf902054x.
- Spigno, G., L. Tramelli, and D.M. De Faveri. 2007. Effects of extraction time, temperature and solvent on concentration and antioxidant activity of grape marc phenolics. J. Food Eng. 81:200–208. doi:10.1016/j.jfoodeng.2006.10.021.
- Stacewicz-Sapuntzakis, M. 2013. Dried plums and their products: composition and health effects–an updated review. Crit. Rev. Food Sci. Nutr. 53:1277–1302. doi:10.1080/10408398.2011.563880.
- Tokuşoğlu, Ö. 2011. Phenolic and beneficial bioactives in drupe fruits. p. 83-106. In: Ö. Tokuşoğlu, and C.A. Hall III (eds.). Fruit and Cereal Bioactives: Sources, Chemistry, and Applications. CRC Press, Boca Raton.
- Tomás-Barberán, F.A., M.I. Gil, P. Cremin, A.L. Waterhouse, B. Hess-Pierce, and A.A. Kader. 2001. HPLC-DAD-ESIMS analysis of phenolic compounds in nectarines, peaches, and plums. J. Agric. Food Chem. 49:4748–4760. doi:10.1021/jf0104681.
- Vatai, T., M. Škerget, and Ž. Knez. 2009. Extraction of phenolic compounds from elder berry and different grape marc varieties using organic solvents and/or supercritical carbon dioxide. J. Food Eng. 90:246–254. doi:10.1016/j.jfoodeng.2008.06.028.
- Yao, L.H., Y.M. Jiang, J. Shi, F.A. Tomás-Barberán, N. Datta, R. Singanusong, and S.S. Chen. 2004. Flavonoids in food and their health benefits. Plant Foods Hum. Nutr. 59:113–122. doi:10.1007/s11130-004-0049-7.